MRD:thl3318
EXERCISE 1: H + H2 system
On a potential energy surface diagram, how is the transition state mathematically defined? How can the transition state be identified, and how can it be distinguished from a local minimum of the potential energy surface?
On a potential energy surface diagram, the transition state can be mathematically defined as a saddle point (which is also an unstable equilibrium). It can be identified by determining the point where the partial derivatives of the function potential with respect to the internuclear distances are equal to 0.
and
However, simply looking at the results for the first derivative does not give any information with regards to whether the point is a local minimum, a local maximum, or a saddle point. Analyzing the 2nd derivative then allows for the determination of whether the point is a saddle point. This can be done using the following equation:
If D<0, the point is therefore a saddle point and also the transition state. Good. Pu12 (talk) 21:06, 11 June 2020 (BST)
Report your best estimate of the transition state position (rts) and explain your reasoning illustrating it with a “Internuclear Distances vs Time” plot for a relevant trajectory.
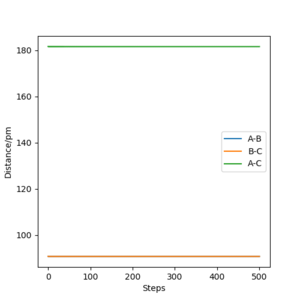
My best estimate for the transition state position is when the A-B and B-C distance is equal to 90.8pm. This point in the "Internuclear Distance vs Time" plot can be rationed as the transition state position because when the bonds have no momentum the bond distances remain constant.
Comment on how the mep and the trajectory you just calculated differ.
The mep and dynamics trajectory differ in many different ways. The first difference is the time it takes for the reaction to take place (in this case, for the distance to follow to the valley floor of the potential graph). In the mep trajectory, it takes around 30 steps (15 fs) for the reaction to proceed whereas in the dynamics trajectory this number is around 140 fs One cannot really talk about time when calculating an MEP, since it does not have a correspondence with how atoms move physically. You can compare the number of steps it takes to reach the same atom position, but this is not very meaningful from a physical point of view. João (talk) 11:09, 14 June 2020 (BST) . The second difference is that the internuclear distance between the H2 molecule and the lone H atom increases logarithmically in the mep calculation but increases linearly in the dynamics calculation.
What about vibrations about the bond? Pu12 (talk) 21:06, 11 June 2020 (BST)
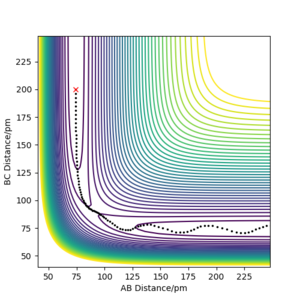
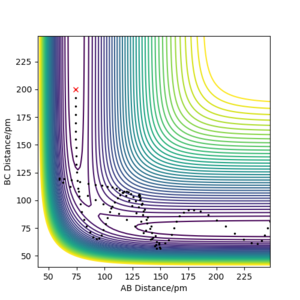
Complete the table below by adding the total energy, whether the trajectory is reactive or unreactive, and provide a plot of the trajectory and a small description for what happens along the trajectory. What can you conclude from the table?
| p1/ g.mol-1.pm.fs-1 | p2/ g.mol-1.pm.fs-1 | Etot | Reactive? | Description of the dynamics | Illustration of the trajectory |
|---|---|---|---|---|---|
| -2.56 | -5.1 | -414.280 KJ.mol-1 | Yes | Plot shows trajectory going from reactant, going over the minimum energy path via the transition state and finally to form the product What about changes in vibration?. Pu12 (talk) 21:06, 11 June 2020 (BST)
. |
 |
| -3.1 | -4.1 | -420.077 KJ.mol-1 | No | Plot shows the trajectory going up the potential slope towards the transition state. However it does not have enough momentum to go over the curve and thus the trajectory returns to its original position. The reaction does not proceed and the reactants remain. | 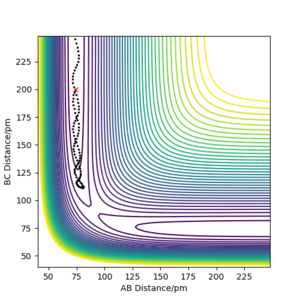 |
| -3.1 | -5.1 | -413.997 KJ.mol-1 | Yes | Plot shows that increasing the momentum of the H-H bond in the reactants results in more vibrational energy hence a more distinct wave pattern appears in the trajectory. Similar to the first plot, the trajectory shows the reactant forming the product by going over the minimum energy path via the transition state.Good. Pu12 (talk) 21:06, 11 June 2020 (BST) |  |
| -5.1 | -10.1 | -357.277 KJ.mol-1 | Yes | Plot shows the trajectory having an "excess" amount of momentum causing the H atom in the middle to bounce back and forth between molecules. The trajectory eventually goes to the product but does not go through the transition state This calculation should result in system recrossing wherein the trajectory goes past the transition state but then returns to the reactants. Pu12 (talk) 21:06, 11 June 2020 (BST)
You are using a too bit step size. This make your simulations inaccurate and causing your energy not to be conserved. João (talk) 11:09, 14 June 2020 (BST)
. || | |
| -5.1 | -10.6 | -349.477 KJ.mol-1 | Yes | Plot is similar to that above in that the trajectory has an "excess" amount of momentum. The trajectory eventually goes to the product but does not go through the transition state. | 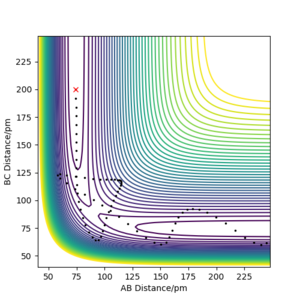 |
From the table above, I can conclude that whether or not a trajectory results in a reaction depends on the momentum p2. Changing the momentum p1 does not affect the result of the trajectory but if momentum p2 is not great enough the result will be unreactive. Changes to p1 can affect the result of the trajectory if you test enough examples, it's unfortunate that your trajectory did not come out as it should because this question is mainly concerning system recrossing occurring which can only be seen in the fourth example. Pu12 (talk) 21:06, 11 June 2020 (BST)
Given the results you have obtained, how will Transition State Theory predictions for reaction rate values compare with experimental values?
Transition State Theory predictions will overestimate rate values when compared with experimental values. There are many assumptions that are made in the Transition State Theory but the most important of them all is that multiple crossing do not occur on the potential surface. This assumption therefore assumes that the entire trajectory across the surface contributes to the reaction rate, failing to take into account the possibility of recrossings which actually lowers the reaction rate from reactants to products. As a result, Transition State Theory will overestimate reaction rate values.[1] You can't see this from your examples specifically but good, this is correct. Pu12 (talk) 21:06, 11 June 2020 (BST)
EXERCISE 2: F + H2 system
By inspecting the potential energy surfaces, classify the F + H2 and H + HF reactions according to their energetics (endothermic or exothermic). How does this relate to the bond strength of the chemical species involved?
The F + H2 reaction is exothermic whereas the H + HF reaction is endothermic. This means that the H-F bond strength is greater than the H-H bond strength and is lower in energy. You should demonstrate why with figures. Pu12 (talk) 21:06, 11 June 2020 (BST)
Locate the approximate position of the transition state.
H-H distance = 77pm
H-F distance = 179.5pm

Report the activation energy for both reactions.
transition state energy = -433.020
H-H energy = -435.100
H-F energy = -560.700
Activation energy for F + H2 --> HF + H = 2.080 A little high but close enough, also units? Pu12 (talk) 21:06, 11 June 2020 (BST)
Activation energy for H + HF --> H2 + F = 127.68
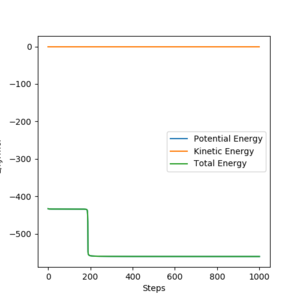
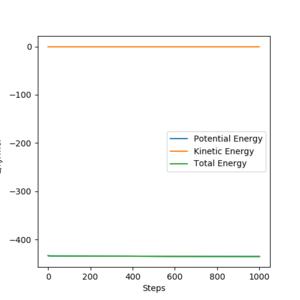
In light of the fact that energy is conserved, discuss the mechanism of release of the reaction energy. Explain how this could be confirmed experimentally.
Although energy is conserved in the reaction, there is a change from kinetic energy to potential energy during the collision Vibrational energy is technically also a kinetic energy. Pu12 (talk) 21:06, 11 June 2020 (BST) . Upon the H2 molecule colliding with the F atom, an elastic collision occurs and the kinetic energy of the H2 molecule (in the form of translational motion) is converted into potential energy of the HF molecule (in the form of vibrational motion). This can be confirmed experimentally by measuring whether there is an increase in vibrational motion by using IR spectroscopy.
Given the problems you had above, you could be having problems of conservation of energy due to a too large step size. João (talk) 11:09, 14 June 2020 (BST)
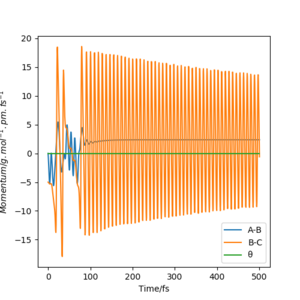
Discuss how the distribution of energy between different modes (translation and vibration) affect the efficiency of the reaction, and how this is influenced by the position of the transition state.
For reactions with an early transition state (reactant-like), the efficiency of the reaction is most enhanced by the relative translation energy of the two atoms/molecules colliding. However for reactions with a late transition state (product-like), the efficiency of the reaction is most enhanced by vibrational excitation has a higher efficiency in enhancing the reactivity.[2] You should state that this is due to Poanyi's rules and potentially give some examples from simulations. Pu12 (talk) 21:06, 11 June 2020 (BST)
