MRD:tfi15
Molecular Reaction Dynamics: Applications to Triatomic systems
Exercise 1: H + H2 system
What value does the total gradient of the potential energy surface have at a minimum and at a transition structure? Briefly explain how minima and transition structures can be distinguished using the curvature of the potential energy surface.
The total gradient of the potential energy surface at a minimum and at a transition structure is zero. This is because transition state happens at the maximum point of the lowest energy path between reactants and products. Maximum and minimum points of the potential energy surface are the turning points of the plot. Therefore, by taking the first derivative of the points, a gradient of zero will be obtained. Second derivative of the potential energy surface curve is taken to distinguish between minima and transition structures. A negative value of second derivative indicates that the point is at maximum, which is where the transition structure is located. On the other hand, a positive value of second derivative indicates that the point is a minima.
Nf710 (talk) 09:46, 9 June 2017 (BST) The TS must be determined in the reaction coordinates
Best estimate of the transition state position (rts)
The transition state position is determined as 0.90774 Å.
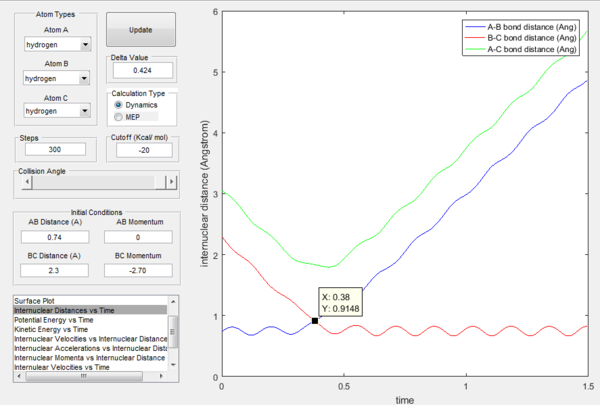
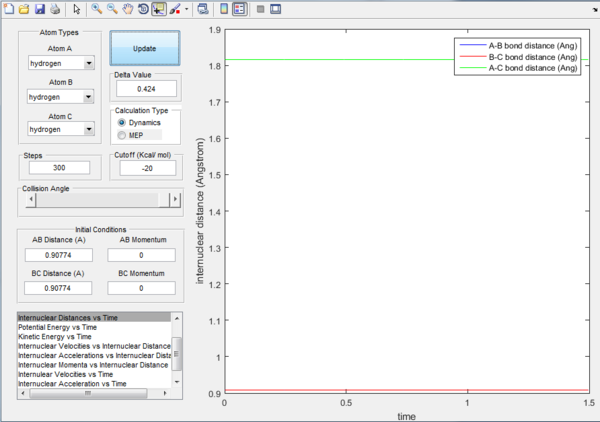
Since the H + H2 surface is symmetric, it is expected that at the transition state, all three atoms are at equal distance to each other (ie. r1 = r2). By referring to Figure 1, rts can roughly be determined as 0.9148 where r1 and r2 plot crosses. To obtain a more accurate value of rts, intermolecular distance versus time graph is used as shown in Figure 2. Since r1 = r2 and there is no net force acting on the atoms, momentum is at 0. At distance = 0.90774 Å, there is no change at the positions of atoms and the bond lengths remained constant. No movement of atoms indicating the occurrence of a transition state.
How the mep and the trajectory calculated differ.
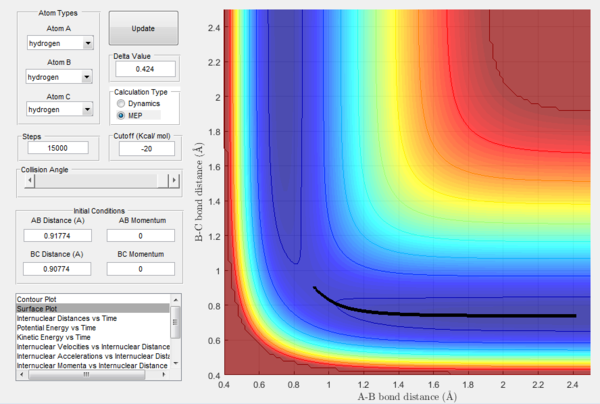
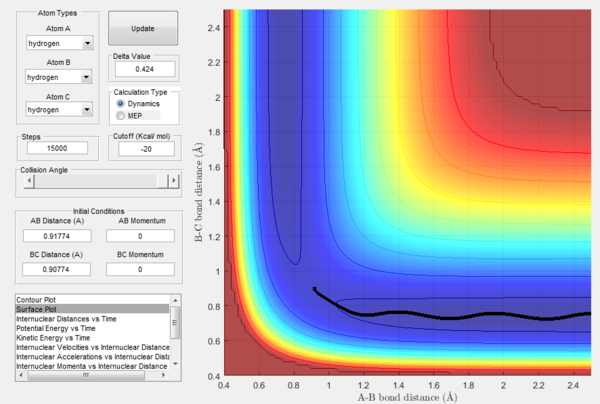
Trajectories of the reaction is calculated using mep and dynamics methods and are shown in Figure 3 and 4 respectively. Initial conditions are set such that they differ from transition state slightly as r1 = rts + 0.01, r2 = rts and p1 = p2 = 0. Since r1 > rts while r2 = rts, a tendency is set up for reaction to take place.
As shown in Figure 3, the trajectory calculated using mep is a straight line and only travels along the bottom of the potential valley. This is because it shows an infinitely slow motion of the lowest energy path. Velocity is reset to zero for each step. Therefore, kinetic energy is also reset to zero for each step. Thus, no oscillation motion is observed and only a straight line is shown. On the other hand, Figure 4 shows the trajectory calculated using dynamics where a wavy pattern is observed. This is because dynamics calculation takes into account of the mass of atom and vibrational energy of molecule. Thus, energy conservation oscillation is allowed. Hence, the trajectory can travel to either sides of the potential valley and a wavy pattern is observed.
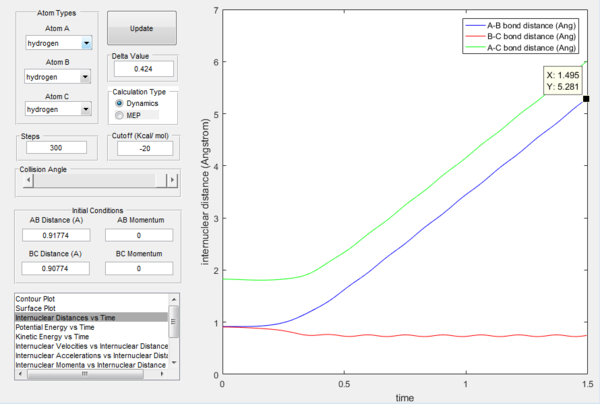
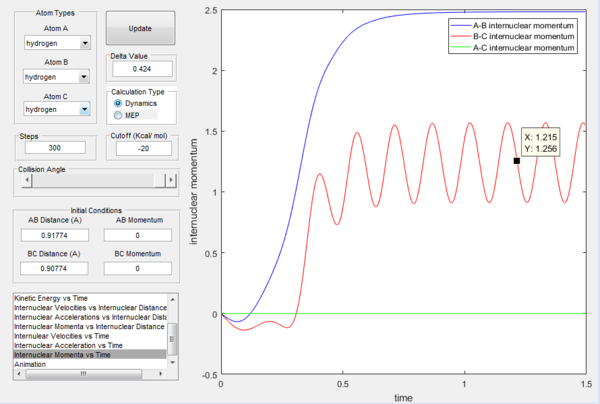
Figure 5 shows the intermolecular distance versus time graph and Figure 6 shows the molecular momenta versus time graph. At large t, values of r1, r2, p1 and p2 are obtained as follow:
r1 = 0.7455
r2 = 5.281
p1 = 1.256
p2 = 2.48
Changing the initial conditions to r1 = rts and r2 = rts + 0.01 will give the same results. This is because both reactants and products are the same.
Setting up a new calculation using the previous final conditions as the initial conditions will result in a trajectory of the same shape and characteristics but travelling in the opposite direction. This is because the momenta is reversed and therefore reaction will occur in the reverse direction.
Reactive and Unreactive Trajectories
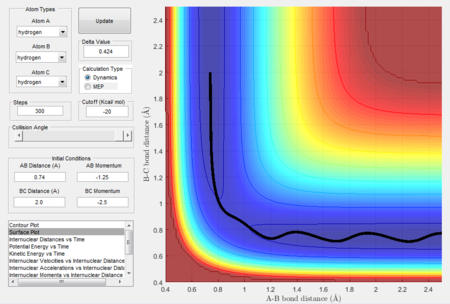
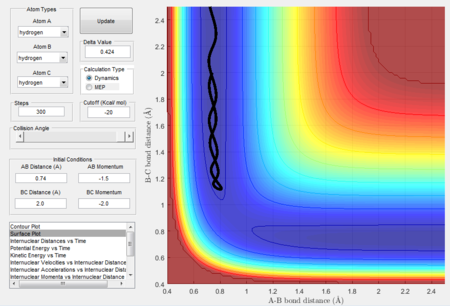
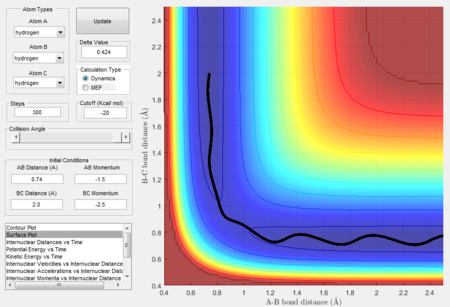
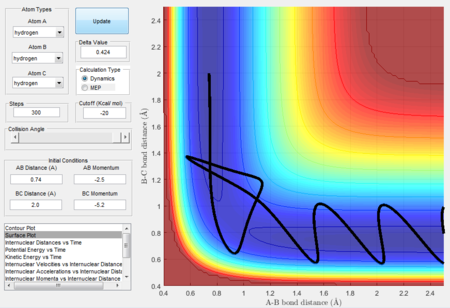
Initial positions of r1 = 0.74 and r2 = 2.0 are run with a series of momentum.
Assumptions of Transition State Theory
There are three main assumptions of Transition State Theory:[1]
1. A system is operating at equilibrium
2. It focuses on only one reaction pathway
3. Recrossing of energy barrier is negligible
Transition State Theory predictions is likely give an overestimation of the reaction rate than the experimental values. This is because the theory states that once there is sufficient energy in the system and that transition state is reached, reactants will turn into products. However, as shown in the case of Figure 10, the theory does not hold true. Although there is sufficient energy for system to reach the transition state, reactants remained. This is because when the high momentum is applied and the energy level of reactants is too high, atoms might not be in the right vibration modes. Instead of colliding in the correct orientation, excess energy will bounce reactants away and therefore reaction will not proceed. Thus, the experimental reaction rate value will be lower than the prediction using Transition State Theory.
Exercise 2: F - H - H system
F + H2 Reaction
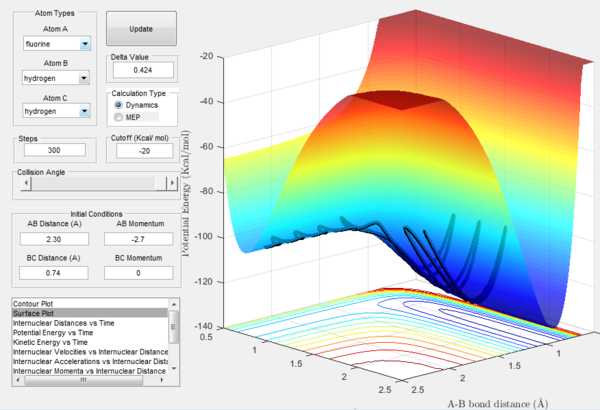
As shown in Figure 12, F + H2 Reaction is exothermic. The potential energy of exit channel is much higher than that of the entrance channel.This indicates that energy level of H-F bond is higher than that of H-H bond. This shows the the bond strength of H-F bond is much stronger than that of H-H bond. Therefore, more energy is required to break the H-F bond that of H-H bond. Hence, resulting in a lower energy in the exit channel.
H + HF Reaction
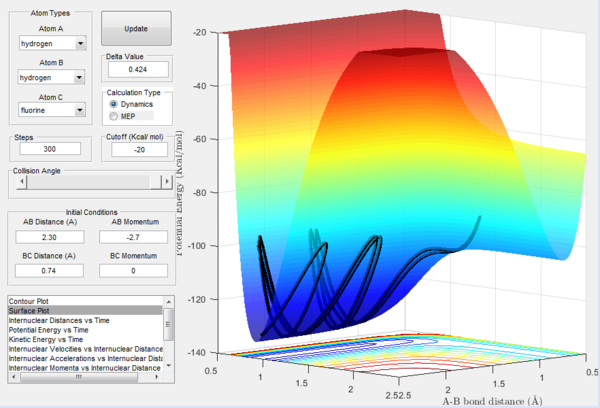
By referring to Figure 13, H + HF Reaction is endothermic. It is shown that the potential energy of exit channel is lower that that of the entrance channel. This indicates that the energy level of H-F bond is higher than that of H-H bond. This is because H-F bond is much stronger that H-H bond. The system has to overcome a high activation energy barrier for the reaction to proceed.
Locate the approximate position of the transition state.

Transition state is located at the maximum point of the lowest energy path. However, in an exothermic reaction, the activation energy barrier is very small that it is difficult to locate the exact maximum point. However, Hammond's postulate states that transition state occurs and resembles the structure which has a similar energy content. Therefore, in this exothermic reaction, it is determined that the transition state is at a similar energy content as the reactants.
At the transition state, it is expected that no movement of atom will be seen. As shown in Figure 14, this holds true when rHF is 1.8111 Å and rHH is 0.7456 Å. The three atoms stay in constant position as no change in intermolecular distance is observed over time. Value of zero will be obtained if the first derivative of the curve is taken, proving that it is where the transition state is located.
Report the activation energy for both reactions.
F + H2 Reaction

Activation energy of the F + H2 reaction is 0.2 kcal / mol, as shown in Figure 15. This small activation energy barrier is as expected as this is an exothermic process. mep calculations is used as resets the velocity to zero at each step which eliminates the build up of potential energy which leads to an inaccurate result.
Nf710 (talk) 10:19, 9 June 2017 (BST) You could have done a dynamics calculation here to get a lower energy.
H + HF Reaction
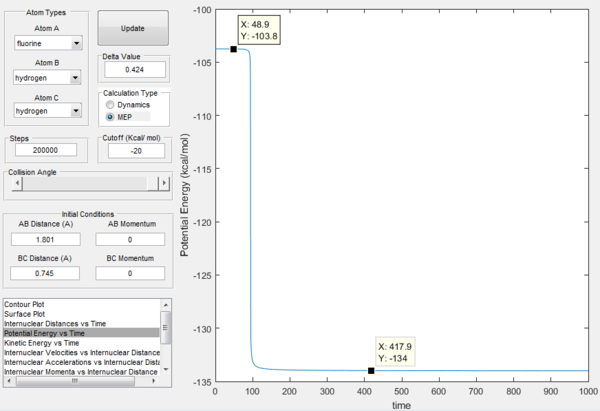
Activation energy of the H + HF reaction is 30.2 kcal / mol, as shown in Figure 16. This larger activation energy barrier is as expected as this is an endothermic process as compared to Figure 15.
Reaction Dynamics
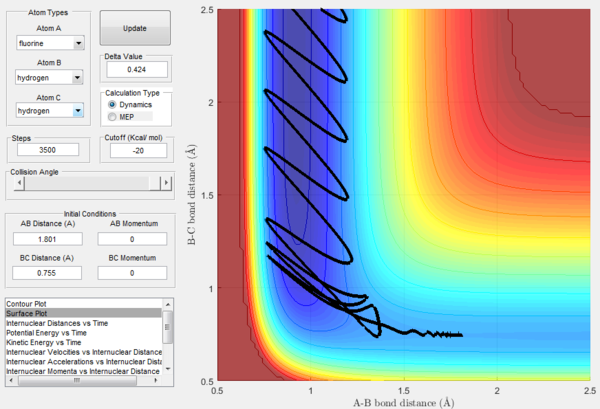
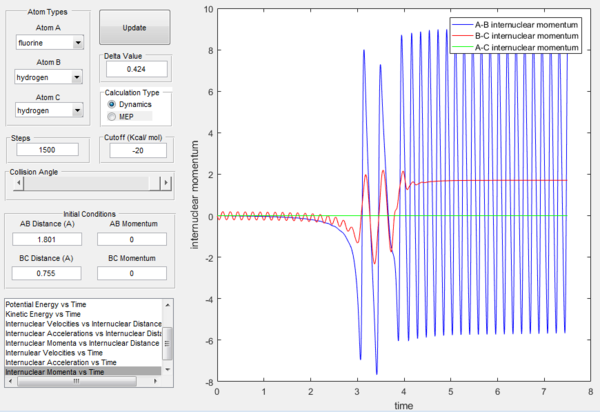
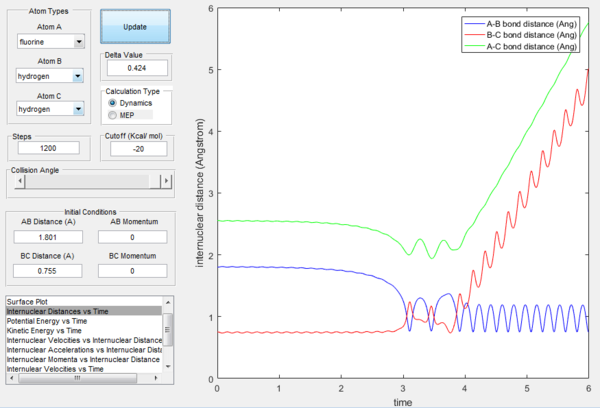
Looking at the F + H2 reaction, reaction takes place with initial conditions r1 = 1.801, r2 = 0.755 and p1 = p2 = 0. As shown in Figure 17, a reactive trajectory is observed. HF bond distance is set to be shorter than the transition state distance while HH bond distance is set to be longer. Momentum is set to be zero. However, the reaction still proceeds. This is because H-F bond is stronger than H-H bond. Therefore, the high stabilisation energy of the H-F product drives the reaction process.This can also been confirmed by Figure 18, where the oscillation of H-H bond is much smaller than that of H-F bond. In addition, oscillation of initial H-H bond is much smaller than that of the final H-F bond. This indicates that there is a conserve of energy where energy is transferred between the two bonds.
By looking at the animation of the reaction process, it is observed that the reaction takes place in a two-step process. First transition state happens when F atom approaches H2. H-F bond distance decreases while H-H bond distance increases. Second transition state is when the F atom bounces back and the F-H bond distance increases and H-H bond distance decreases. Afterwards, H-F bond distance remains constant and oscillates while H atom moves away. This can be confirmed by Figure 19 where two humps of increase in H-F intermolecular distance can be seen.
Calorimetry can be used to determine the reaction dynamics experimentally. This is because energy is conserved and potential energy will be converted to vibrational energy which is released as heat. Therefore, the change in temperature of the reaction process can be observed using a calorimetry.
How distribution of energy between different modes (translation and vibration) affect the efficiency of the reaction
The Polanyi's empirical rules states that in a late-barrier reaction, vibrational energy is more efficient than translational energy in promoting the transition state. Series of calculations is carried out to examine this rule.
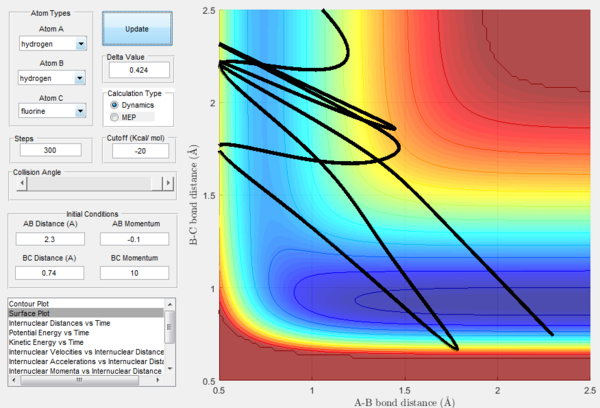
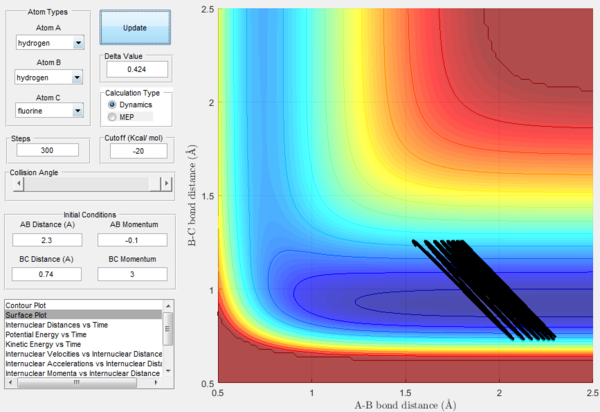
In Figure 20, a reactive trajectory is observed. This is as expected as this is an endothermic reaction which has a late-barrier and the initial conditions applied are of low translational energy and high vibrational energy. On the other hand in Figure 21, unreactive trajectory is observed. This is because in the same endothermic reaction, both translational and vibrational energy applied are low. Therefore, it is expected that momentum will cancel and the energy is insufficient for the reaction to take place.
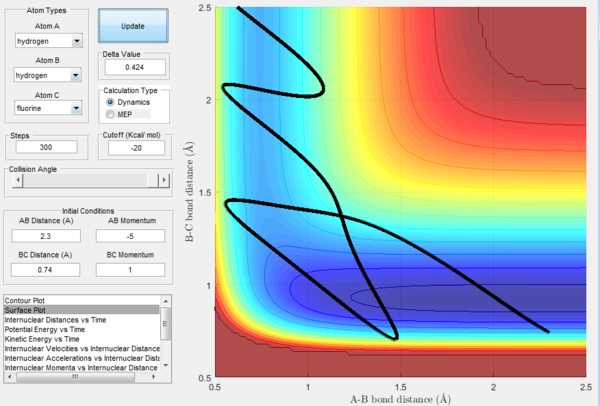
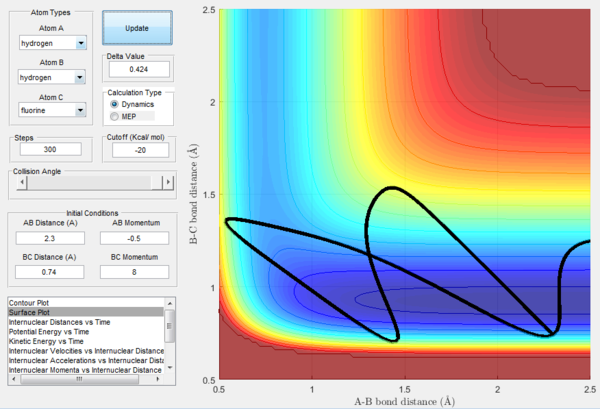
However, in some cases the Polanyi's rule does not hold true. As shown in Figure 22, where high translational energy and low vibrational energy is applied to an endothermic reaction with late-energy barrier, reactive trajectory is observed although the reaction is expected to be unreactive. Also, as shown in Figure 23, although a low translational energy and a high vibrational energy is applied to an endothermic reaction, an unreactive trajectory is shown. Therefore, the disagreement between the theory and the experimental results is needed to be further investigated.
Nf710 (talk) 10:30, 9 June 2017 (BST) You have proved the exo case. and some of your examples are a bit chotic, you could have proved the examples with less energetic states. Still other than that your report is well written.
References
- ↑ Anslyn, Eric V.; Dougherty, Dennis A., Transition State Theory and Related Topics. In Modern Physical Organic Chemistry University Science Books: 2006; pp 365–373.

