MRD:syk2017
H+H2 system
Dynamics from the transition state region
Transition state
On a potential energy surface diagram, how is the transition state mathematically defined? How can the transition state be identified, and how can it be distinguished from a local minimum of the potential energy surface?
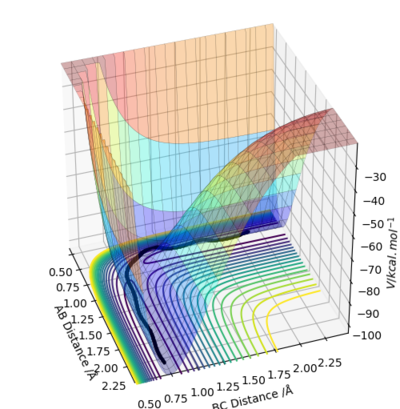
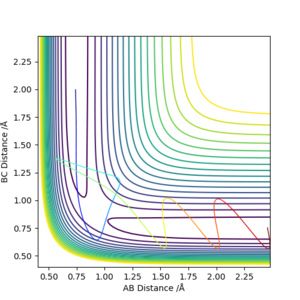
The transition state is a short-lived state of molecules or atoms at a local maximum in the reaction coordinate. Therefore, on a potential energy surface diagram, it can be defined as a local maximum of the minimum energy path (MEP). Mathematically it is a point where the gradient of potential is zero ( ∂V(ri)/∂ri=0). Although it is located in relatively low potential energy level, it actually is a local maximum point. It can be distinguished from other local minimum or local maximum points, as it should be located within the region of MEP.
Not really. R1 and R2 are not the dimensions in which you are looking for the maximum and minimum. You need to define two new vectors q1 and q2 and take the partial differential of V -the potential energy, relative to these. You will see when you look at the surface plot that q1 is a line that passes through the origin and obeys R1 is equal to R2, V has a minimum along this line. q2 is at 90 degrees to q1 and follows the reaction coordinate AB + C to A + BC, V has a maximum along this line.Mak214 (talk) 16:19, 23 May 2019 (BST)
Report your best estimate of the transition state position (rts) and explain your reasoning illustrating it with a “Internuclear Distances vs Time” plot for a relevant trajectory.

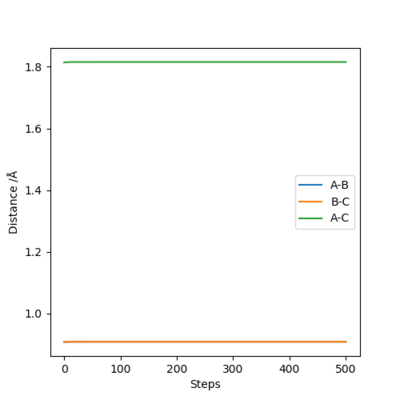
The best estimate is achieved at rts=0.907.
Good. Mak214 (talk) 16:19, 23 May 2019 (BST)
Since H+H2 is symmetric, the rAB and rBC should be equal. The figure 2 has only two lines, representing rBC and rAC . The rAB is not shown because rBC is overlapping it.
The definition of transition state suggests that the internuclear distance should stay constant throughout the given time, as ∂V(ri)/∂ri=0. The figure 2 shows that there is minimum vibration among the H atoms and no translation, suggesting the transition state.
Trajectories from r1 = rts+δ, r2 = rts
Following graphs are generated by calculation on r1=0.917 and r2=0.907 when p1=p2=0.
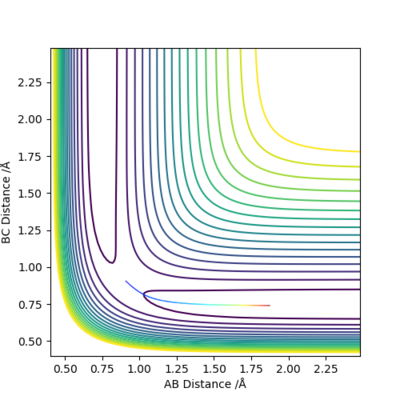
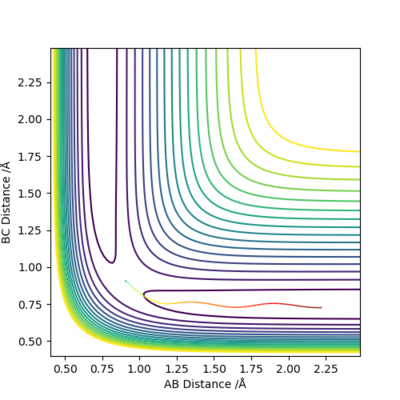
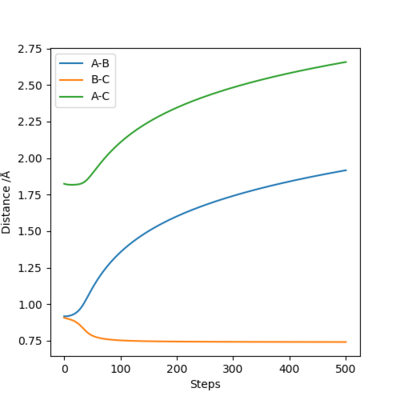
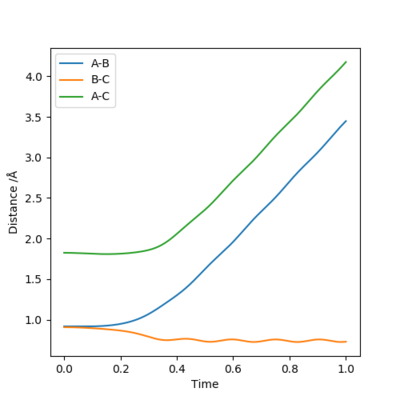
Comment on how the mep and the trajectory you just calculated differ.
In the MEP trajectory, the motion of molecule is infinitely slow that the momenta is reset to zero in every time step. This effectively takes the vibrational energy out of the system. Therefore, smooth line is shown MEP trajectories, when wavy line is shown in dynamic trajectory. Comparing figure 6 and figure 7, the Dynamic trajectories shows linearly increasing internuclear distance, and the MEP trajectories show decrease in the gradient. This is because MET plot is taken as each point being stationary (zero momenta), when the dynamic plot includes the momentum. Good. Mak214 (talk) 16:19, 23 May 2019 (BST)
For the calculation r1=rts and r2=rts+0.01, the reaction would be in the other way around.
Reactive and unreactive trajectories
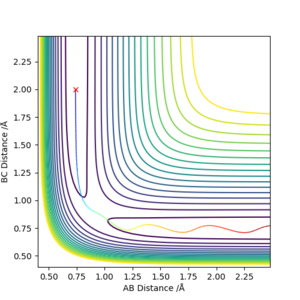
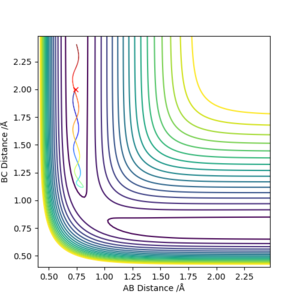
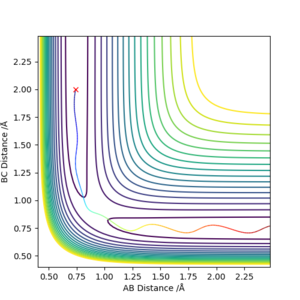
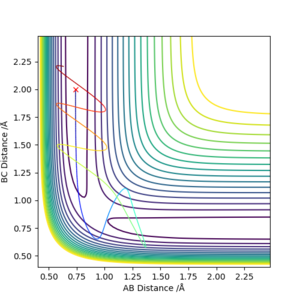
Complete the table above by adding the total energy, whether the trajectory is reactive or unreactive, and provide a plot of the trajectory and a small description for what happens along the trajectory. What can you conclude from the table?
initial positions : r1 = 0.74 and r2 = 2.0
OK. What can you conclude from this set of trajectories? Mak214 (talk) 16:19, 23 May 2019 (BST)
State what are the main assumptions of Transition State Theory. Given the results you have obtained, how will Transition State Theory predictions for reaction rate values compare with experimental values?
The transition stat theory (TST) is used to calculate reaction constant k.
The main assumptions are:
1. The electronic motion and nuclear motion is separated in the way similar to Born-Oppenheimer approximation
2. Molecules which have passed the transition state in the direction of product cannot reform the reactant.
3. In the transition state, motion along the reaction coordinate is separated from the other motions and treated as translation.
4. Transition state molecules are distributed among their states according to the Maxwell-Bpltzman law, even there is no equalibrium set.
5. The system is in quasi-equalibrium, where the reaction process is slow enough for internal equalibrium.[1]
Therefore, the experimental value is likely to be slower than the theoretical value, because the disrupting factors, such as backward reaction, are ignored in assumptions.
However, the TST also ignores tunnelling effect of quantum mechanics, which reduces energy barrier. This would make the experimental value faster than the theoretical value. Good. Mak214 (talk) 16:19, 23 May 2019 (BST)
F-H-H system
PES inspection
By inspecting the potential energy surfaces, classify the F + H2 and H + HF reactions according to their energetics (endothermic or exothermic). How does this relate to the bond strength of the chemical species involved?
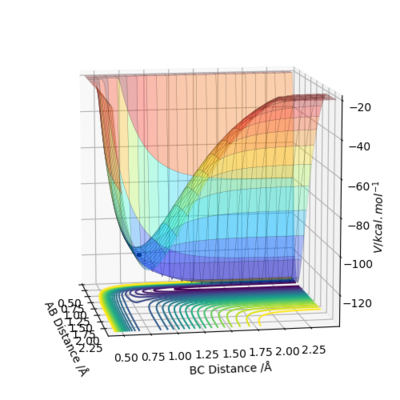
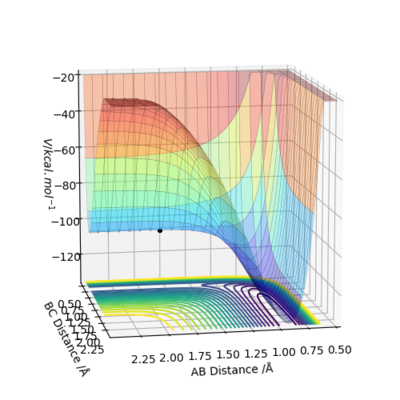
For the potential energy surface diagram of F+H2, the energy level goes down as the F atom and H2 molecule gets closer. This means that the energy level of product is lower than that of reactant, indicating it is a exothermic reaction. The reaction of H+HF shows completely opposite situation. The energy level increases as H-H gets closer, indicating that the reaction is endothermic. This is directly related to the bond energy. An exothermic reaction is when the bond energy of new bond of product is greater than broken bonds of reactant. Therefore, H-H bond is weaker than H-F bond.
Good. Mak214 (talk) 16:21, 23 May 2019 (BST)
Locate the approximate position of the transition state.
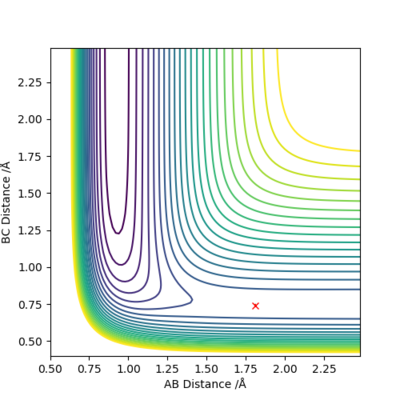
It is achieved at rFH=1.813 and rHH=0.74, when momenta=0.
Good. Mak214 (talk) 16:21, 23 May 2019 (BST)
Report the activation energy for both reactions.
F-H + H reaction:
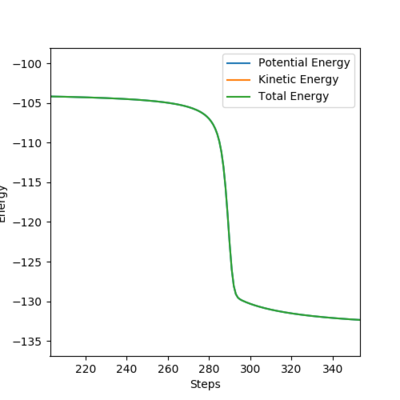
The reaction is achieved at rFH=1.65 and rHH=0.74
Activation energy =104.125-131.053=+26.928 kcalmol-1
H-H + F reaction:
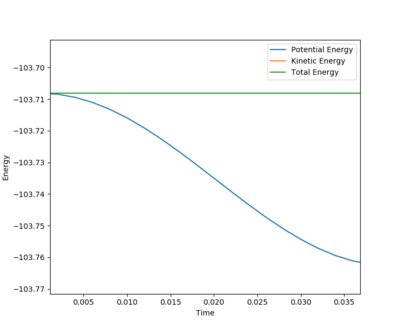
The reaction is achieved at rFH=1.89 and rHH=0.74
Activation energy = 103.708-103.762= +0.054kcalmol-1
Good. Mak214 (talk) 16:21, 23 May 2019 (BST)
Reaction dynamics
In light of the fact that energy is conserved, discuss the mechanism of release of the reaction energy. Explain how this could be confirmed experimentally.
The reaction is achieved at rFH=1.65 and rHH=0.74.
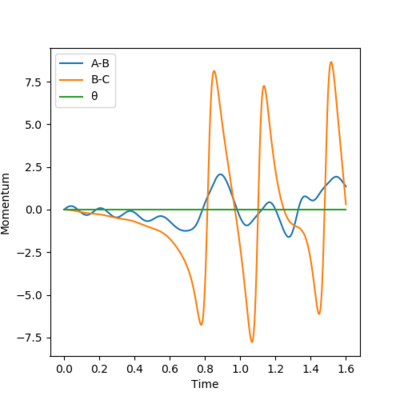
Energy is released due to the formation of H-F bond. And this causes the increase in oscillation of the bonds, as shown in [Figure 12]. This means the kinetic energy of the molecules has increased. Since temperature is defined as average kinetic energy, this can be experimentally identified by increase in temperature. Yes, also IR. Mak214 (talk) 16:24, 23 May 2019 (BST)
Discuss how the distribution of energy between different modes (translation and vibration) affect the efficiency of the reaction, and how this is influenced by the position of the transition state
Polanyi's empirical rules states vibration is more effective to promote a late-barrier reaction than the translation.


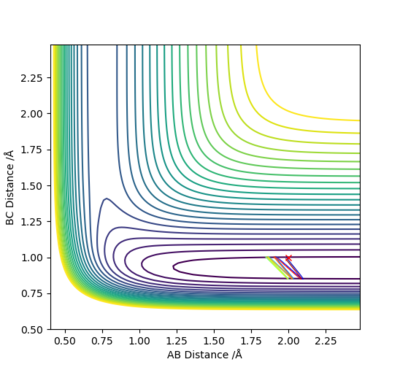
The illustrations above shows change in the collision path due to change in momentum of H. The momentum on F-H bond was set to 0.02. These plots are to investigate the effect of translation. All three plots have not shown reactive systems, but it gets worse if the translation is greater.
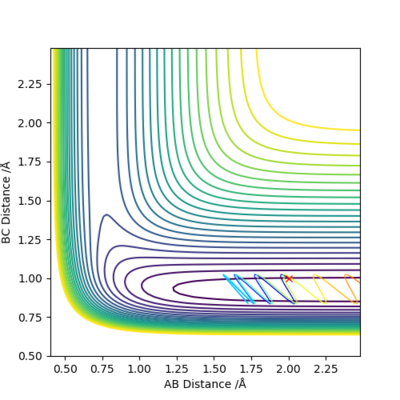
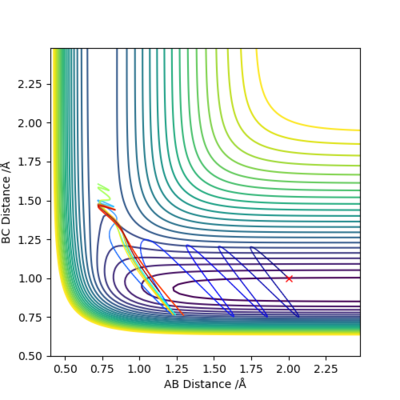
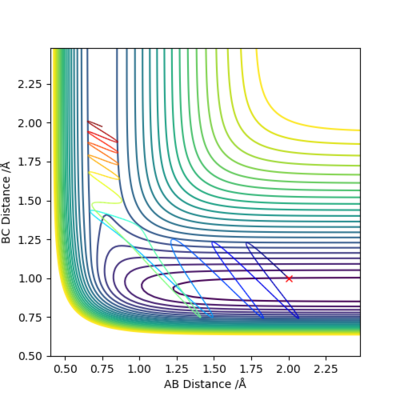
The illustration above shows the change in the collision path as the vibration of F-H bond increases. The momentum on H-H was set to -1.09. At pFH=6.0, the collision was almost reactive but it eventually returns to the reactants. At pFH=6.5, the system is finally found to be reactive. This clearly agrees with Polanyi's empirical rules, as increase in vibration is effective in promoting the reaction compared to the increase in translation. Nice illustration of your point. Good. Mak214 (talk) 16:24, 23 May 2019 (BST)
- ↑ J. I. Steinfeld, J. S. Francisco, W. L. Hase Chemical Kinetic and Dynamics, 1999, Upper Saddle River

