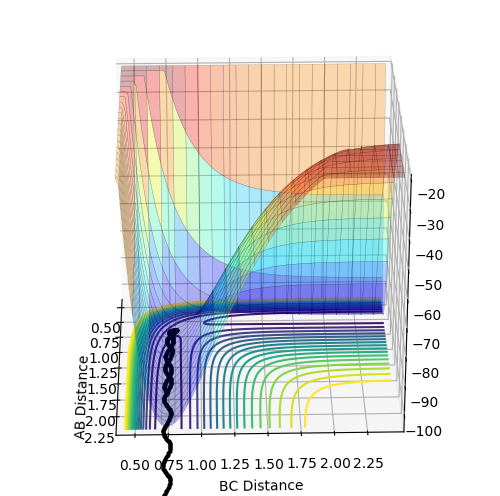
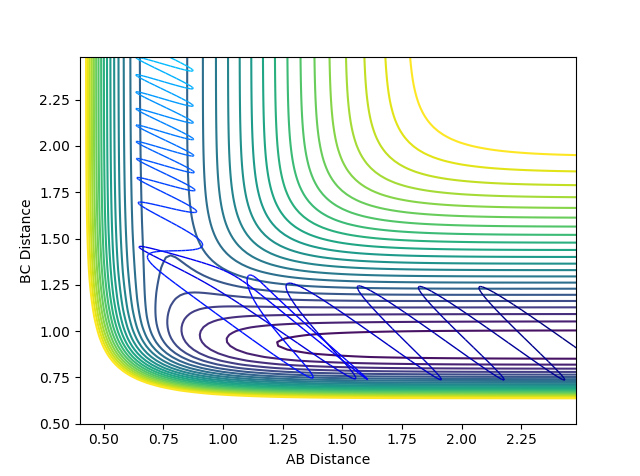
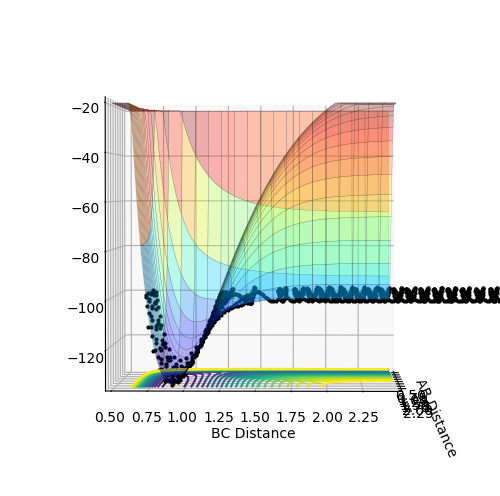
MRD:sth16
exercise 1
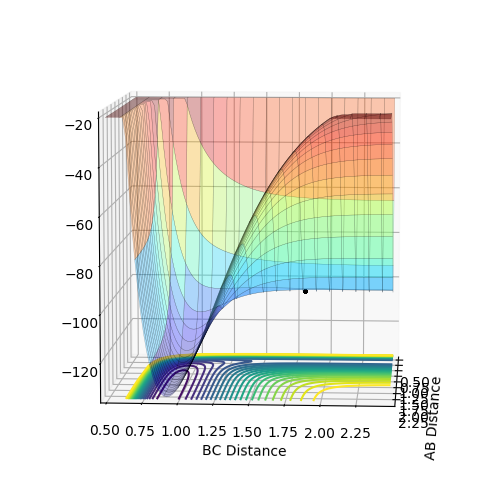
What value do the different components of the gradient of the potential energy surface have at a minimum and at a transition structure? Briefly explain how minima and transition structures can be distinguished using the curvature of the potential energy surface.
Minimum point will be a minima from all directions but for a transition structure it is a saddle point where it is a maxima along the reaction co-ordinate but a minima along the direction that is orthogonal to the reaction path.
For both minimum point and transition structure:
V stands for potential energy
r1= distance between A and B
r2 = distance between B and C
dV/dr1 = 0 dV/dr2 = 0
For minimum point : d2V/ dr1 > 0 d2V/ dr2 > 0 for all directions
The minimum will have a first derivative value equal to zero and a second derivative greater than zero along all directions and from all angles for all r (distances) .
For a saddle point (transition state) : d2V/ dr > 0 view along the way perpendicular to the reaction path for all r
d2V/ dr < 0 view along the reaction path for all
A transition structure is defined as the maxima on the minimum energy path. It is a saddle point where the maximum point of the reaction pathway meets the minimum point of the potential energy surface. For a saddle point, transition structure in this case, it will have a first derivative equals to zero but a negative second derivative if you view the 3d plot along the reaction co-ordinates axis and a positive second derivative in orthogonal directions to the reaction path (except reaction co-ordinates) and for all r.
Mm10114 (talk) 17:07, 7 June 2018 (BST) Well and detailed explanation.
Report your best estimate of the transition state position (rts) and explain your reasoning illustrating it with a “Internuclear Distances vs Time” plot for a relevant trajectory
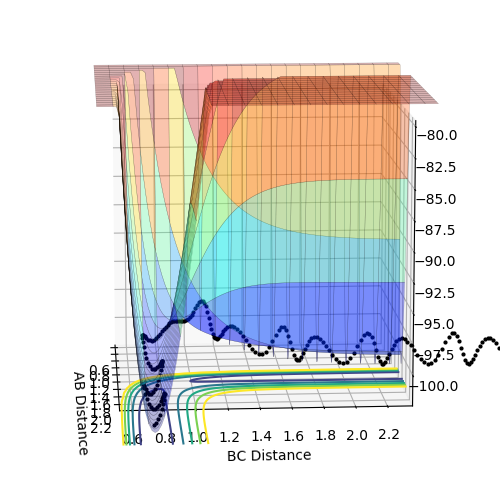
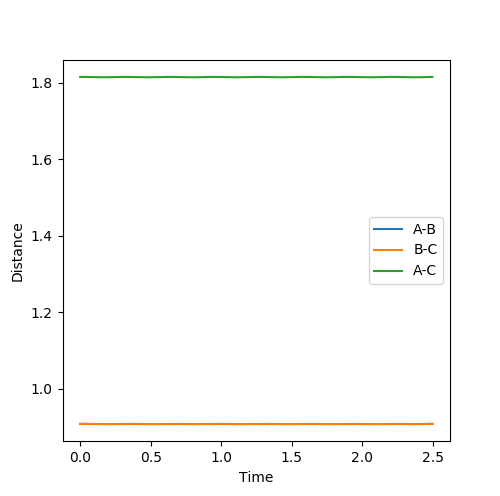
At transition state position, it is the maximum point of the reaction pathway (therefore will not turn into product) and the minimum point of the potential energy surface (no oscillation) which means it is the stationary point and therefore will not move or oscillate.3 particles should stay at rest without any oscillation. Becasue for this system, the transition state is symmetrical means rab=rbc at transition state, so from internuclear distance vs time plot , from the crossing point of rab rbc , an estimated value can be found. Then it is impr The best estimate of transition state found is when r AB=r BC=0.908 and p AB =p BC=0. By plotting internuclear distances against time it is found that the 3 particles are almost at rest without any oscillations because the graph shows two straight lines without any fluctuations.
Mm10114 (talk) 17:07, 7 June 2018 (BST) Good.
Comment on how the mep and the trajectory you just calculated differ. Initial conditions: rAB=0.918 rBC=0.908 pAB=pBC=0
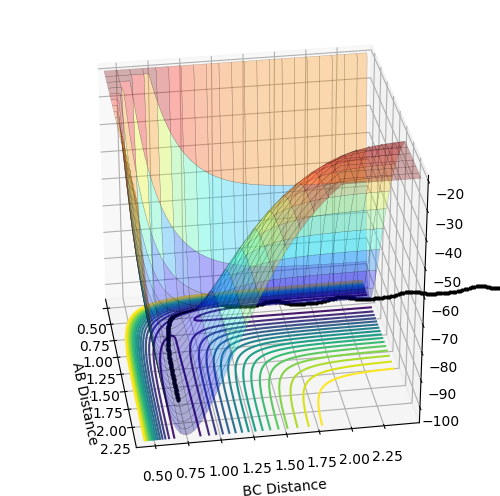
The trajectory calculated by MEP is shorter than Dynamics uisng the same number of steps is because for MEP the velocity and momentum is set to zero for each step therefore the motion is extremely slow compared to dynamics therefore can only move a short distance. However for Dynamics it is a continuous process and the momentum is accumulated and velocity is not reset to zero for each time point therefore can move a longer distance. The trajectory calculated by MEP is the path that has the minimum amount of potential energy which is a straight line on the floor of potential energy surface.For minimum potential energy, oscillation will not take place. For dynamics, it takes into account of atom mass and inertia of atoms and the velocity is not reset to zero for each time step therefore the atoms will oscillate in this case.
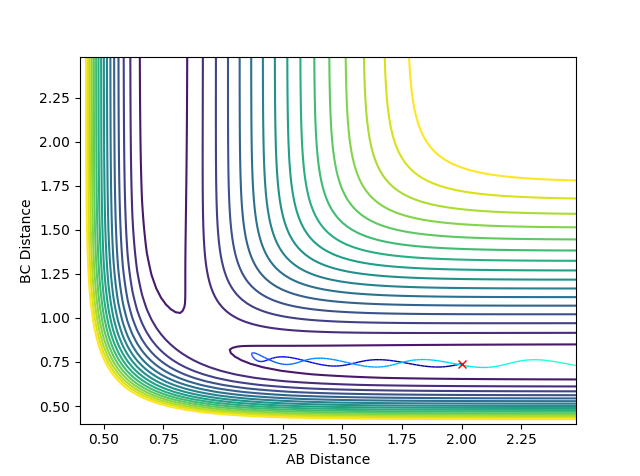
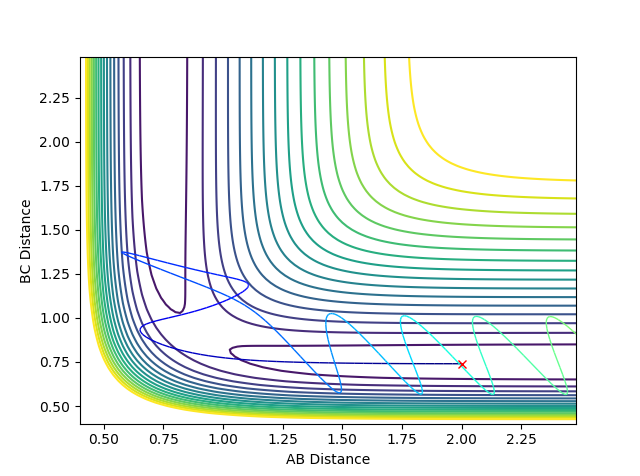
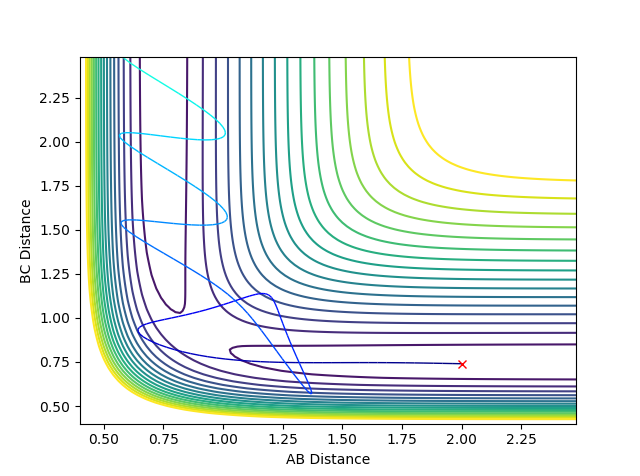
Complete the table by adding a column with the total energy, and another column reporting if the trajectory is reactive or unreactive. For each set of initial conditions, provide a plot of the trajectory and a small description for what happens along the trajectory.
| p1 | p2 | total energy kJ/mol | Reactive or unreactive | |
|---|---|---|---|---|
| 1 | -1.25 | -2.5 | -99.018 | reactive |
| 2 | -1.5 | -2.0 | -100.456 | unreactive |
| 3 | -1.5 | -2.5 | -98.956 | reactive |
| 4 | -2.5 | -5.0 | -84.956 | unreactive |
| 5 | -2.5 | -5.2 | -83.416 | reactive |
1 This is a reactive trajectory with the least extent of oscillation due to lowest momentum.
2 An unreactive trajectory with slightly bigger extent of oscillation compared to 1 due to bigger momentum. However it is unreactive because it doesn't cross the barrier
3 A reactive trajectory with same momentum of 2 . However in the reactant region the extent of oscillation is smaller than the product region it shows that translational energy is transferred into vibrational energy causing bigger oscillation in the product region.
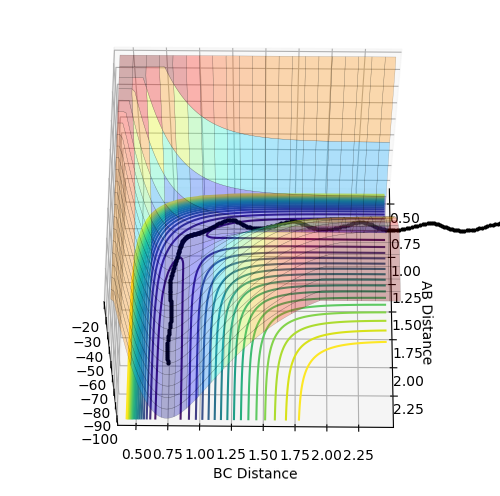
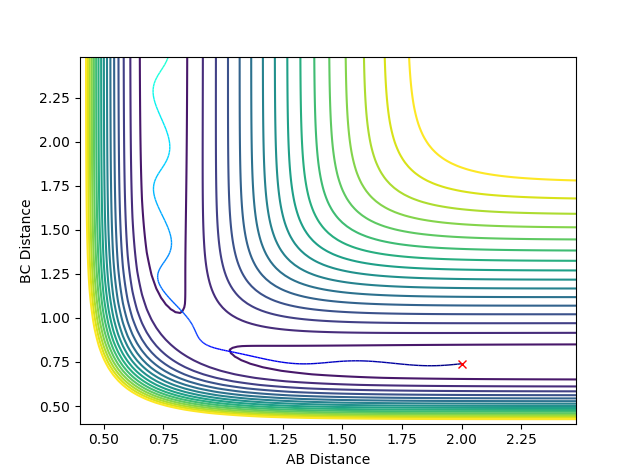
4 An unreactive trajectory with barrier recrossing. After passing the transition state the trajectory turn around return and cross it again. The oscillation in the reactant region is bigger than 1,2 and 3 due to bigger momentum.
5 A reactive trajectory with barrier recrossing. After passing the transition state the trajectory turn around and return to cross it again. The oscillation in product region is much bigger than reactant region due to translational energy being converted to vibrational energy.

 State what are the main assumptions of Transition State Theory. Given the results you have obtained, how will Transition State Theory predictions for reaction rate values compare with experimental values?
The main assumptions:
1 The reactant is in thermal equilibrium with the transition state.
2 Born-Oppenheimer approximation is used which separates the electronic motions and nuclear motions
3 The distribution of the reactant particles (molecules,atoms etc) among the reactant state follows Boltzmann distribution.
4 Motion along the reaction coordinate can be separated from the other degrees of freedom and treated by classical mechanics.
5 Once the system attains transition state and moving in the direction of the product, it'll not turn around and move back and reform the reactants. This is the so called ' quasi-equilibrium hypothesis'
6 The transition state that is turning into product follows the Boltzsmann distribution even if the reactant and product are not in equilibrium.
The rate values predicted by transition state theory are usually overestimated compared to experimental values. This is the result of assumption 5 where it states that once crossed transition state it will not turn around and come back and cross it again. However in reality this can happen and it is not accounted in transition state theory causing overestimation. Assumption 4 also causes deviation from the experimental values because particles are quantum mechanical objects but they are treated by classical mechanical in the theory.
Mm10114 (talk) 17:07, 7 June 2018 (BST) Overall good. But, where is the reference here? Without a reference for the source of the information this can be considered plagiarism.
exercise 2
Classify the F + H2 and H + HF reactions according to their energetics (endothermic or exothermic). How does this relate to the bond strength of the chemical species involved?
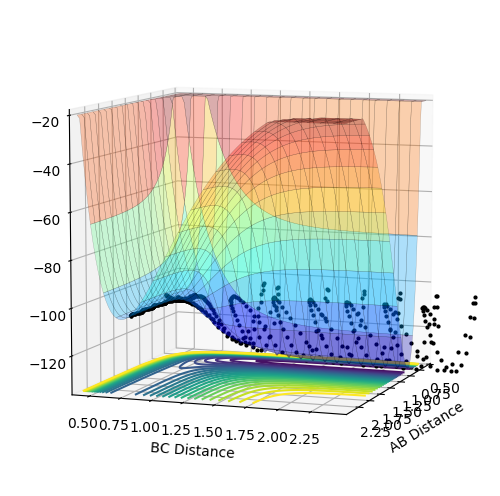
F+H2 : exothermic. The energy of reactants is higher than the energy of products therefore delta H is negative.This is determined by looking at surface plot. A=F B=H C=H. H2(BC) is the reactant and from the plot the energy of it is more positive (larger) than HF (AB). Enthalpy change of reaction is calculated by energy of product minus the energy of reactants which result in a negative energy indicating the reaction is endothermic.
H+HF: endothermic. The energy of products is higher than energy of reactants therefore delta H is positive. This is determined by looking at surface plot. A=H B=H C=F. HF(BC) is the reactant and from the plot the energy of it is more negative (smaller) than H2 (AB). Enthalpy change of reaction is calculated by energy of product minus the energy of reactants which result in a positive energy indicating the reaction is endothermic.
The bond strength of H-F is stronger than H-H therefore it needs to take more energy in order to break the H-F bond which makes the second one endothermic.
Locate the approximate position of the transition state.
Hammond postulate is used to locate the transition state. It states that for exothermic reaction we have an early transition state which means the transition state will resemble reactants and for endothermic reaction we have a late transition state which means the transition state resembles products.
So for the F+H2 , the transition state should resemble the reactant hydrogen and has a rBC similar to the bond length of hydrogen which is around 0.74 angstrom. Then several test on rBC is made in order to locate transition state, when rBC=1.812 the transition state is located.
It was found that for F+ H2 , rAB = 1.812 rBC = 0.743. For H + HF , rAB =0.743 rBC= 1.812
Report the activation energy for both reactions.
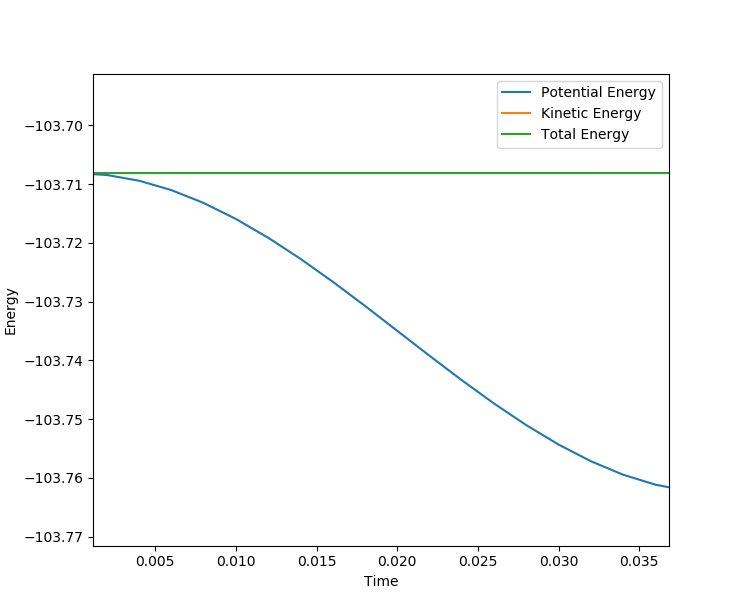
Using the transition state just found , by changing the initial condition to rAB = 1.822 rBC = 0.743 for F+ H2 a MEP is calculated for 200000 steps and using the energy vs time plot the activation energy can be found. However the values are only estimates because the graph does not show the exact value and the energy of reactants may be further decreasing but it is outside the step range. From the energy vs time plot, both the energy of reactants and transition state can be found. The energy of transition state is found when time = 0s and the energy of reactants are found when the time=1000s .
Then activation energy can be found by calculating the energy difference between transition state and reactants. From the surface plot for F and H2 it may not be obvious that reactants and transition state have different energy but by zooming in on the energy vs time plot there is a slight energy difference between reactants and transition state, the activation energy is very small.
For H + HF, activation energy is found in the method but setting initial condition to rAB = 0.743 rBC = 1.812
For F+H2 , Ea = 0.236 kJ/mol

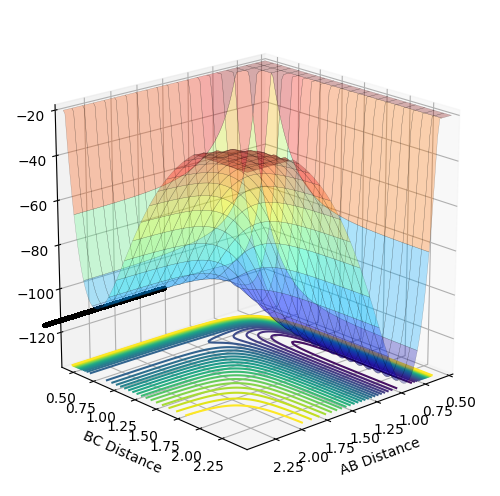 MEP calculated for F+H2
For H+HF, Ea = 30.2 kJ/mol
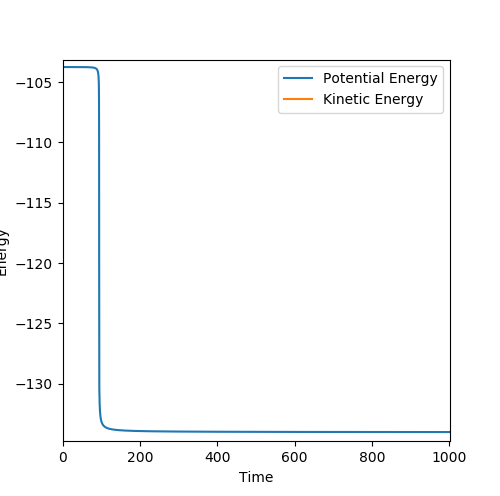
 MEP calculated for H+HF
In light of the fact that energy is conserved, discuss the mechanism of release of the reaction energy. How could this be confirmed experimentally?
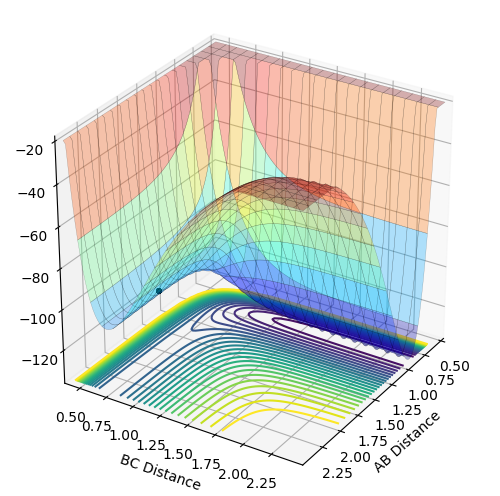
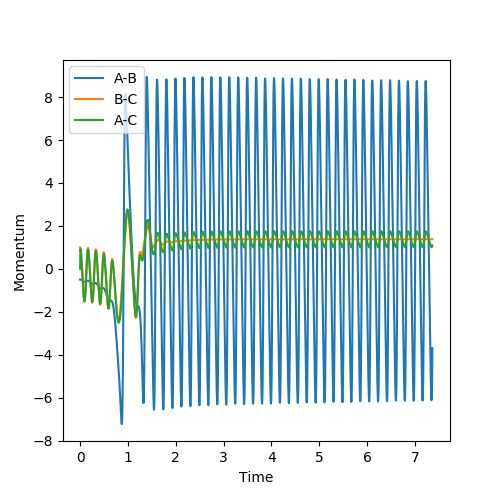
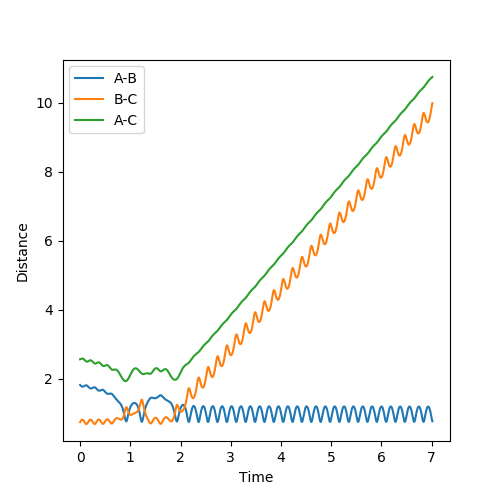
Energy is conserved which means total energy is contant but kinetic energy and potential energy is interchanging .There are three types of kinetic energy : translational, vibrational and rotational. From the graph below which shows internuclear momentum vs time, it is obvious that the oscillation of H-F (A=F, B=H)molecule increases to a bigger extent in the product stage. The surface plot also shows the extent of oscillation for the HF molecule is bigger. This indicates that potential energy which is the energy from the chemical bond is converted into vibrational energy. For the translational energy, this can be found by looking into the internuclear distanc vs time plot. The distance B and C increases steeply wihch means C is leaving C in a high velocity which is an increase in translational energy so some potential energy is also translated into translational energy However, in this system the increase in vibrational energy is more dominant and obvious.
This could be confirmed experimentally by temperature because temperature is a measure of the average kinetic energy of the particle. However this is not accurate because both vibrational and translational are kinetic energy so we won't which type of kinetic energy is increasing.
Mm10114 (talk) 17:07, 7 June 2018 (BST) What is the name of experiment where we measure the change in temperature?
A better way to do this is by using IR. For an increase in vibrational energy, the intensity of the overtone will be stronger. This is due to increase in the vibrational energy will lead to the increase in the population of the first excited state which means more population can be excited from the first excited state to the second excited state. This will lead to an increase an intensity of the overtone.
Mm10114 (talk) 17:07, 7 June 2018 (BST) Good.
Discuss how the distribution of energy between different modes (translation and vibration) affect the efficiency of the reaction, and how this is influenced by the position of the transition state.
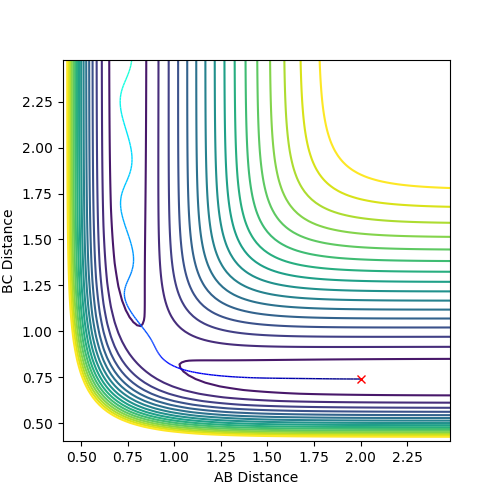
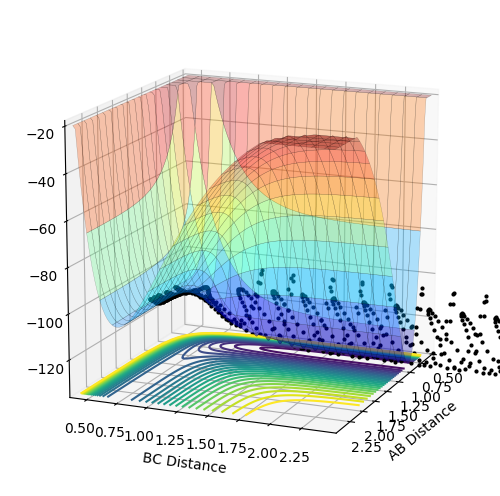
When setting the initial condition to rAB =2.643 rBC= 0.765 pAB =-1.27 pBC= 3.78 for H + HF , the trajectory is reactive.
Above is the contour plot for it, this is help to determine whether this endothermic reaction has late barrier or early barrier. Using the transition state value found above it was found the system has late barrier. According to Polayni's rule, for an endothermic reaction with late barrier vibrational energy is more effective in helping the system overcoming the barrier and be reactive. The contour plot and surface plot show that vibrational energy is bigger than the translation energy which corresponds to the rule stating that vibrational excitation helps to increase the efficiency of reaction
when setting the initial condition to rAB =2.643 rBC= 0.765 pAB =-1.29 pBC= 5 the trajectory is unreactive. From the graph above, it is obvious that vibrational energy for the trajectory is bigger than the reactive one from the degree of oscillation. This indicates that it is not always the case that bigger the vibrational energy will guarantee the reactivity of the late barrier endothermic reaction. The orientation and mode of vibration is very important as well when determining whether the reaction is going to be reactive or not.
Mm10114 (talk) 17:07, 7 June 2018 (BST) Very good conclusions.


