MRD:ssv15
H + H2 System
1. What value do the different components of the gradient of the potential energy surface have at a minimum and at a transition structure? Briefly explain how minima and transition structures can be distinguished using the curvature of the potential energy surface.
The gradient of the potential energy surface at a minimum and during a transition state is 0. A transition structure will be at a stationary point on the minimum energy pathway connecting the reactants and products. As the transition structure is a maxima in the potential energy surface, it therefore a saddle point in the graph. This point can be measured by taking a second order partial differential ∂2V(ri)/∂ri2 = 0, in order to calculate the curvature of the potential energy surface. If both results of the second order partial differential are positive values, it is a minima point, whereas if both results are of different signs, a saddle point is being observed.
Qualitatively, if an increase in energy is observed in any direction from the minimum point, the point is a minima. At a saddle point an increase in energy is observed in one direction and a decrease in energy in the orthogonal direction.
2. Report your best estimate of the transition state position (rts) and explain your reasoning illustrating it with a “Internuclear Distances vs Time” plot for a relevant trajectory.
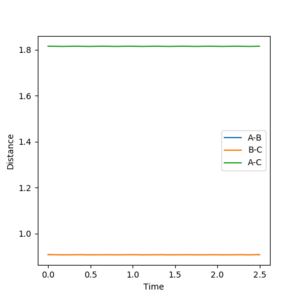
The internuclear distance of the hydrogen atoms at the transition state was best estimated to be 0.908Å. The distances r1 and r2 were both set to 0.908Å and the momentum set to 0 for AB and BC. At this distance the lines on the graph shown in Figure 1 have a constant gradient (not oscillating) indicating the atoms are not vibrating, and the potential energy would be at a maximum (a saddle point in the potential energy surface). The position of the transition state has been determined as the reaction is not tending towards the reactants or products.

3. Comment on how the mep and the trajectory you just calculated differ.
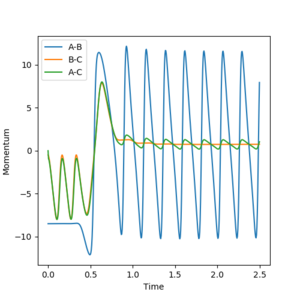
Figure 2a and Figure 2b below illustrate the trajectory pathway taken during two different calculations. The mep (minimum energy path) reaction occurs at a much slower rate than the dynamic calculation. In an mep calculation, the velocity of the atoms is reset after each cycle, therefore preventing the system from taking forward any built up momentum. Figure 2a shows smooth lines present, as the vibrating of the bond just formed is not illustrated, due to the removal of the velocity after each cycle. Figure 2b shows the dynamic pathway where the velocity of the atoms over the course of the reaction is measured and the velocity is carried on after each cycle. The velocity of the leaving hydrogen atom is faster and this is observed in sharper gradient of the A-B curve upwards. The curve representing the B-C hydrogen bond having just formed does oscillate in this system as the vibrating of the bond is measured.
The mep calculation gives a pathway along the minimum energy surface, however the dynamic calculation provides a more realistic system as the velocity does not in fact reset after each cycle, as presented in the mep calculation.


4. Complete the table by adding a column with the total energy, and another column reporting if the trajectory is reactive or unreactive. For each set of initial conditions, provide a plot of the trajectory and a small description for what happens along the trajectory.
| Trajectory | p1 | p2 | Reactivity | Total energy |
|---|---|---|---|---|
| 1 | -1.25 | -2.5 | reactive | |
| 2 | -1.5 | -2.0 | unreactive | -100.456 |
| 3 | -1.5 | -2.5 | reactive | -98.956 |
| 4 | -2.5 | -5.0 | unreactive | -84.956 |
| 5 | -2.5 | -5.2 | reactive | -83.416 |
Trajectory 1 is reactive as the incoming hydrogen A atom has enough momentum to overcome the activation energy in order to break the B-C bond and displace hydrogen atom C.

Trajectory 2 is unreactive as the incoming hydrogen atom A does not have enough momentum to knock off hydrogen atom C.

Trajectory 3 is reactive and the incoming hydrogen atom successfully displaces the attached hydrogen atom. A simple crossover is observed here of the A-B and B-C bond length as the energy is just high enough above the activation energy required for the B-C bond breakage.

Trajectory 4 is unreactive as a process known as barrier recrossing has occurred. The incoming hydrogen atom A had overcome the activation energy and had enough energy to displace hydrogen atom C upon collision, however atom C then rejoined the the B-C bond as the attraction towards hydrogen atom B was still strong enough. This is observed through the process of forming two transition states and finally the B-C bond remaining intact, and the reaction reforming the reactants.

. Trajectory 5 is reactive as the momentum of hydrogen atom A has been increased slightly, compared to trajectory 4, therefore upon barrier recrossing atom A is able to push atom C out and form the A-B bond.

5. State what are the main assumptions of Transition State Theory. Given the results you have obtained, how will Transition State Theory predictions for reaction rate values compare with experimental values?
Main assumptions of the Transition State Theory:
- A supermolecule (e.g. H3) will proceed to form the products if the transition state/ critical dividing surface has been reached. This passes through the saddle point of the potential energy surface.
- The boltzmann distribution of the energy of the reactant molecules remains constant throughout the reaction[1].
- The boltzmann distribution of a supermolecule (e.g. H3) that passes through the critical dividing surface, relates to the temperature of the system.
Due to the assumptions listed above, the transition state theory is predicted to obtain results of a higher reaction rate than results measured experimentally. The first assumption states that if the transition state is reached the reaction will go to completion and the products formed. However, it is observed experimentally in trajectory 4 that barrier recrossing is an exception to this rule and despite having reached the transition state, in the end the reactants were reformed. In trajectory 5, a slower rate of reaction is observed, due to the transition state reforming a second time, than would be predicted by the transition state theory. Therefore, we cannot entirely rely on the transition state theory for accurate results.
Ng611 (talk) 19:26, 15 May 2018 (BST) Good section! It might be worth adding a couple of lines of comment about the effect of tunneling. Is this accounted for in TS theory? If so, how significant is the effect, how will it vary from species to species?
F + H2 and H + HF system
6. Classify the F + H2 and H + HF reactions according to their energetics (endothermic or exothermic). How does this relate to the bond strength of the chemical species involved?
In this reaction atom A is fluorine and atoms B and C are hydrogens.
The forward reaction is F + H2 to H + HF. This reaction is exothermic as the from the potential energy surface it can be seen that F + H2 has a potential energy of -434.60 kJ/mol. The backwards reaction is therefore endothermic, which is proved as H + HF has a potential energy value of -559.10 kJ/mol[2]. The change in energy for the forward reaction is -124.5 kJ/mol, and the change in energy for the backward reaction is +124.5 kJ/mol proving the forward reaction is exothermic.
The energetics of this reaction are coherent with the bond strengths of HF and H2. According to literature values the energy of a HF bond is lower than that of a H2 bond as a HF bond is much stronger and therefore more stable and lower in energy. During the forward reaction the HF bond is made and energy is given out, an exothermic reaction, and in the backwards reaction, an input of energy is needed to break the strong HF bond, an endothermic reaction.

7. Locate the approximate position of the transition state.
The transition state F-H-H is located at r1 = F-H = 1.811Å and r2 = H-H = 0.745Å. Figure 5 shows that at these bond distances, the internuclear distance remains constant over time and does not oscillate.

8. Report the activation energy for both reactions.
The energy of the transition state was measured to be -432.2 kJ/mol. From this value and the energies of the HF and H2 molecule the activation energies were calculated.
The activation energy for the forward reaction, F + H2 to H + HF, was calculated to be 2.40 kJ/mol and the activation energy for the reverse reaction is 126.90 kJ/mol.
9. In light of the fact that energy is conserved, discuss the mechanism of release of the reaction energy. How could this be confirmed experimentally?
The A-B bond (H-F) is shown to be oscillating in Figure 7, as a result of it vibrating. The oscillation of the line A-B line of the graph is due to the potential energy being released, during the formation of HF, through the form of vibrational energy. This is because the reaction is exothermic so energy is given off, however total energy is conserved overall. This theory could be experimentally proved using calorimetry.

10. Discuss how the distribution of energy between different modes (translation and vibration) affect the efficiency of the reaction, and how this is influenced by the position of the transition state.
According to Polanyi's rules, translational energy more efficient at promoting reactions that have a later transition state, which resembles the products more than the reactants[3]. On the other hand vibrational energy is better at promoting reactions that have an earlier transition state, which resembles the reactants more than the products.
From the data given in Figure 4, the transition state of the forward reaction is early, therefore increasing the translational energy will result in a more efficient reaction. The opposite is true for the backward reaction, where the transition state resembles the products more and so is late. Therefore, an increase in vibrational energy will result in a more efficient reaction.
Ng611 (talk) 19:31, 15 May 2018 (BST) You needed to back this up with some trajectories. For example, some trajectories demonstrating increasing vibrational amplitude and its effect on the endothermic vs exothermic plots would have strengthened this section. Your explanation is good though!
Bibliography
- ↑ I. N. Levine, Physical chemistry, McGraw-Hill, New York ; London, 4th ed. edn., 1995.
- ↑ B. Darwent, Bond dissociation energies in simple molecules, Washington D.C.ː National Bureau of Standards, 1970, 28-3
- ↑ Z. Zhang, Y. Zhou, D. H. Zhang, G. Czakó and J. M. Bowman, The Journal of Physical Chemistry Letters, 2012, 3, 3416-3419
