MRD:sp2416
H + H2
Transition State
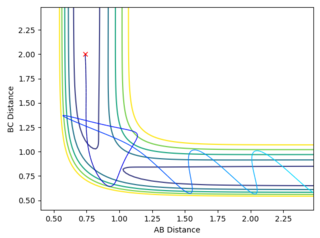
The transition state is defined at the maximum on the minimum energy path linking reactants and products. Both minima and transition states are saddle points on the potential energy surface. On the potential energy surface diagram of H + H2 analysed, the gradient of both the transition state and minimum are found to be zero (∂V(ri)/∂ri=0). Minima and transition structures can be distinguished by taking the second derivative of the gradient. For transition state this will be negative and positive, while for minima the answer to this will be positive.
Locating the Transition State

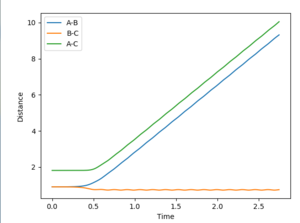
On the first graph the Transition state is where the A-B and B-C lines cross.
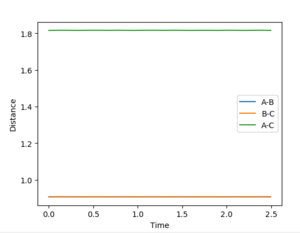
To locate the Transition state the momenta are changed to 0, (as a transition state is a saddle point) and then the distances AB and BC are adjusted so as to get an Internuclear Distance graph where both distances are stationary. This distance is found to be stationary when both AB and BC are set to be 0.90755.
Dynamic and MEP Calculation types
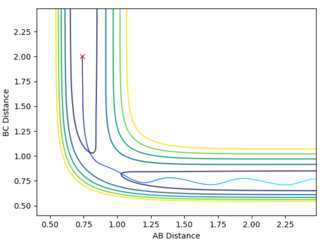
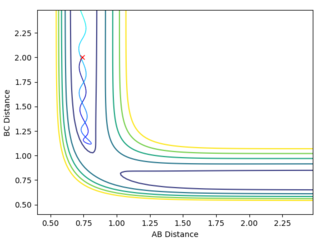
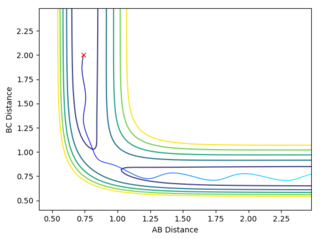
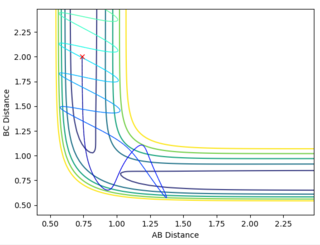
The following results were obtained when the AB distance was changed to 0.90855 and the BC distance was maintained at 0.09755 (transition state position)
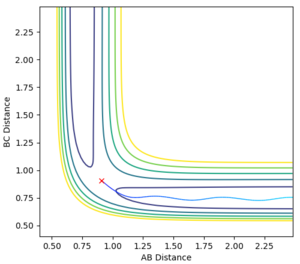
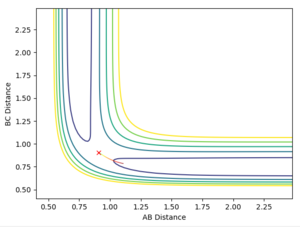
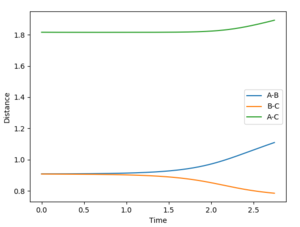
Jas213 (talk) 00:29, 29 May 2018 (BST) Nice plots, but where is your description on what this shows about Dynamic vs. MEP? What's the difference between the two? Also units are missing everywhere so far.
Reactive and Unreactive Trajectories
Jas213 (talk) 00:33, 29 May 2018 (BST) Initial conditions should have been stated in front of the table. In the penultimate case with BC has formed, you mean the TS was overcome but it recrossed back and reverted back to reactants. An overall concluding comment on what you learnt from this table would have been expected. It would have been nice if you had related your descriptions to the different proportions of momenta/ vibrational and translational energy used. In the last example you could have used a more precise language, I guess with "the reaction goes back to a BC molecule" you meant that it crosses the TS multiple times, but still ends up in the product channel, this can be misleading if you hadn't stated the Reactive in the other column.
Transition State Theory
Transition State theory separates reaction systems into the reactant-space and the product-space region. In the reactant-space the starting material has not reacted yet and the product-space region is entered after the reaction occurs. The border between these two systems is defined as the transition state. As soon as the transition state is overcomed and the products are produced, the reaction cannot be reveresed and the reactant-space cannot be entered again.
The theory assumes that the atoms obey the Born-Oppenheimer approximation and that quantum-tunneling effects do not occur. Also, the atoms of the starting material obey the Boltzmann Distribution and hence we assume that the system has enough time to equilibrate at the beginning.
However, upon consideration of the above calculations for the 4th reaction, it can be observed that the reactants are actually able to enter the product space and dissociate back to the starting material. Hence the theory cannot be applied here. The reason for this is because the calculations performed by the program are assuming isolation of the reactant system, while the theory takes the surrounding and the possible energy exchange with neighbouring molecules into account, in order to achieve equilibrium.
Jas213 (talk) 00:35, 29 May 2018 (BST) Where are your references for TST?
F - H - H
PES Inspection
The equilibrium reaction F + H2 ⇌ H + HF is exothermic when it goes forward releasing energy, whilst the backward reaction is endothermic, taking energy in. [1] The H-H bond is -432 kJ/mol and the H-F bond is -565 kj/mol [2]. This means that more energy is needed to break the H-F than the energy gained by forming the H-H bond, and hence the forward reaction is exothermic (and the backward endothermic).
Locating the Transition Stateː
Applying the following settingsː
Atom A: F
Atom B: H
Atom C: H
AB distance: 1.81 Å
BC distance: 0.7455 Å
Both momenta are set to 0.
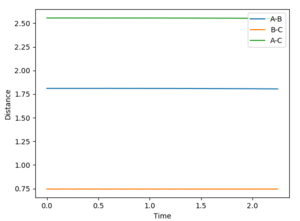
These settings were applied using the Dynamics Calculation type and visualising the Internuclear Distance vs Time plot. Trial and error values were used until all the distances (A-B, B-C and A-C) produce straight lines, as shown in the figure below.
Jas213 (talk) 00:36, 29 May 2018 (BST) Clear description of method.
Reporting the Activation Energyː
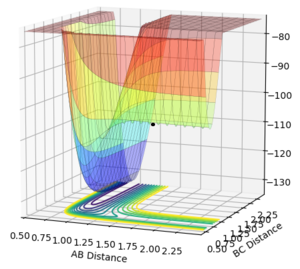
To find the activation energy, the type of calculation used is MEP and the AB distance is displaced slightly (form 1.81 is changed to 1.83) in order to force the reaction to go to either direction of the equilibrium - right hand side or left hand side.
The forward reaction in the equilibrium F + H2 ⇌ H + HF is exothermic. Hammond's postulate states that the transition state resembles more the reactants than the products in an exothermic reaction. Hence, the activation energy is obtained when the A-B distance is displaced in this calculation.
Energy of the transition state = -103.752 kcal/mol
Energy of products = -133.466 kcal/mol
Activation energy of the reaction = 29.714 cal/mol. Jas213 (talk) 00:37, 29 May 2018 (BST) kcal/mol...does this Ea make sense to you? What is the below plot good for? It only shows a dot and not an MEP trajectory, which would have been needed to determine the Ea. Where are your zoomed in E vs. time plots? You forgot to calculate the activation energy for the reverse reaction, going from the TS to the H2 and F. The respective plot is consequently missing as well.
Reaction Dynamics
Reactive Trajectory
Atom A : F
Atom B : H
Atom C : H
AB distance = 1.91 Å
BC distance = 0.7455 Å
AB momentum = -1.5
BC momentum = 1.0
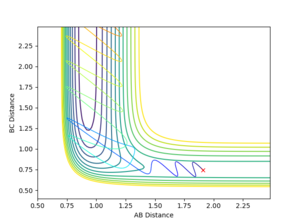
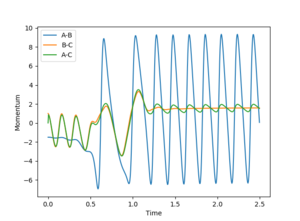
An increased and vigorous oscillation of the resulting molecule can be seen from the Momentum vs Time plot. This means that the energy released during this exothermic reaction is converted into vibrational energy.
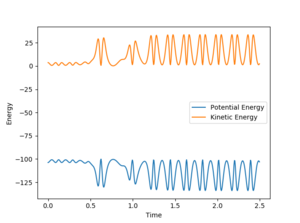
The Energy vs Time plot shows an increased oscillation in the kinetic energy of the molecule.
Investigating the effect of changing the momentum of AB
Atom A : F
Atom B : H
Atom C : H
AB distance = 1.91 Å
BC distance = 0.7455 Å
AB momentum = -3 to 3
BC momentum = -0.5
As soon as the AB momentum reaches 0, no more reaction can be observed. Increasing the value in the positive direction only results in a change of the oscillation strength of the A-B bond.
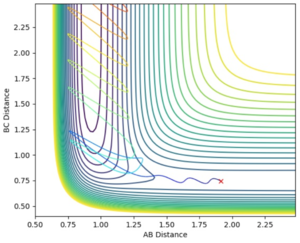
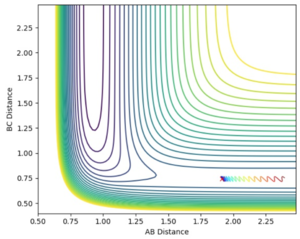

Jas213 (talk) 00:42, 29 May 2018 (BST) Note that the last two trajectories go into the complete wrong direction away from the TS region. Comment why one is reactive the others are not.
Polanyi's rules
The different motions (e.g. vibrational and rotational) on a reaction are discussed by Polanyi Rules.
As the forward reaction in F + H2 ⇌ H + HF is exothermic, the transition state resembles the reactants and occurs early, and therefore is promoted by translational motion. This motion is resembled by the momentum corresponding to the molecules which initially are further apart (in this case the AB momentum), as this momentum is responsible for the strength of the collision.
In the backward reaction which is endothermic, the transition state is late and is hence promoted by a high initial vibrational energy of the starting material. The momentum of the initially bonded molecule represents this energy.
Thus, it depends on the reaction monitored which momentum leads to a promotion of which reaction.
The reaction examined above corresponds to the endothermic one, which explains why an increase in the AB-momentum results in no reaction.
Jas213 (talk) 00:45, 29 May 2018 (BST) Where are your references for the Polanyi rules? The examined above is not the endothermic scenario, but the exothermic one (going from HH to HF) You should have discussed the other reaction with examples as well.
References
- ↑ J.C. Polanyi, D.C. Tardy, 1969, J. Chem. Phys., Vol.51 "Energy Distribution in the Exothermic Reaction F + H2 , and the Endothermic Reaction HF + H", p.255-321.
- ↑ http://www.wiredchemist.com/chemistry/data/bond_energies_lengths.html (Assessed on 15/05/2018 17ː10).

