MRD:solomona
H+H2 System
Gradients at Transition States and Minima
At minima and transition states (i.e. saddle points) the derivative of the potential energy will be zero; ∂V(ri)/∂ri = 0. We differentiate between transition states and minima by taking further derivatives. For minima the second derivative is positive, so ∂2V(ri)/∂ri2>0. A negative value (<0) will be given by maximum points. If the second derivative equates to 0, the point may be a minimum, maximum or saddle point, and further testing will be required for identification. We must calculate the second derivative test discriminant, D, given by:
If D > 0 and fr1r1 < 0 then we have a local minimum.
If D > 0 and fr1r1 > 0 then we have a local maximum.
If D < 0 then we have a saddle point.
For D=0, higher order tests must be used.
Good research. But I think you haven't quite hit the point. To confirm whether it is a saddle point, a local minimum or a local maximum in a three dimensional plot, you have to check from two different directions (components). For a saddle point, at one component it is maximum and it is a minimum at the other component. But for a local minimum or maximum, at both components, they are all min or max. For the second derivative test, not sure whether you actually understand this. So here is a video you can have a look. link. I have also drew the two components in a pringles. You can have a look too. 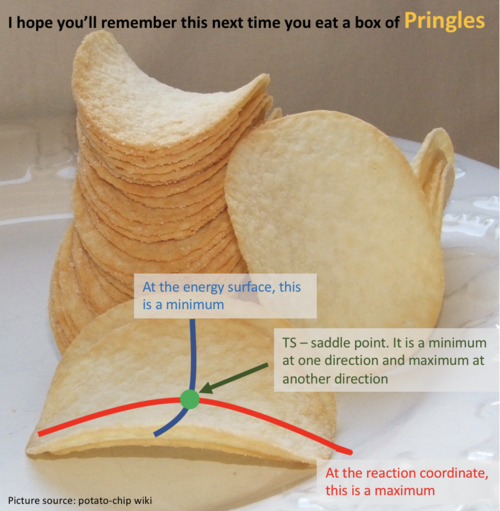 --Sw2711 (talk) 20:21, 18 May 2018 (BST)
Oh yeah. You also have to tell me. How's the TS/saddle point related to the energy surface. --Sw2711 (talk) 20:21, 18 May 2018 (BST)
Locating the Transition State from an “Internuclear Distances vs Time” plot
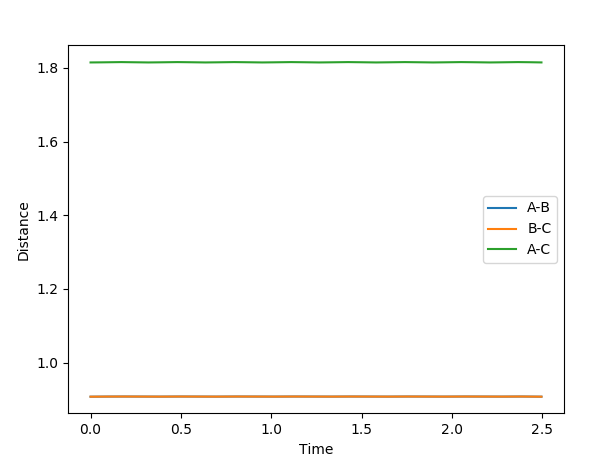
At the transition state, the three H atoms do not oscillate relative to each other. This fact can be used to locate the position of the transition state, as computation analysis will show constant values for rAB and rBC. Using simple trail and error with rAB = rBC and pAB = pBC=0, an estimated inter-atomic distance of 0.9075 Å was found for the transition state. A plot of internuclear distances against time can be found below, providing evidence that very little oscillation occurs at these values.
Good--Sw2711 (talk) 20:22, 18 May 2018 (BST)
A Comparison of MEP and Dynamics Calculations
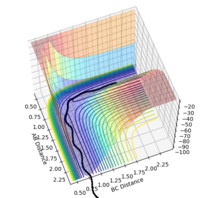
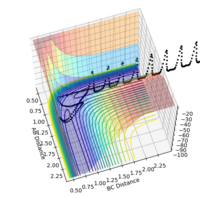
Using the values rAB = 0.9075 and rBC = 0.9175 with pAB = pBC=0, the behavior of the system as it moves away from the transition state was analysed with both mep (minimum reaction path) and dynamics calculations.
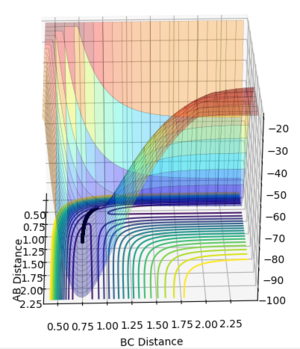
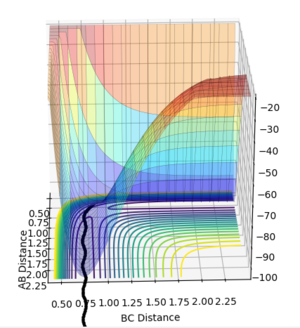
The minimum energy path (mep) follows the valley floor. At each time step in the calculation velocities are set to 0, so this trajectory corresponds to infinitely slow motion. While useful for characterizing reactions, it fails to provide an accurate account of the motion of atoms. The dynamics plot shows the oscillation of the H atoms.
Good--Sw2711 (talk) 20:23, 18 May 2018 (BST)
Reactive and Unreactive Trajectories
This part is good--Sw2711 (talk) 20:25, 18 May 2018 (BST) Analysis of changes in momentum as the system moves away from the transition state shows that the final momentum values are 0.8<pAB<1.5 pBC=-2.5. This shows that a system with -1.5<pAB<-0.8 and pBC=-2.5 will lead to reaction.
It seems fair to assume that any system with initial momenta higher than these would also lead to reaction. This claim was tested by investigating a range of momenta values, using initial positions rAB = 0.74 Å and rBC = 2.0 Å.
We find that the hypothesis proves false, as some simulations using momenta values higher than the predicted requirements (e.g. the system with pAB=-2.5 and pBC=-5) failed to react.
The Assumptions of Transition State Theory
The two most basic assumptions of transition state theory are:
- The separation of nuclear and electronic motion (known as the Born-Oppenheimer approximation in quantum mechanics)
- The assumption that molecules are distributed among their energy states in accordance to the Maxwell-Boltzmann distribution.
These assumptions are common to many other theories. Transition state theory also has three more assumptions, unique to it:
- Molecular systems that have crossed the transition state to form products cannot reform reactants
- In the transition state, motion along the reaction coordinate may be separated from other motions and be treated as a classical translation.
- Even in the absence of an equilibrium between products and reactants, systems at the transition state becoming products are distributed among their states following the Maxwell-Boltzmann laws.
It should be noted that the third assumption is not formally necessary, as it follows from the first. [1]
The results form the last two trials shown in the table above directly contradict the first assumption of Transition State Theory, as the system can clearly be seen crossing the transition state multiple times. In the cases tested, Transition State Theory proves to be an oversimplification.
Your observation to compare your experiments is good. Just one thing to be precise, I think the term ‘distribution’ is not very applicable here. ‘distribution’ is mainly used in statistical thermodynamics. But in terms of your system, there are only 3 atoms. So, it is either one way or the other.--Sw2711 (talk) 20:28, 18 May 2018 (BST)
F-H-H System
Reaction Energetics
The enthalpy of the H-H bond is ca. 432 kJ mol-1 , and for the H-F bond it is ca. 565 kJ mol1. Following from this, it can be seen that the F + H2 → HF + F reaction is exothermic, as the energy released by the formation of the H-F bond is greater than the energy required to break the H-H bond. Overall, ca. 133 kJ mol-1 can be expected to be released. Conversely, the opposite is true for the H + HF → H2 + F; ca 133 kJ mol-1 will be taken in by the system. [2].
Good, but I'd like some evidence--Sw2711 (talk) 20:28, 18 May 2018 (BST)
The Position of the Transition State
Good--Sw2711 (talk) 20:29, 18 May 2018 (BST)
Using the same method outlined above for the H-H-H system, the approximate position of the transition state was estimated. The following values were found:
F-H distance: ca. 1.8095 Å
H-H distance: ca. 0.7445 Å
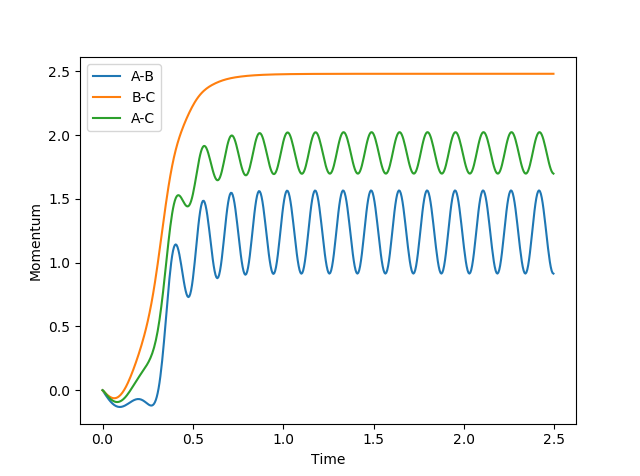
As before, the momentum time graph is shown bellow as evidence that the transition state was found.
Activation Energy
Good--Sw2711 (talk) 20:29, 18 May 2018 (BST)
Total energy at the transition state was compared to the total energy at each of the respective starting points. Literature values for the lengths of each bond informed the initial conditions of the starting points. The relevant total energy values are shown below:
| System | rAB /Å | rBC /Å | Total Energy /kcal mol-1 |
|---|---|---|---|
| F-H-H (Transition State) | 1.8095 | 0.7445 | -103.752 |
| F-H H | 0.91 | 100 | -133.955 |
| F H-H | 100 | 0.74 | -104.020 |
From these values, the following activation energy values were calculated:
H + HF → H2 + F
Activation Energy = 30.203 kcal/mol
F + H2 → HF + F
Activation Energy = 0.268 kcal/mol
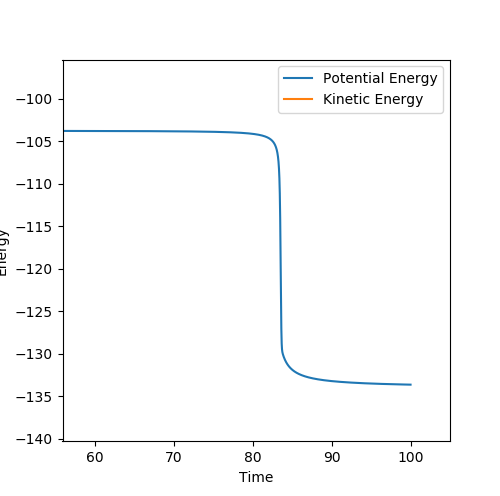
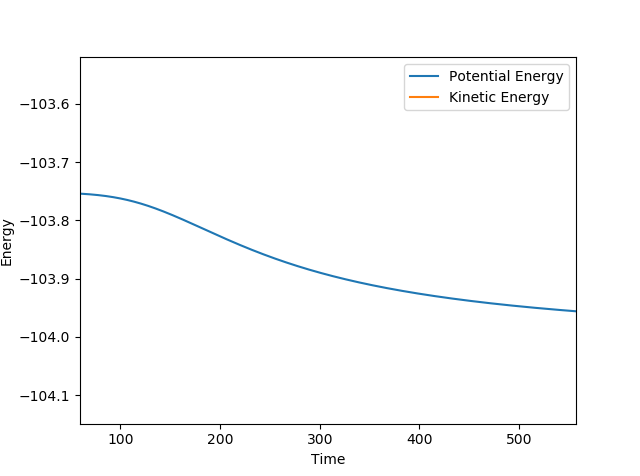
Analysis of an mep plot of energy over time was also used to calculate the activation energy of the reactions. Potential energy at appropriate starting positions (neighboring the transition state, slightly to the side of the desired starting materials) and the respective final positions were compared to find activation energy values.
H + HF → H2 + F
Starting conditions were rAB= 1.80 and rBC= 0.74 Å, no momentum.
Activation Energy = 30.26718247 kcal/mol
F + H2 → HF + F
Starting conditions were rAB= 1.8195 Å and rBC= 0.7545 Å, no momentum.
Activation Energy = 0.235073551 kcal/mol
The Mechanism of Reaction Energy Release
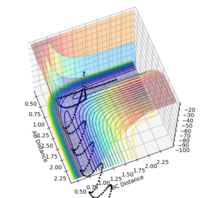
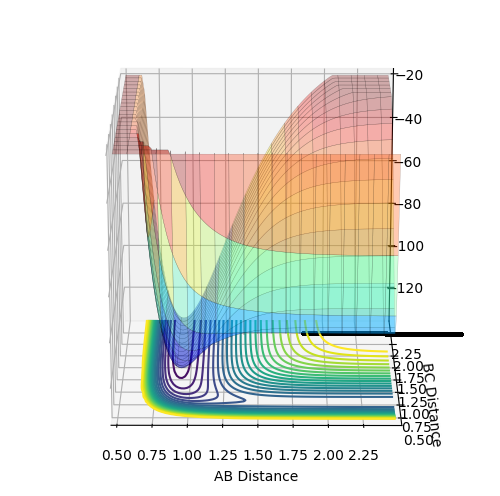
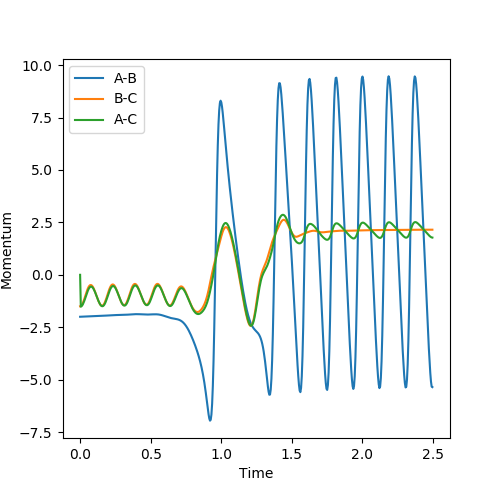
That's a very good and thorough understanding. --Sw2711 (talk) 20:44, 18 May 2018 (BST) Following a reaction, excess potential energy is converted into kinetic energy in the translational and vibrational modes of the product molecules. The specific distribution across these modes is dependent on the potential energy surface of the reaction. Surfaces with "late" or "repulsive" barriers, which occur in the exit channel where the products are separating, will have energy transferred predominantly into product translational modes, while "early" or "attractive" barriers (occurs in the entrance channel while reactants are approaching" will have generally favor vibrational excitement. The reasoning behind this can be seen if one considers the changes in bonding that occour during each respective type of barrier. Consider an A+BC system. For a late barrier the energy is released after the A-B bond has already formed and the B-C distance is changing; this motion corresponds to product separation so energy is transferred mainly into relative translation. An early barrier occurs while A-B is changing, so energy is transferred into this bond leading to vibrations [3]. . From Hammonds postulate (i.e. the transition state resembles the species nearest to it in energy) we known that the F + H2 reaction has an early transition state, and so the H-F product is highly vibrationally excited. This can be seen from the changes in momentum shown the figure below.
The distribution of energy across the modes may be measured by taking measurements of pressure and electromagnetic emissions. As all the species present are gaseous and the number of particles remains constant over the reaction, increases in transnational lead to more frequent and more energetic collisions of the gas with the container. Increases in translational energy lead to increases in pressure. Vibrational excitement will result in emission of infra-red radiation, following internal conversion upon the relaxation of excited molecules to their ground state. It must be noted that temperature cannot be used, as population of both modes lead to increased temperature.[4]
Alternative methods of examining the product's energy state distribution are also possible. Most notably one could examine the nature of any electromagnetic emissions, looking for Doppler broadening. Doppler broadened peaks arise from high translational excitation. As total energy is always conserved, narrow peaks (low translational excitation) implies high vibrational excitation.[5].
Distribution of Energy and the Efficiency of Reaction
Good--Sw2711 (talk) 20:45, 18 May 2018 (BST)
The location of energy barrier also plays a key role in the formation of products, as it controls which distribution of energy modes in the reactants is most likely to result in reaction. For a given transition state, the favored reactant energy distribution is the inverse of the favored product energy distribution. Vibrational energy is most effective for passage over late barriers - high translational energy may not lead to reaction even if provided in exccess of the barrier height. An excess of translational energy may simply lead to mollecules "coliding" with the replusive walls of the potential surface, and "rolling" back down into the reactant well. Conversely, an early barrier is best overcome by translational energy. Excess vibrational energy will lead to molecules oscillating from side to side yet never reaching the top of the barrier. These rules for understanding simple reaction dynamics are known as the Polanyi's rules. As F + H2 has an early transition state, high translatoinal energy is required for efficient reaction. The reverse is true for H + HF.
These predictions can be seen from the table below, which summaries several trails of the reaction F + H2. The positions in each case were rAB=2.3 Å and rBC=0.74 Å. It can be seen that few of the five trails succeed, in spite of having fairly high vibrational energy (pBC). The final trail has very little total momentum, but it has slightly more translational momentum (pAB) than any of the trails before it, so is successfull - as predicted by Polanyi's rules. [6].
| pAB | pBC | Does it react? | Trajectory Plot |
|---|---|---|---|
| -0.5 | -3.0 | NO | 
|
| -0.5 | -1.5 | NO | 
|
| -0.5 | 0.0 | NO | 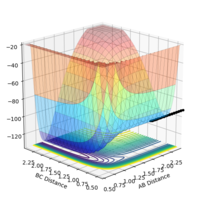
|
| -0.5 | 1.5 | YES | 
|
| -0.5 | 3.0 | NO | 
|
| -0.8 | 0.1 | YES | 
|
- ↑ 1 J. I. Steinfeld, J. S. Francisco and W. L. Hase, Chemical Kinetics and Dynamics, Prentice Hall, 1999.
- ↑ 1 P. Atkins and J. P. Paula, Atkins’ Physical Chemistry, Oxford University Press, Oxford, 10th edn., 2014.
- ↑ 2 R. D. Levine, Ed., in Molecular Reaction Dynamics, Cambridge University Press, Cambridge, 2005, pp. 148–200.
- ↑ 1 P. Atkins and J. P. Paula, Atkins’ Physical Chemistry, Oxford University Press, Oxford, 10th edn., 2014.
- ↑ 1 R. D. Levine, Ed., in Molecular Reaction Dynamics, Cambridge University Press, Cambridge, 2005, pp. 148–200.
- ↑ 1 R. D. Levine, Ed., in Molecular Reaction Dynamics, Cambridge University Press, Cambridge, 2005, pp. 148–200.

