MRD:sn518 mrd
This is a fantastic report! You completed each task with detail and care providing references where appropriate. The discussions provided demonstrate outstanding understanding! Well done, keep up the great work! Mys18 (talk) 11:32, 4 June 2020 (BST)
Molecular Reaction Dynamics: Applications to Triatomic Systems
H+H2 System
On a potential energy surface diagram, how is the transition state mathematically defined? How can the transition state be identified, and how can it be distinguished from a local minimum of the potential energy surface?
The transition state of a reaction is the energy maximum on passing from the reactants to products. It is not a real molecule, in the sense that it may correspond to partially formed or broken bonds around the central atom and thus it cannot be isolated. Mathematically, the transition state is a turning point as indicated by:
- where V is potential energy and r is the interatomic distance.

Reactive trajectory for an H + H2 type potential surface
and a maximum where the second derivative is negative:
On a potential energy surface (PES), the transition state is a first order saddle point, where in one direction in space, the energy is a maximum (second derivative is negative), whilst in the orthogonal direction, the energy is a minimum (second derivative is positive). [1] The saddle point is located between two local minima which correspond to the reactants and products. Thus, as the saddle point is an energy maximum on a minimum energy pathway, any change in its structure would result in the formation of a more stable arrangement. Also, the force acting on a given interatomic coordinate can be defined mathematically as it is dependent on the derivative of the potential energy surface:
To distinguish the transition state from a local minimum in a PES, the Hessian eigenvalues can be used. Hessian eigenvalues take the second derivative, ∂2V/∂r2, which can be projected along the eigenvectors. The saddle point, as previously mentioned, is a maximum enclosed by two minima on either side; thus one of the ω2 values would be positive and the other would be negative in sign. This differs from the eigenvalues for a local minimum, as a minimum would have two positive values. This can be explained using an analogy of a rolling ball. If a trajectory begins, where a ball starts exactly at the saddle point, with no initial momentum, then it would remain there permanently as there is no force acting on it. However, with a change in geometry, such as a slight change in momentum, if the ball was found close to the transition state, it would roll away from the maximum and towards the products or the reactants (minima) to find its minimum energy state and oscillate there. However, if the ball was found at a local minimum, the ball would remain at the minimum (oscillating there) as this is the most stable state.
Exemplary! Mys18 (talk) 10:44, 4 June 2020 (BST)
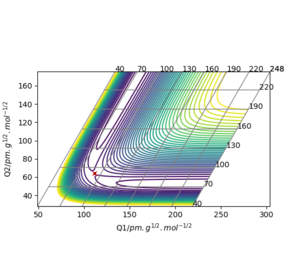
Report your best estimate of the transition state position (rts) and explain your reasoning illustrating it with a “Internuclear Distances vs Time” plot for a relevant trajectory.
 |
 |
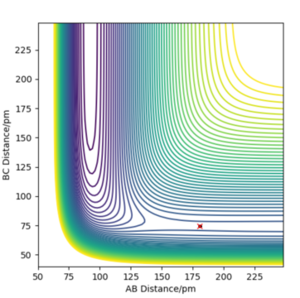
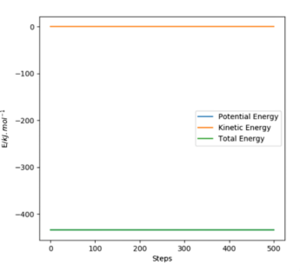
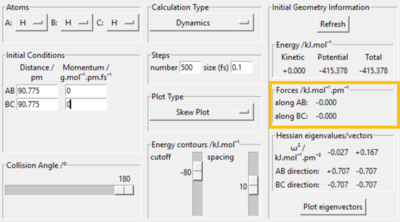
The H + H2 surface is symmetrical which implies that the transition state must occur where r1 = r2. At the r1 = r2 ridge, there is no gradient in the perpendicular direction and hence the trajectory will oscillate here and not fall off. Using this concept the transition state position was found at rts = 90.78 pm, where the gradient of potential energy = 0 and the forces along the bonds = 0 kJ.mol-1.pm-1. This position is further confirmed by the Internuclear Distances vs. Time plot which illustrates two flat lines, signifying that there is no oscillation at this geometry; thus this is the transition state of this reaction.
Perfect again! with the r1 r2 relationship, you could mention you know this from Hammond's postulate. Mys18 (talk) 10:46, 4 June 2020 (BST)
Comment on how the mep and the trajectory you just calculated differ.
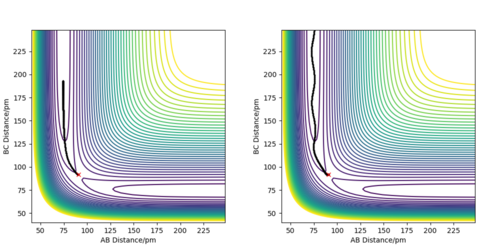
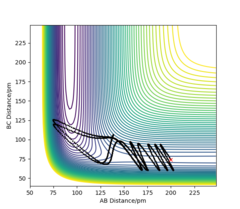
In both trajectories, the initial conditions utilized were identical; r1 = 91.78 pm, r2 = 90.78 and p1= p2 = 0 g.mol-1.pm.fs-1.The trajectory which corresponds to the minimum energy path calculated using the MEP calculation type shows very little oscillation. Although this diagram is useful in characterizing the reaction taking placing, it is not very accurate as it does not consider the mass of atoms and the fact that atomic motion is inertial in the gaseous phase. Whereas, the second trajectory calculated using the Dynamics calculation type is a more realistic illustration of atomic motion. The trajectory is slightly wavy which indicates an oscillatory motion of atoms, such as when the diatomic H2 molecule is vibrating.
Excellent. r2 units? So, what does the calculation do for MEP in terms of the momenta in comparison to dynamic that it resultantly doesn't take into account for vibrational energy? Mys18 (talk) 10:53, 4 June 2020 (BST)
Complete the table by adding the total energy, whether the trajectory is reactive or unreactive, and provide a plot of the trajectory and a small description for what happens along the trajectory. What can you conclude from the table?
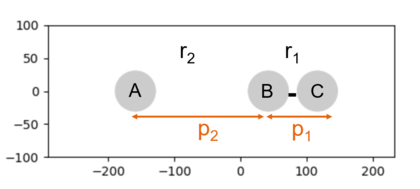
| p1/ g.mol-1.pm.fs-1 | p2/ g.mol-1.pm.fs-1 | Etot | Reactive? | Description of the dynamics | Illustration of the trajectory |
|---|---|---|---|---|---|
| -2.56 | -5.1 | -414.28 | Yes | At the start of the reaction, A is approaching B-C, and this molecule is oscillating as it has vibrational energy as shown by the wavy trajectory. After collision, as there is enough energy to overcome the activation barrier, the A-B molecule and C are formed. There is also some internal vibrational energy in the A-B molecule which causes oscillations in the trajectory. | 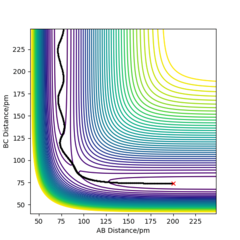
|
| -3.1 | -4.1 | -420.08 | No | Reactant B-C has vibrational energy and is oscillating as it approaches A. But this reaction does not proceed to form new products as there is not enough energy in the system to overcome the activation energy barrier. Species A approaches the molecule B-C but cannot form a bond with B and so is unable to react thus reforming the reactants at the end of the reaction. | 
|
| -3.1 | -5.1 | -413.98 | Yes | This reaction occurs smoothly starting from A + B-C and forming A-B +C. The wavy trajectory illustrates the vibrational energy in the B-C molecule as the atoms approach each other. Then there is sufficient energy in the reactants to overcome the activation barrier and thus the products are formed. The A-B product also has vibrational energy and thus shows oscillatory behaviour in the reaction trajectory. | 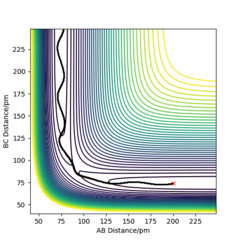
|
| -5.1 | -10.1 | -357.28 | No | This reactions illustrates the process of barrier recrossing, which involves the system crossing the saddle point, as indicated by the bond formation in the product, and then the reversal of the system to the initial reactants.[2] Thus, it can be said that the reaction has not proceeded to completion as no new product species are formed. So as there is sufficient energy in the system, this reaction suggests that energy is not the only factor affecting reactivity. | 
|
| -5.1 | -10.6 | -349.48 | Yes | Here, the reactants approach each other and collide in the transition region. At first, a new bond begins to form (A-B bond) but then the reaction starts to reverse to form the reactants again, before finally forming the product bond between A-B. This is an example of barrier recrossing but in a reactive trajectory as at the end, the products,A-B +C, are formed. | 
|
This table illustrates the effect of increasing momenta (greater kinetic energy) in a system. The initial hypothesis was that increasing momenta for trajectories with the same positions would increase the chance of reactivity as there would be enough kinetic energy to overcome the activation barrier. However, this table does not support this theory fully because even at trajectories with higher momenta, the reaction sometimes does not occur (i.e. p1 = -5.1 g.mol-1.pm.fs-1 and p2 = -10.1g.mol-1.pm.fs-1). This suggests that reactions are not dependent solely on the activation energy, but other factors must be considered such as the orientation of the reacting atoms and whether collisions are effective. Also, it indicates that not all energy contributes towards overcoming the activation barrier, but perhaps is used as translational or vibrational energy.
Good, higher momenta does seem to make the trajectories more complex! Mys18 (talk) 10:56, 4 June 2020 (BST)
Given the results you have obtained, how will Transition State Theory predictions for reaction rate values compare with experimental values?
A comparison of the results obtained with transition state theory illustrates that the theory is not accurate in all cases and this is due to the key assumptions this model makes. The first assumption made by the theory is that all trajectories which possess an energy greater than that of the activation barrier will take a reaction to completion and thus is reactive. In fact, it relies upon the assumption that once a reactant reaches the transition state, the transition state structure will not collapse back to reform the reactants, but rather will form the products and so would be a reactive trajectory. However, this assumption does not work for all cases as observed in the results of the table above. In some cases, even where the system had greater energy than the activation energy, the trajectory was unreactive as the reactivity may have depended on other factors (atomic orientation). Further to this extent, trajectories may cross the saddle point several times before eventually proceeding towards the product or reverse back to form the reactants (as in the case of the final row of the table above). As a consequence of this assumption, transition state theory overestimates the rate of reactions compared with experimental data. [3] Moreover, since transition state theory is a classical theory, it ignores quantum tunneling and treats the behaviour of atoms classically. Although quantum tunneling becomes less important for heavier atoms, it still should be taken into consideration.
Great job on your analysis and discussion! What are other assumptions in the TST (although may not directly relate to your findings)? Mys18 (talk) 10:58, 4 June 2020 (BST)
F - H - H System
By inspecting the potential energy surfaces, classify the F + H2 and H + HF reactions according to their energetics (endothermic or exothermic). How does this relate to the bond strength of the chemical species involved? Locate the approximate position of the transition state.

From the potential energy surface for F + H2, it can be seen that the reaction is exothermic as the reactants are in higher in energy (green region) compared with the products which are lower in energy (blue region). This implies that the higher energy reactants are more unstable and so move to transform into the products, where the system has a more enthalpically stable configuration relative to the reactants.
The TS is found at rF-H = 179.98 pm and rH-H = 74.75 pm, where the H-F bond is longer than the H-H bond and so, it can be said that this exothermic reaction has an early TS. Hence, using Hammond's postulate, the energy and structure of the transition state would resemble the reactants. This transition state position was confirmed by the Intermolecular Distances vs. Time plot, which showed two flat lines corresponding to the atoms not vibrating nor translating (moving towards each other). With respect to the bond strengths of the species involved, the H-F bond strength is greater than the bond strength of the H-H bond. So the energy released upon formation of the H-F bond is greater than the energy required to break the H-H bond and so explains the reason for which this reaction is exothermic.
 |
 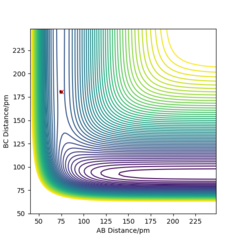 |
On the other hand, H + HF is an endothermic reaction as shown by the potential energy surface, in which the energies of the reactants are smaller than those of the products; so the reactants are in a more stable configuration than the products. Since the H-F bond in the reactant is stronger than the H-H bond formed (product), more energy is required to break the H-F bond than is released upon formation of the product H-H bond and so characterizes this reaction as endothermic. The transition state for this reaction is found at rF-H = 180.65 pm and rH-H = 74.95 pm. This also signifies that this H + HF reaction has a late TS because at the saddle point, the H-F bond is nearly fully broken and much longer than the H-H bond which is nearly fully formed. This late transition state means that the TS structure and its energy would resemble the products more than the reactants.
Perfectly and clearly explained with correct findings. You could support what you know quite obviously that the H-F bond strength > H-H using existing experimental values that are easily accessible in literature to further support, 'yes what I have found is correct'. Mys18 (talk) 11:03, 4 June 2020 (BST)
Report the activation energy for both reactions.
 |
 |
 |
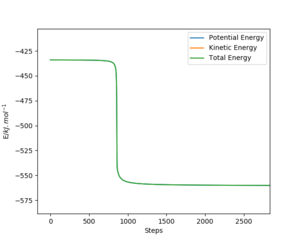 |
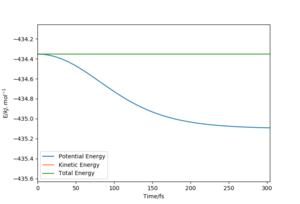
The activation energy for the reactions is the difference in the potential energy between the transition state and the reactants. This was found by using Hammond's postulate initially to find the TS (as mentioned earlier) and then by performing a mep calculation. For the F + H2 reaction, the TS structure resembles the reactants and for the H + HF reaction, the TS resembles the products. Therefore, by slightly altering the positions of the transition sate, the mep calculation would show the movement towards the reactants, from which the activation energy can be determined. From this, the activation energy for the exothermic F + H2 reaction was found as 0.234 kcal.mol-1 and for the endothermic H + HF reaction, the activation energy was found as 29.7 kcal.mol-1.
They look reasonable. I would opt with using kJmol-1 for reporting activation energies in the future. Mys18 (talk) 11:06, 4 June 2020 (BST)
Identify a set of initial conditions that results in a reactive trajectory for the F + H2, and look at the “Animation” and “Momenta vs Time”.In light of the fact that energy is conserved, discuss the mechanism of release of the reaction energy. Explain how this could be confirmed experimentally.
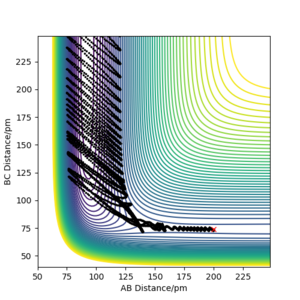
The initial conditions used to obtain a reactive trajectory for the F + H2 reaction was rF-H = 200 pm, rH-H = 74 pm and p1 = p2 = -1 g.mol-1.pm.fs-1.
 |
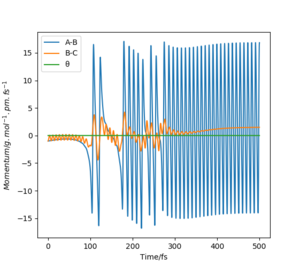 |
At this trajectory, initially, the H-H(B-C) bond is oscillating constantly due to possessing vibrational energy, and is approaching the F atom. After the molecule and atom collide, the H-H bond is broken and the new F-H (A-B) bond is formed as illustrated by the sudden increase in the momentum of the A-B bond. This F-H bond possesses a large amount of vibrational energy and thus accounts for the intense oscillatory movement seen in the Momenta vs. Time graph.
The overall reaction is exothermic and thus the early barrier means that translational energy is more efficient than vibrational energy, as stated by Polanyi's rule. As the overall energy must be conserved in this reaction system, the energy gained is also lost through internal vibrational relaxation to the environment, which is observed as a rise in temperature. The increase in temperature can be confirmed experimentally via various techniques. For instance, calorimetry can be used to confirm the release of energy using a bomb calorimeter; in exothermic reactions such as this one, the temperature would increase and in endothermic reactions, the temperature would decrease. Another method to verify the release of reaction energy is by using Fourier Transform Infrared (FTIR) spectroscopy to monitor the vibrational energy of the bonds.
Nice, you could look up 'chemiluminescence' which may be useful in monitoring the emission of infrared radiation from the sample. Mys18 (talk) 11:09, 4 June 2020 (BST)
Discuss how the distribution of energy between different modes (translation and vibration) affect the efficiency of the reaction, and how this is influenced by the position of the transition state.
The initial conditions used for the F + H2 reaction was rF-H = 198 pm, rH-H = 74 pm and pF-H = -1 g.mol-1.pm.fs-1.
The table illustrates that apart from the trajectory with pH-H = -1.1 g.mol-1.pm.fs-1 and pH-H = 1.1 g.mol-1.pm.fs-1 , all other trajectories are unreactive and instead what is observed is that the reactants are reformed. In these calculations, a significant amount of energy (greater than the activation energy) was inputted on the H-H bond. These results suggest that maybe when 1.1 < pH-H < 1.1 g.mol-1.pm.fs-1 , the trajectories are reactive (this is explored below). According to Polanyi's rules, the success of a trajectory can be determined as it is dependent on the momentum of the approaching molecule, in this case the hydrogen molecule. A low value of momentum would enable a lower activation energy, which signifies that less energy is required to cross the saddle point and for the trajectory to be reactive. However, in cases where the vibrational energy of the product (HF) is too large and the H atom is in close proximity, the new product bond formed can break and result in the reformation of the H-H (reactant) bond.
The basis for Polanyi's empirical rules lie in the energetics of a reaction, that is to say whether the reaction is classified as endothermic or exothermic. For exothermic reactions which have early TS barriers, the translational energy is more significant than the vibrational energy. Whereas for an endothermic reaction with a late barrier, vibrational energy is more efficient than translational energy since it requires a significant change in distance for the reactant structure to reach the transition state.[4]
This concept can be used in the reaction for F + H2 as the translational energy of the approaching hydrogen molecule is more important than its vibrational energy. So this means that energy which is put into the bonds does not only correspond to vibrational energy but also includes translational energy.

For the same initial positions, the momentum was altered so that pF-H = -1.6 g.mol-1.pm.fs-1 and pH-H = 0.2 g.mol-1.pm.fs-1.In this reaction, where the overall energy of the system has been considerably reduced, the trajectory is reactive. This is an illustration of barrier recrossing in which the products are fully formed after the crossing of the transition state. This perhaps suggests that trajectories can be reactive even with low values of momenta, as long as the energies (translational and vibrational) are distributed appropriately.

For the endothermic H + HF reaction, an extreme case was tested where rF-H = 200 pm, rH-H = 91 pm pF-H = -1 g.mol-1.pm.fs-1 and pH-H = -18 g.mol-1.pm.fs-1. In this trajectory, the incoming hydrogen atom was given a substantially large amount of momentum to break the strong H-F bond. Unlike the other reaction, as this is endothermic, the transition state is found far away from the starting reactants and so this large momentum for the hydrogen allows the large activation barrier to be surpassed. Nevertheless, it is worth noting that the if the initial vibrational energy of the H-F bond was too high, the momentum of the hydrogen atom may not have been sufficient to break the H-F bond.
Very well discussed inclusive of your methodology! You demonstrate great understanding of Polyani's rules, and the entirety of the report to be fair. Excellent to see you have included references and that too a variation in your references. Mys18 (talk) 11:30, 4 June 2020 (BST)
References
- ↑ G. M. Fernandez, J. A. Sordo, and T. L. Sordo. Analysis of potential energy surfaces. Journal of Chemical Education 1988 65 (8), 665.
- ↑ Atkins' Physical Chemistry, P. W. Atkins and J. De Paula 9th Edition, Oxford University Press pp 703-707.
- ↑ .L. Bao and D. G. Truhlar. Variational transition state theory: theoretical framework and recent developments. Chem. Soc. Rev., 2017, 46 , 7548 —7596.
- ↑ Jiang, B. & Guo, H. Relative efficacy of vibrational vs. translational excitation in promoting atom-diatom reactivity: Rigorous examination of Polanyi’s rules and proposition of sudden vector projection (SVP) model. J. Chem. Phys. 138, 234104 (2013).

