MRD:sm6416
H2 + H Exercise 1
Transition State Dynamics
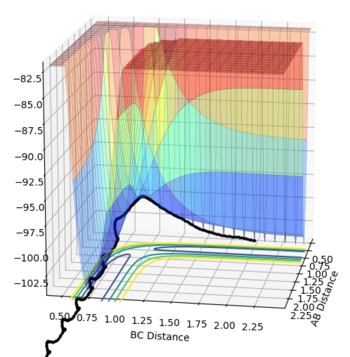
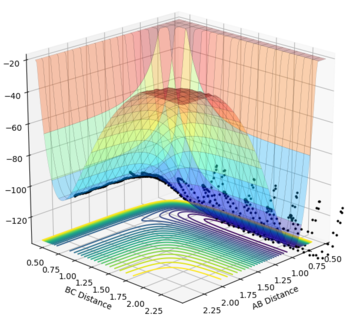
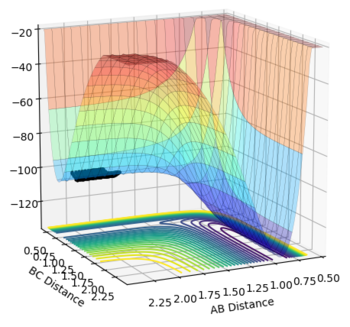
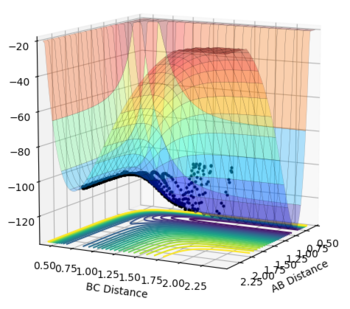
The transition state is the stage in a reaction coordinate that must be passed through in order for a reaction to occur and occurs at a saddle point, as shown by the numerous surface plots on this page. The first derivative highlights the positions along the reaction coordinate where the gradient equals zero. However, in order to determine if a saddle point ensues, the second derivative of the gradient must be taken. A saddle point is only present if the second derivative > 0.
This part is not true. Firstly, you need to check from two directions to determine whether a point is a saddle point. Secondly, saddle point is a minimum from one direction and a maximum from another direction. Please check the Pringles in the figure. 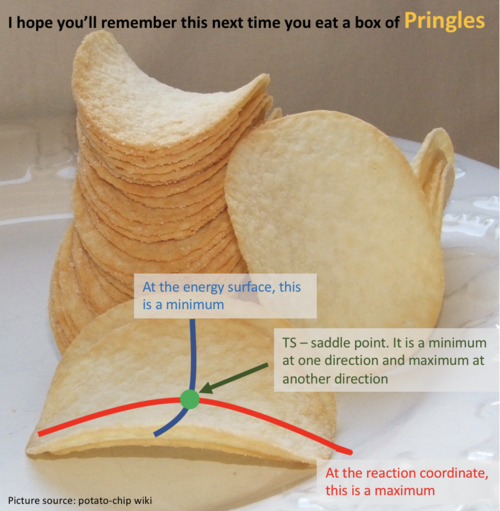 Finally, second derivative > 0 with first derivative = 0 doesn't give you a saddle point. But what does it give you? I think you implied a maximum. But is it true?--Sw2711 (talk) 16:10, 31 May 2018 (BST)
Another way to think of the transition state is by thinking of the tangent that can be formed at the transition state itself. This tangent will follow the reaction coordinate profile and therefore is expected to be a maximum, where the gradient = 0. A line can be drawn to the normal of the tangent at the selected transition state. This path would show a minimum, where the gradient again = 0, at the intersection of the tangent with normal if the transition state has been correctly identified. It is only in this scenario that a transition state can be determined as one. This part. I think you are sort of describing a saddle point, But somehow, you are thinking it is the only scenario. Here, I'd like to reassure you that a TS point is a saddle point. It is always true. A saddle point is a minimum at one component and a maximum at another component. This is from its mathematical definition. So this is always true as well. In molecular reaction, it is always a maximum along the reaction coordinate and a minimum along the potential well (i.e. the moorse potential). But the diagonal of AB/BC doesn't always pass the maximum or minimum of either component. It is at this case, because the product H+HH is the same as the reactant HH+H in the system. So it is symmetrical. --Sw2711 (talk) 16:10, 31 May 2018 (BST)
Please also watch this video to understand how you can determine a saddle point. link--Sw2711 (talk) 16:10, 31 May 2018 (BST)
Locating the Transition State
Good--Sw2711 (talk) 16:13, 31 May 2018 (BST)
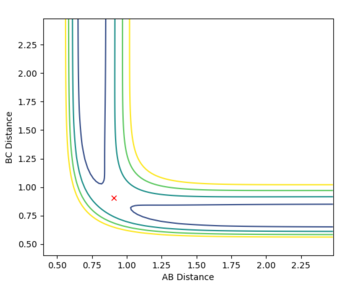
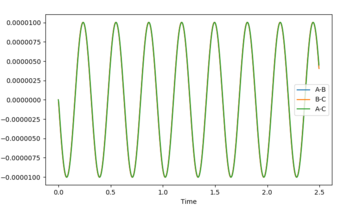
The transition state was determined through iterations of both r1 and r2 which resulted in the smallest displacement of momenta along with no displacement as shown by the contour plot. This method determined at rts = 0.907743.

Reaction Path
The minimum energy path (MEP) is defined as the lowest path the reaction must follow to form the products and is the downhill motion from the transition state. It can be applied in both directions in the case in question. The MEP views the system as static as it resets the velocity to zero at each step. Whereas the trajectory is very much dynamic and the momenta is accounted for, this is reflected in the vibrational oscillation of the molecule as it passes along the minimum well towards the products.
I am not sure whether MEP always follow the lowest path to for the Products. Try the very first example in this lab. Compare the MEP and dynamics. Otherwise it is good--Sw2711 (talk) 16:21, 31 May 2018 (BST)
MEP
Initial conditions of r1 = rts + 0.01 = 0.917743, r2 = rts = 0.907743 and p1 = p2 = 0 for the MEP simulation.


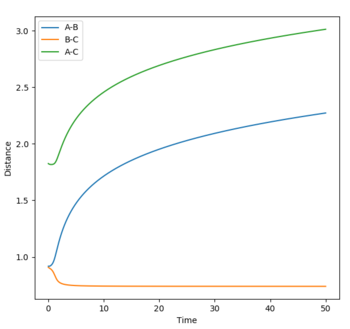
Final values from the MEP simulation.
r1 = 2.76195
r2 = 0.75883
These values reflect the minimum trajectory for a successful reaction.
p1 = p2 = 0
Dynamic
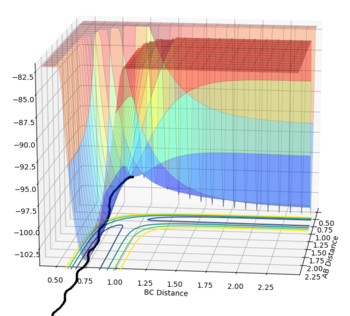


Dynamic simulation final values
r1 = 10.0045
r2 = 0.75883
p1 = 2.48523
p2 = 1.29898
p(average) = 1.90409
With r1 = rts and r2 = rts + 0.01 would simply produce the same answer however the values would be flipped to the other distance. In other words r1 = 0.75883 and r2 = 10.0045 would be the output values.
Maintaining the final trajectories as calculated from the dynamic simulation and reversing the sign of the momenta, the reaction proceeds in the reverse direction to the products.
Reactivity of Trajectories
These simulations are restricted by the number of steps the program can handle, however a sound understanding of the reaction can be appreciated and the reactivity of each scenario can be determined appropriately.
Transition State Theory
Transition State Theory (TST) assumes a quasi-equilibrium between reactants and the transition state. The reaction between the transition state and products is irreversible and therefore is unable to return to the reactants, however many of the surface plots on this page show the complete antithesis of this highlighting a dichotomy between theory and experimental. TST further assumes that fluctuation as to whether the transition complexes go towards reactants or products are independent of each other and hence the rate of one can not be determined by the other.
TST is an excellent qualitative tool and can identify the enthalpy, standard entropy and standard Gibbs energy of activation. Despite this, it the method is unable to accurately determine these true values in line with experimental results as doing so would require a deep understanding of the potential energy surface of each reaction. Therefore, TST under estimates the reaction rate in comparison to the experimental values. When TST was developed in 1935 a lack of adequate computer software to accurately map potential energy surfaces with the relative quantum mechanical contributions to determine the distribution of electron density, unlike there is today. Hence resulting in a less accurate and longer method to map these surfaces for each reaction.
Overall good. Just one minor point: I think the term ‘equilibrium’ is not very applicable here. ‘equilibrium’ is mainly used in statistical thermodynamics. So like…thinking about a reaction A+B<=>C. Statistically speaking there is 80% molecules in this system reacts from the left to the right and 20% the other way around. (about obviously you should think about more like a Boltzmann distribution ). This reaction has reached an equilibrium. But in terms of your system, there are only 3 atoms. So, it is either one way or the other. --Sw2711 (talk) 16:23, 31 May 2018 (BST)
F-H-H System Exercise 2
Potential Energy Surface Inspection
Energetics
F + H2 is an exothermic reaction as can be seen from the surface plot, the reaction progresses from a small H-H distance to a longer one, whilst H-F simultaneously equilibriates about the F-H bond length. It can be seen that the products are lower, and hence more stable, in energy than the reactants.
F-H + H is simply the reverse reaction that passes through the same transition state, hence this reaction is endothermic with the products being higher in energy than the reactants. There is an overall gain of energy.
With this information in mind, the F-H bond is more stable and thus stronger than the H-H bond. The main factors to this argument is the greater electronegativity of F leading to a stronger contribution to the bond than the molecular orbitals. Hence the overlap of molecular orbitals is a weaker factor in the bond strength.
This part is good--Sw2711 (talk) 16:24, 31 May 2018 (BST)

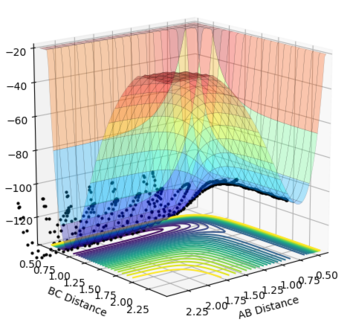
Transition State
Good--Sw2711 (talk) 16:25, 31 May 2018 (BST)
Hammond's postulate aids in finding the transition state; it relates the composition of the transition complex to either the reactants or products for an early or late transition state respectively. In the scenario under investigation for F + H2 an early transition state is present as the reaction is exothermic in this direction, hence the transition state resembles the reactants more.
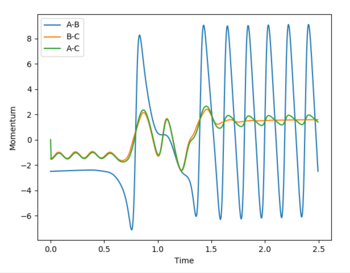
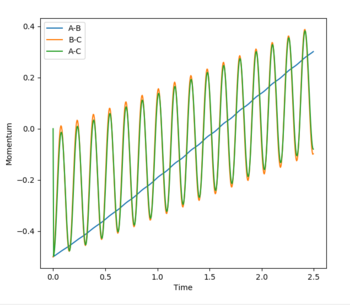
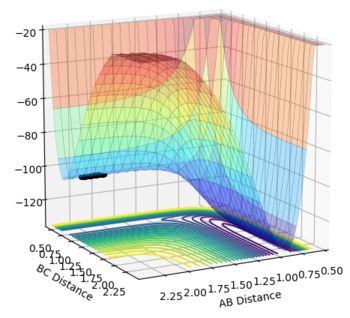
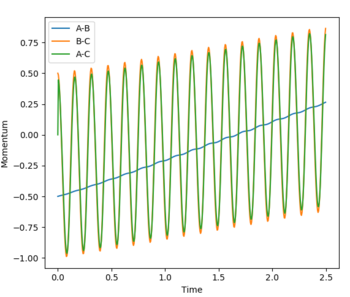
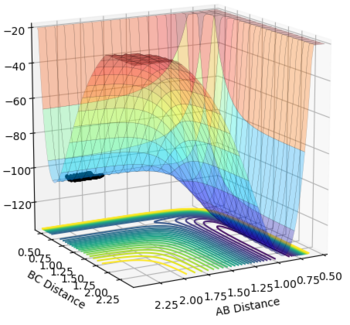
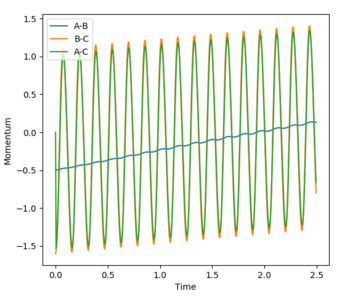
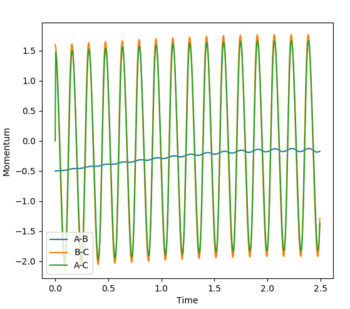
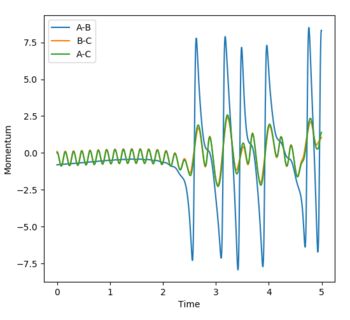
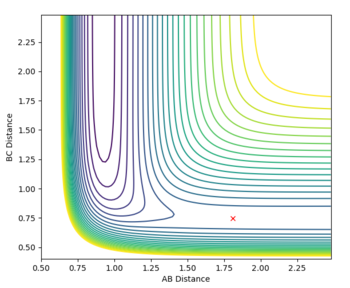
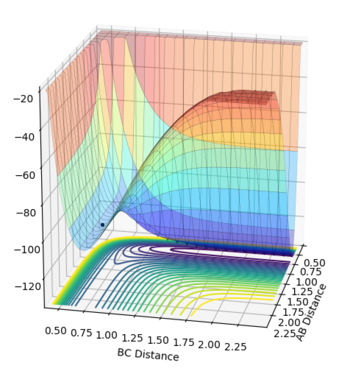
This guidance proved useful in determining the transition state complex at r1 = F-H = 1.810076 Angstrom and r2 = H-H = 0.74634 Angstrom, as can be seen from the surface and contour plots below showing the absence of displacement to either reactants or products. Furthermore the Momenta vs Time plot indicates a very small momenta of the overall system, without any deviation or substantial change in the momenta.

Activation Energy
Good--Sw2711 (talk) 16:25, 31 May 2018 (BST)
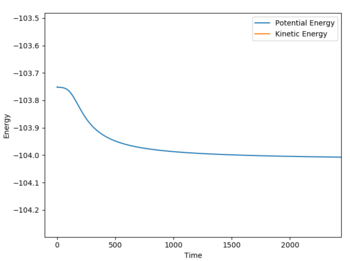
The activation energy for the exothermic reaction was calculated through a 500000 step MEP simulation with input values of r1 = 1.820076, r2 = 0.74634 and p1 = p2 = 0. It was required that after following the minimum energy path, the gradient of the line signifying the reactants was constant.
The activation energy is reported at +0.258 kcal/mol for the exothermic process.
The activation energy for the endothermic process was determined with the following parameters: r1 = 1.800076, r2 = 0.74634, p1 = p2 = 0 with 250000 steps. These parameters 'tipped' the reaction towards the FH + H reactants. The reported activation energy was +30.277 kcal/mol.
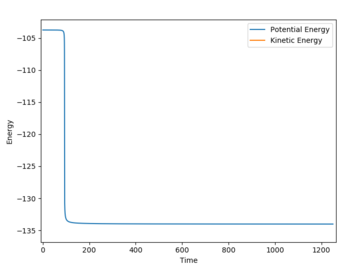
It can hence be seen that the exothermic reaction of F + H2 --> F-H + H only requires a small activation energy as the products are substantially more thermodynamically stable than the reactants.
Reaction Dynamics
In this exothermic reaction, the potential energy is mainly converted into vibrational energy of the FH bond, along with heat. As a result of this vibrational energy in the FH bond, vibrational levels above the ground state will become partially populated. In this manner, by recording an IR spectrum of the products, the main F-H will be observed alongside an overtone, with the intensity of this overtone relating to the population of this vibrationally excited state, which can then be used to determine the vibrational energy in the bond itself.
In this same vein, IR chemiluminescence can be employed to yield the same result by measuring the wavelength, and subsequent vibrational energy of the FH bond, of the infrared light that is irradiated from the products and being excited with incident light.
Calorimetry is not a suitable method to measure the vibrational energy of the bond, as this method merely takes an average of both translational and vibrational energies present in the system.
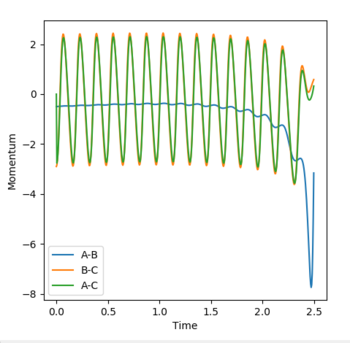
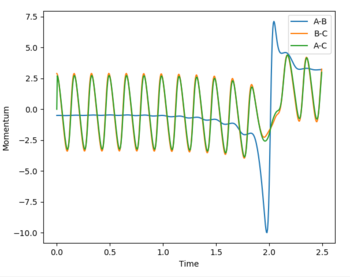
As the momentum closes towards the boundaries of -3 < p < +3, the system passes through transition state but returns to reactant well. This shows that the excess momentum of the system in the product well is sufficient to overcome the high activation energy and return to the thermodynamically unfavourable reactants.
This part is good--Sw2711 (talk) 16:28, 31 May 2018 (BST)
The following parameters were employed for all simulations rFH = 2.3, rHH = 0.74 with 500 steps calculated.
Polyani's Empirical Rules
The reactive trajectory for the FH + H was determined with the following parameters: rFH = 0.9, rHH = 2.3, pFH = 6.5, pHH = -1.5. The plots below highlight that these parameters lead to a reactive trajectory.


In order to react, a system must overcome the activation energy, the energy to achieve this is supplied by either translational or vibrational energy. As reported by Polanyi's Empirical Rules, a late transition state, one that resembles the products more as stated through Hammond's Postulate, is achieved through a greater contribution from vibrational energy enabling the activation energy to be overcome. The opposite is true for an early transition state which is promoted by a greater contribution from translational energy.
The F + H2 system is exothermic, thus an early transition state is present. Therefore this is promoted with higher translational energy being able to overcome the activation energy, hence pFH would contribute to the translational energy whereas pHH relates to the vibrational energy of the HH bond.
On the other hand, the FH + H system is endothermic and relates to a late transition state as dictated by Hammond's Postulate, requiring high vibrational energy of the FH bond to overcome the activation energy. In this scenario, pFH refers to the vibrational energy and pHH the translational energy.


