MRD:sjl1218
Good report showing understanding of the task at hand. I have written some comments which is hopefully beneficial. I would advise adding references to your answers.Mys18 (talk) 03:09, 23 May 2020 (BST)
Exercise 1: HA + HB-HC -> HA-HB + HC
Dynamics of the Transition State Region
The Transition State
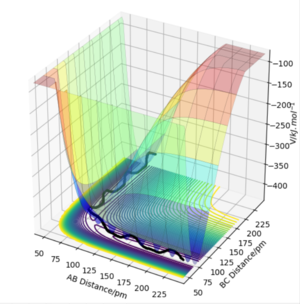
In a potential energy surface diagram, the reaction pathway (black line) proceeds along the minimum energy path linked by the reactants and products. The transition state is the PES diagram saddle point defined mathematically by ∂V(ri)/∂ri=0.
The transition state location can be identified if V(rAB)/∂rAB=0 and V(rBC)/∂rBC=0. This point can be distinguished from the local minima if the outcome of taking the partial second derivative of potential energy with respect to either rAB or rBC is 0.
Okay, but would the second derivative to a axis be negative whilst to another be positive if it were a TS. Consider what a saddle point is...also may be worth reading up on 'Hessian'. Mys18 (talk) 02:39, 23 May 2020 (BST)
Locating the Transition State
Since the H2 + H1 surface is symmetric, the transition state must have rAB=rBC. The location of the transition state position rts can be estimated when ∂V(ri)/∂ri=0 and there will be minimal oscillation among the 3 atoms as there is no force acting along rAB and rBC.

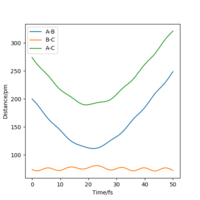
The transition state position rts is estimated as 91 pm. The internuclear distances vs time graph for rAB = rBC=91pm shows a 'flat' line, meaning no forces are acting at this position.
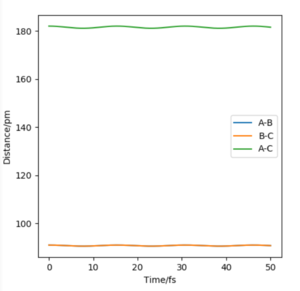
How do you think you could better accurately measure the TS? Mys18 (talk) 02:48, 23 May 2020 (BST)
Calculating the reaction path
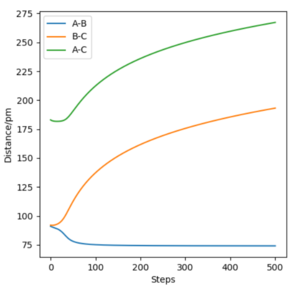
The reaction path or minimum energy path is an infinitely slow trajectory (momenta and velocities resets to zero in each time step) obtained after locating the transition state position.
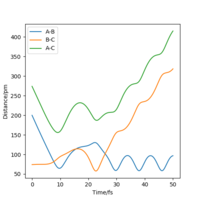
The minimum energy path initially shows a short horizontal line of the atoms entering the transition state position followed by the decreasing rate of atoms HA-HC and HB-HC increasing in distance. Atoms HA-HB forms a bond and remains constant in distance.
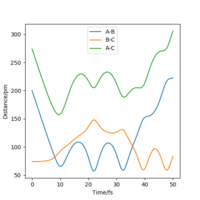
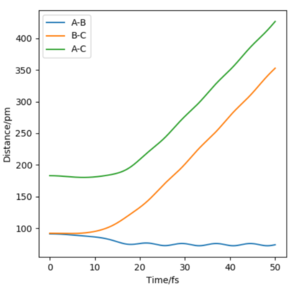
Even though the MEP outlines a reaction, it does not take into account the mass and inertia of the atoms, therefore does not provide the realistic picture of the reaction. The MEP and dynamic trajectory differs in that the realistic trajectory shows oscillations (potential energy interactions) between atoms. At first the 3 atoms are in the transition state positions, showed by the horiontal lines. The trajectory then shows a linear increase in HA-HC and HB-HC distances and HA-HB oscillates about the same position.
Reactive and Unreactive Trajectories
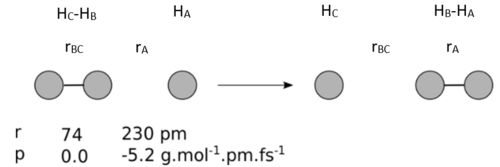
Determining whether trajectories are reactive from their momenta when rBC=74 pm and rAB=200 pm.
The hypothesis that higher values of momenta would be reactive is not precisely correct, this table shows that pBC must be greater than pAB by a specific factor to be able reactive.
But does that mean it is always reactive, Row 4 suggests you can add to your conclusions (crossing of the TS?)Mys18 (talk) 02:51, 23 May 2020 (BST)
Transition State Theory
The transition state theory attempts to provide a grearter understanding of the reaction by predicting the rate as well as the theromodynamic parameters of the reaction. However, it has its limitations. The transition state theory neglects the effects of quantum tunneling such that particles can bypass the activation energy of the transition state. Additionally, systems that have already crossed the transition state and formed products can recross the barrier to reform the reactants. Consequently, the rate calculated by the transition state theory is greater than the experimental value for the reasons that quantum effects are not taken into account.
Perfect! Do you know of some other TST assumptions? Additionally, you could reference these assumptions you have learnt.Mys18 (talk) 02:54, 23 May 2020 (BST)
Exercise 2: F + H-H and H + HF
PES Inspection
1. F + H-H -> F-H + H
Conditions: rAB = 150 pm, rBC = 80 pm, pAB = 0 g.mol-1.pm.fs-1, pBC = 0.5 g.mol-1.pm.fs-1.
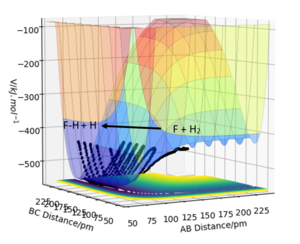
Products are lower in potential energy than reactants, therefore reaction is exothermic.The H-F bond formed releases more energy than the energy taken to break the H-H bond, therefore H-F is greater in bond strength than H2.
Good job. We can supplement your findings with actual experimental H-F and H-H bond energies (quick literature search and referencing should do the trick!). Mys18 (talk) 02:55, 23 May 2020 (BST)
2. F-H + H -> F + H-H
Conditions: rAB = 80 pm, rBC = 150 pm, pAB = 15 g.mol-1.pm.fs-1, pBC = 0 g.mol-1.pm.fs-1.
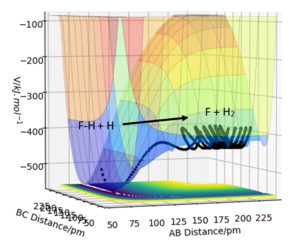
Products are higher in energy than reactants, therefore reaction is endothermic. The energy used to break the H-F bond is greater than the energy released for forming the H-H bond. The H-F bond is greater in bond strength.
Locating the Transition State Position
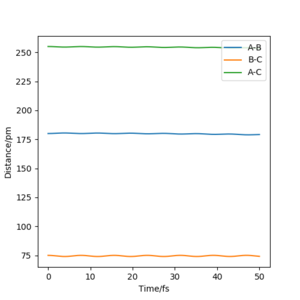
The approximate position of the transition state is F-H = 180 pm and H-H = 75 pm. Horizontal line shown on the internuclear distance vs time graph represents minimal oscillations among the atoms, ∂V(ri)/∂ri=0 no forces are acting on the F-H-H direction so transition state is reached.
Calculating the Activation Energy
The activation energy can be calculated by subtracting the potential energy of the reactants from the potential energy the TS. The potential energy of the transition state is -433.943 kJ.mol-1. The potential energy of the reactants can be obtained by performing an MEP of energy vs time for the reaction and observing the starting potential energy.
Activation energies of:
1. F + H-H -> F-H + H: -433.943 - -434.288 = +0.345 kj.mol-1

2. F-H + H -> F + H-H: -433.943 - -496.862 = +62.919 kj.mol-1

Good method. I would have expected value in the range of 1. 1 - 1.5 kJmol-1 and 2. 125-127 kJmol-1. Nonetheless, your methodology is in the right direction. Mys18 (talk) 03:01, 23 May 2020 (BST)
Reaction Dynamics
1. F + H-H -> F-H + H
Initial conditions that result in a reactive trajectory: rAB = 150 pm, rBC = 80 pm, pAB = 0 g.mol-1.pm.fs-1, pBC = 0.5 g.mol-1.pm.fs-1.
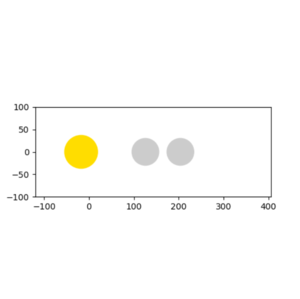

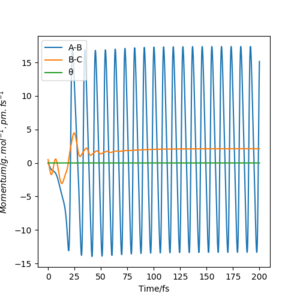
This reaction is exothermic but the total energy is conserved in a reaction, the energy release mechanism is explained below:
Originally, H-H is a molecule held together by strong potential energy. As it approaches atom F, potential energy between H-H is transferred to kinetic energy which releases energy in the reaction. The momenta vs time graph (orange line) shows the spikes in momentum/ kinetic energy for H-H (B-C) when H (B) is transferred to atom F (A). The momentum of this orange line then flattens, all kinetic energy is transferred to the formation of F-H (A-B) bond which shows oscillations in momentum by the blue line.
To confirm this experimentally, measure the change in temperature of the reaction with a thermometer which should show an increase in temperature as the reaction is exothermic.
Sure we could use a technique to measure the temperature change. What about studying the vibrational energies? Mys18 (talk) 03:03, 23 May 2020 (BST)
2. F-H + H -> F + H-H
In this reaction, a late transition state is formed because of the high electronegativity of atom F. According to Hammond's postulate, the energy of the transition state is similar to the products because the structure of the late transition state resembles the products.
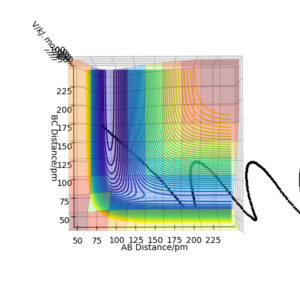
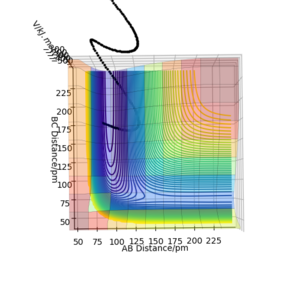
Polanyi's rules states that vibrational energy is more efficient in promoting a reaction with a late barrier than translational energy. The two PES diagrams below shows the effectiveness of 1. high vibrational energy and 2. high kinetic energy, in overcoming the barrier. The first figure shows a reactive trajectory (A-B + C -> A + B-C) is achieved from a high distribution in vibrational energy. On the other hand, the trajectory was unreactive in the high kinetic energy case.
Conditions: rAB = 75 pm, rBC = 180 pm, pAB = 20 g.mol-1.pm.fs-1, pBC = 0 g.mol-1.pm.fs-1.
Conditions: rAB = 75 pm, rBC = 180 pm, pAB = 20 g.mol-1.pm.fs-1, pBC = 10 g.mol-1.pm.fs-1.
Good. You could discuss the counter reaction of exothermic F + H2 with an early barrier. Mys18 (talk) 03:07, 23 May 2020 (BST)


