MRD:sg3415
Molecular Reaction Dynamics
Question 1: What value does the total gradient of the potential energy surface have at a minimum and at a transition structure? Briefly explain how minima and transition structures can be distinguished using the curvature of the potential energy surface.
At a minimum, the gradient is zero. The transition state is a local maximum (i.e. a maximum within the reaction pathway), therefore the gradient is also zero.
Minima can be distinguished by comparing the point to the surrounding gradient. At a minimum point, all surrounding gradients will be positive. The transition state is at a maximum within the reaction pathway, so in the directions the reaction proceeds and has come from, the gradient will be negative, but in all other directions, the gradient will be positive.
Question 2: Report your best estimate of the transition state position (rts) and explain your reasoning illustrating it with a “Internuclear Distances vs Time” screenshot for a relevant trajectory.
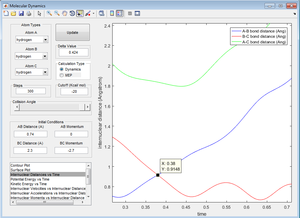
At the transition state, r1=r2. By zooming in on the "Internuclear Distances vs Time" option, it allowed the point at which r1=r2 to be determined using the label tool.
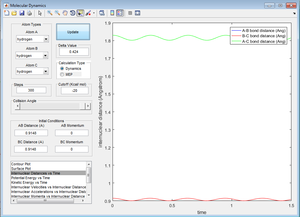
Using the internuclear distance obtained from Figure 1, Figure 2 was plotted where the internuclear distances can be seen to oscillate.
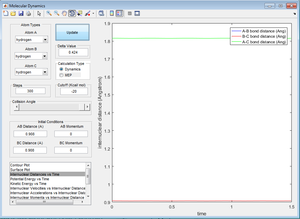
Figure 2 was manipulated by trial and error to change the internuclear distances until these were no longer seen to ocillate. This resulted in Figure 3.
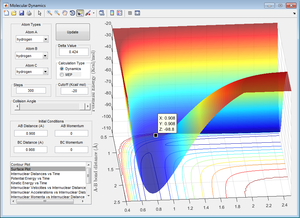
Figure 4 identifies the coordinates of the transition state as 0.908 angstrom, with an energy of -98.8 Kcal/mol.
Question 3: Comment on how the mep and the trajectory you just calculated differ.
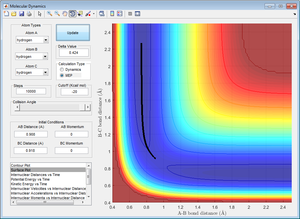
The mep calculation does not account for the mass of the atoms and determines the minimum energy point with each step of regardless of the system. Here there is no oscillation.
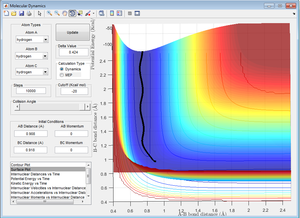
The dynamic calculation differs from the mep in that it displays an oscillation. Dynamic calculations are a simulation of the system, which here includes a diatomic molecule. All diatomics have a zero point vibrational energy, so the bond will oscillate even when at the minimum energy (i.e. when the approaching atom is still to far away for its force to be "felt"). This explains why the black line, which follows the reaction progress is seen to oscillate.
In both Figure 5 and 6, the black line is only seen to move in one direction. In both cases it moves towards AB being the molecule formed. If the values for AB and BC are swapped, the reaction would move towards BC being the molecule formed as the transition state would be "tipped" in this direction from its maximum point on the reaction pathway.
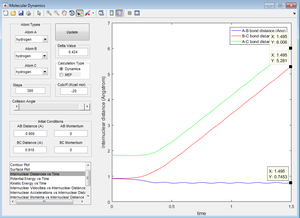
Figure 7 shows that the internuclear distance of B-C and A-C continually increase away from A-B. This shows that the molecule AB is formed because it's internuclear distance remains constant at approximately 0.9 angstrom (and a small oscillation can be observed, which is indicative of the presence of a bond). Atom C is now left alone, and it's distance from the other two atoms increases. If the number of steps is increased, the point of B-C and A-C would be shown to increase further.
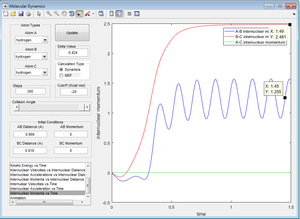
Figure 8 shows that the momentum between atoms B and C begins by increasing due to the repulsion of the atoms (the velocity increases and therefore so does the momentum). Atoms B and C then reach a point where they can no longer "feel" each other, so their velocity is no longer affected by repulsion and so the internuclear momentum flattens out at approximately 2.5. Atoms A and B initially increase for the same reason then show an oscillating internuclear momentum because they are then bonded.
When the final values from Figures 7 and 8 are calculated with the opposite sign of momentum, the graphs show the same pattern but in reverse. This is explained because the atoms are now moving towards each other.
Question 4: Complete the table by adding a column reporting if the trajectory is reactive or unreactive. For each set of initial conditions, provide a screenshot of the trajectory and a small description for what happens along the trajectory.
| p1 | p2 | Reactive? |
|---|---|---|
| -1.25 | -2.5 | Yes |
| -1.5 | -2.0 | No |
| -1.5 | -2.5 | Yes |
| -2.5 | -5.0 | No |
| -2.5 | -5.2 | Yes |
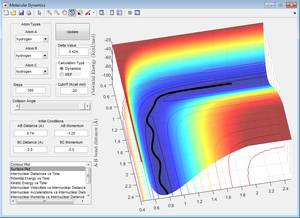
AB is a bonded molecule with little oscillation, which the passes through the transition state (the point where the black line turns perpendicular to its original direction) and forms the molecule BC, which is oscillating. This shows a reactive trajectory because a different molecule is present at the end of the reaction compared to the start.

AB is a bonded molecule with some oscillation. It does not reach the transition state as the momentum of the individual atom, C, is not great enough so AB is able to repel C before it reaches a close enough position to react. This is an unreactive trajectory because the black line showing the reaction path turns back on itself before it reaches the transition state and does not turn into the products channel.
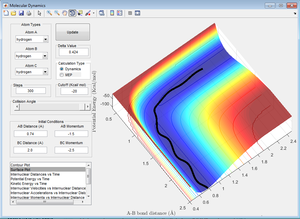
This shows a reactive trajectory, similar to that of Figure 9. The reaction pathway moves from the reactant channel to the product channel, showing the original bond was broken and a new one made.
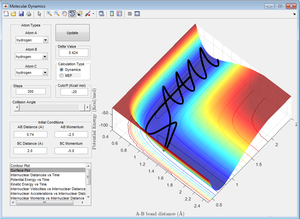
Here, the individual atom, C, approaches with high momentum, which initially causes the AB bond to break as the transition state has been passed. However, atom C continues to move with high momentum, so it gets too close to atom B. This causes it to be repelled again, and as C is repelled, A it pulled back towards atom B. The bond between A and B then reforms and atom C is left unbonded. This situation is known as "barrier recrossing".
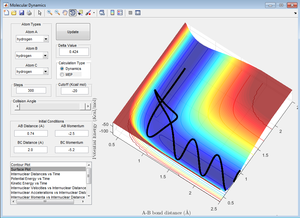
In Figure 13, there is a similar situation to that described for Figure 12. However once the barrier has been recrossed for the first time, it is then crossed again as A is pulled back towards B with such great momentum that it gets "too close" to B and is repelled, pulling C back towards B and resulting in BC forming and the reaction proceeding down the product channel of the surface plot.
Question 5: State what are the main assumptions of Transition State Theory. Given the results you have obtained, how will Transition State Theory predictions for reaction rate values compare with experimental values?
Transition State Theory (TST) makes a few key assumptions: 1. the reactants are in equilibrium with the activated complex (the structure of the transition state).[1] 2. there is a configuration beyond which the reactants cannot be reformed and the reaction will go to the products. This configuration cannot be recrossed to reform reactants.[2]
The second assumption is key to how the reaction rate values will differ from the experimental values. In Figures 12 and 13, the crossing point is re-crossed. Notably in Figure 12, the value would be differ when calculating with TST because the crossing point is recrossed so that the reactant is the final species present despite having passed the configuration that assumes the products will result.
Question 6: Classify the F + H2 and H + HF reactions according to their energetics (endothermic or exothermic). How does this relate to the bond strength of the chemical species involved? Locate the approximate position of the transition state.
F + H2 is an exothermic reaction because HF (the product) is lower in energy than H2. Energy is given out form the system to reach the products. H + HF is endothermic because HF (here the reactant) is lower in energy than H2 (the product), therefore energy is put in to the system to get from reactants to products. This information shows that the HF has a stronger bond than H2 because HF is lower in energy and so more stable.
Hammond's Postulate says that for exothermic reactions, the transition state lies closer to the reactants. The opposite is true of endothermic reactions. Using this information, it was possible to use the same method as in Question 2 to find the transition states. The transition state is located as shown in Figure 14 below. The transition state is located with r(HH)=0.7457 angstrom, r(HF)=1.775 angstrom and energy of -103.3 Kcal/mol.
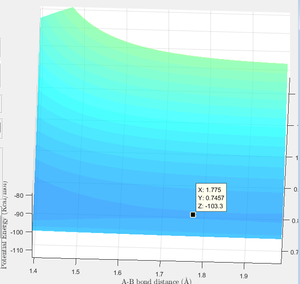
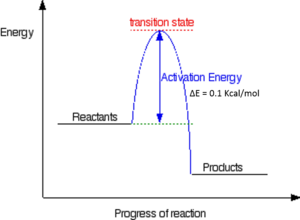
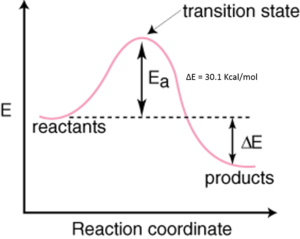
By deviating the r values firstly in one direction, then the other and using mep, it was possible to locate the energies for the productsand reactants. Each of these values have then been subtracted from the energy of the transition state (-103.3 Kcal/mol). The values for the activation energy have been displayed in Figures 15 and 16.
Question 7: In light of the fact that energy is conserved, discuss the mechanism of release of the reaction energy. How could this be confirmed experimentally?
In the reactants, energy is in the potential form because the reactants are at a higher energy. In order to reach the products, there must be a decrease in energy. In short, the formation of the products is favourable as they are lower in energy and so more stable in this situation. Energy cannot be made or lost so it must be conserved. With this in mind, as the reaction proceeds, potential energy is converted into vibrational and translational energy. The ratio of vibrational and translational energy initially will be the key factor in determining whether the products will form or whether the atoms will "bounce back" to the reactant form and will determine the energies of the products.
This can be confirmed theoretically using a number of methods. One example is IR, which measures vibrational energy. Measuring the reactants and products and observing the change in wavenumber of the bond would show that energy is changing form as the product and reactant bonds wouldn't have the same wavenumber on their IR spectra.
Question 8: Discuss how the distribution of energy between different modes (translation and vibration) affect the efficiency of the reaction.
Being able to find a set of initial conditions that resulted in a reactive trajectory was very difficult because the ratio of initial vibrational and translational energy is crucial to whether the reaction proceeds at all and if it does, how efficient it is. This illusive ratio resulted in many unreactive trajectories.
Figure 17 shows a reactive trajectory. However, it can be seen that the reaction is very inefficient because the reaction crosses the barrier 2 times before it successfully forms the products. The reason for this is that there is such a large potential energy (i.e. the product energy is far lower than the reactant energy) that upon reaching this "drop" in the reaction, the energy is converted into translational and vibrational energy, which causes the reaction to reverse back to the reactants initially. It again has a large amount of energy so "bounces back" again to the products, where the vibrational energy is extremely large.
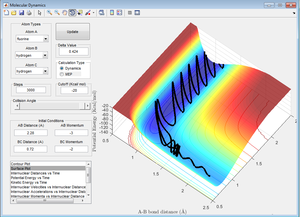
A more efficient reaction would involve no barrier recrossing. Even in this situation, it would be expected that the product would have large vibrational energy due to the large potential energy of the reactants.
References
- ↑ https://www.britannica.com/science/transition-state-theory
- ↑ R.D. Levine, Molecular Reaction Dynamics, Cambridge University Press, Cambridge.
- ↑ http://www.chemguide.co.uk/physical/basicrates/sn2profile.gif
- ↑ http://img.sparknotes.com/figures/6/62c26fd494fed99200569cfa94d97377/rxncoord1.gif
