
MRD:sds2618
Fantastic report! You structured this incredibly well and it was a pleasure marking your report. Your discussion throughout shows great understanding. Good job :) Mys18 (talk) 21:30, 1 June 2020 (BST)
Exercise 1: H + H2 system
Question 1
On a potential energy surface diagram, how is the transition state mathematically defined? How can the transition state be identified, and how can it be distinguished from a local minimum of the potential energy surface?
On a potential energy surface, the transition state can be defined as a saddle point: it is the maximum energy connecting two minima (reactants and products). At the transition state, the energies increase in all directions except for one: . Since the transition state represents a maximum in terms of energy, its first derivative will be 0: . Furthermore, the gradient of the potential at the transition state is 0:
In the case of there being other local minima on the PES (for example because of formations of other stable species), the transition state can be distinguished by checking if the point is both a maximum in one direction (in terms of energy) and a minimum in the other (in terms of reaction pathway).
Good, the TS is neither a minimum or a maximum. the second derivative of a local minimum is always >0 whereas for a TS, as it is a saddle point, the second derivative will be >0 on one axis and <0 on the orthogonal axis. Mys18 (talk) 14:46, 1 June 2020 (BST)
Question 2
Report your best estimate of the transition state position (rts) and explain your reasoning illustrating it with a “Internuclear Distances vs Time” plot for a relevant trajectory.
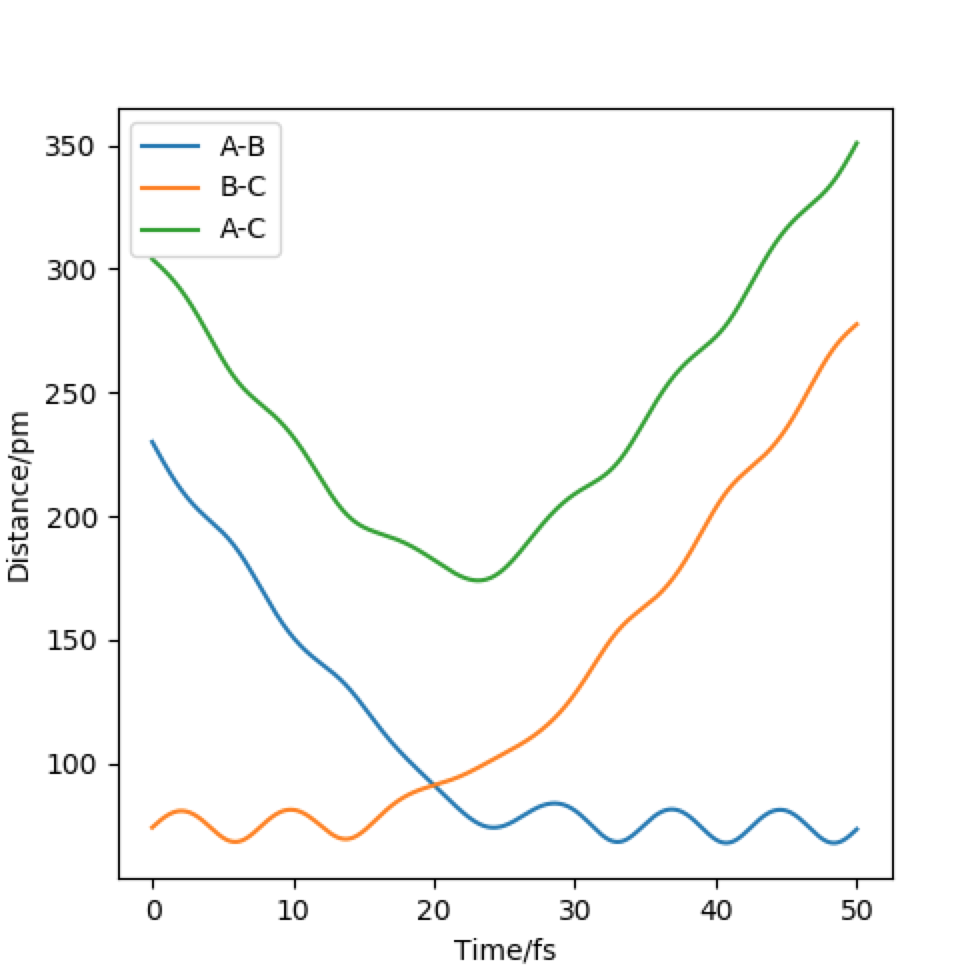
At the transition state, r1 = r2. From the "Internuclear Distances vs Time" plot of the initial H + H2 system, we can already estimate a transition state position around an internuclear distance of r1 = r2 = 90 pm at approximately 20 fs (corresponding to the point at which internuclear distances A-B and A-C intersect). After testing several initial conditions, it was found that for rAB = rBC = 90.77 pm and pAB = pBC = 0 g.mol-1.pm.fm-1 the system undergoes an extremely small systematic periodic vibration, symmetric on both atoms. Furthermore, the forces at rAB = rBC = 90.77 pm are very close to 0 (0.001 kJ.mol-1.pm-1).
| Internuclear Distances vs Time for rAB = 230 pm, pAB = -5.2 g.mol-1.pm.fm-1 and rBC = 74 pm, pBC = 0 g.mol-1.pm.fm-1 | Plot of internuclear distances vs time for rAB = rBC = 90.77 pm and pAB = pBC = 0 g.mol-1.pm.fm-1 | Forces at rAB = rBC = 90.77 pm |
|---|---|---|
 |
 |
 |
We can therefore estimate rts = 90.77 pm.
Excellent! Mys18 (talk) 14:47, 1 June 2020 (BST)
Question 3
Comment on how the mep and the trajectory you just calculated differ.
When calculating the minimum energy pathway using calculation type MEP and Dynamics, we obtain the following results (with rAB = 90.77 pm, rBC = 91.77 pm and pAB = pBC = 0 g.mol-1.pm.fm-1):
| Contour plot of the reaction path using MEP | Contour plot of the reaction path using Dynamics |
|---|---|
 |
 |
| Plot of momentum vs time of the reaction path using MEP | Plot of momentum vs time of the reaction path using Dynamics |
 |
 |
When comparing these two results, we can see that the "Dynamics" calculation includes oscillation of the atoms involved in the reaction. This is visible in the contour plots: in MEP, a straight curve shows the reaction pathway but in Dynamics we can see oscillations along this path. This is clearly visible in the plots of momentum vs time. Since for MEP, the momentum is reset to 0 after each step, we see no change in momentum over the whole reaction path but in Dynamics, we can see the increase in momentum and oscillation along this reaction.
Great, just so it is clear state the opposite for example, whereas MEP does not consider vibrational energy. Mys18 (talk) 14:50, 1 June 2020 (BST)
Look at the “Internuclear Distances vs Time” and “Momenta vs Time”. What would change if we used the initial conditions r1 = rts and r2 = rts+1 pm instead?
| Internuclear distances vs time where rAB = 90.77 pm, rBC = 91.77 pm | Internuclear distances vs time where rAB = 91.77 pm, rBC = 90.77 pm |
|---|---|
 |
 |
| Momenta vs time where rAB = 90.77 pm, rBC = 91.77 pm | Momenta vs time where rAB = 91.77 pm, rBC = 90.77 pm |
 |
 |
Changing from rAB = rts and rBC = rts + 1 to rAB = rts + 1 and rBC = rts effectively reverses the direction of the reaction pathway observed. The former gives plots showing how the internuclear distances and momenta vary with time for the H + H2 system when atom A approaches molecule BC. The latter depicts how internuclear distances and momenta vary with time for the same system but when atom C approaches molecule AB (reverse reaction). This is observed in the graphs essentially as a "switch" between A-B and B-C curves. This is because at the transition state, the system is "at the top of a hill" therefore it will not move unless we either give it momentum or change the position slightly to push the system in the direction of the reactants or the products. In this case, we are changing initial positions of the atoms to be slightly off the transition state bond distance in order to drive the system from the transition state down to reactants and products.
Setup a calculation where the initial positions correspond to the final positions of the trajectory you calculated above, the same final momenta values but with their signs reversed. What do you observe?
From this graph we can obtain the final geometry of the system which was found to be rAB = 73 pm with pAB = 5.3 g.mol-1.pm.fm-1 and rBC = 278 pm with pBC = 5.1 g.mol-1.pm.fm-1 at t = 50 fs. Let us now setup a system with initial positions rAB (0) = 73 pm and rBC (0) = 278 pm and with pAB (0) = -5.3 g.mol-1.pm.fm-1 and pBC (0) = -5.1 g.mol-1.pm.fm-1. We obtain the following results:
| Internuclear distances vs time with rAB(t=50 fm) = 73 pm, rBC(t=50 fm) = 278 pm, pAB(t=50 fm) = 5.3 g.mol-1.pm.fm-1 and pBC(t=50 fm) = 5.1 g.mol-1.pm.fm-1 | Internuclear distances vs time for rAB (0) = 73 pm and rBC (0) = 278 pm and with pAB (0) = -5.3 g.mol-1.pm.fm-1 and pBC (0) = -5.1 g.mol-1.pm.fm-1 |
|---|---|
|

|
Similar to before, swapping initial positions for final positions of the same system as well as initial and final momenta (with inversion of the sign) amounts to flipping the trend of the graph of internuclear distances vs time. The graphs show the same reactions as mentioned above: atom A approaches molecule BC to form molecule AB and atom C (left hand side) and atom C approaches molecule AB to form molecule BC and atom A (right hand side). The transition states of the two reactions are located at t ~ 20 fs and ~ 30 fs but with the same rts = 90 pm. When looking at the plots, we are basically looking at one reaction: H + H2 = H2 + H and looking at both directions of the reaction.
Good job. Mys18 (talk) 14:52, 1 June 2020 (BST)
Question 4
Complete the table above by adding the total energy, whether the trajectory is reactive or unreactive, and provide a plot of the trajectory and a small description for what happens along the trajectory. What can you conclude from the table?
| p1 /g.mol-1.pm.fm-1 | p2 /g.mol-1.pm.fm-1 | Etot /kj.mol-1 | Reactive? | Description of the dynamics | Illustration of the trajectory |
|---|---|---|---|---|---|
| -2.56 | -5.1 | -414.280 | Reactive | Atom A approaches molecule BC and passes through the transition state at ~ 21 fs. The reaction gives the following products: molecule AB and atom C.  |

|
| -3.1 | -4.1 | -420.077 | Unreactive | Atom A approaches molecule BC but the momentum isn't enough for the two to collide. The reaction does not pass through the transition state, instead it regenerates the reactants since no collision has taken place.  |

|
| -3.1 | -5.1 | -413.977 | Reactive | Atom A approaches molecule BC and passes through the transition state at ~ 21 fs. The reaction gives the following products: molecule AB and atom C.  |

|
| -5.1 | -10.1 | -357.277 | Unreactive (barrier recrossing) | Atom A approaches molecule BC and a bond between A and B forms (at t~ 8 fs). However, this bond still oscillates which breaks the AB bond and reforms the BC one (at t~ 35 fs), regenerating the reactants.  |

|
| -5.1 | -10.6 | -349.477 | Reactive (barrier recrossing) | Atom A approaches molecule BC and the AB bond forms (at t~ 8 fs). However, the oscillations of the newly formed bond are very strong (since the molecule was given such a high kinetic energy) which causes the AB bond to break to reform molecule BC temporarily (at t~ 15 fs). The oscillations of the BC bond continue and the BC bond breaks (at t~ 25 fs) which generates the products AB and single atom C.  |

|
As concluded before, trajectories with -3.1 < p1 /g.mol-1.pm.fm-1 < -1.6 and p2 = -5.1 g.mol-1.pm.fm-1 are reactive: this is the case for the first and third reaction from the table. However, if we increase the momenta outside the previously defined range, the initial positions need to be adjusted accordingly or the reaction will be unreactive. The system will either not have enough kinetic energy (too small momentum) to overcome the activation barrier thus never crossing the transition state (second reaction from the table) or the momentum will be too high and the system will cross the transition state several times, breaking and remaking the bonds between A, B and C (for the two final reactions of the table), this can result in reactive or unreactive trajectories depending on the momenta.
Very well answered section. Mys18 (talk) 21:13, 1 June 2020 (BST)
Question 5
Given the results you have obtained, how will Transition State Theory predictions for reaction rate values compare with experimental values?
In order to apply the Transition State Theory, several assumptions are made one of which is that the system can only pass through the transition state once and can't return to the reactants. [1] As we have seen from the different trajectories of the table above, this is not always the case. If the initial momenta of the different components of the system are too large, the system can cross the transition state several times resulting in barrier recrossing. This is the first limitation in predicting reaction rates using Transition State Theory which leads to an overestimation of the rate constant.
Furthermore, the assumption is made that motion along the reaction coordinate can be treated independently and classically as translational motion.[2] This will cause another discrepancy between theory and experimental results since in reality, quantum effects will contribute to the motion of the system and in some cases may even cause quantum tunneling, which enables the reactants to form the products without having to pass the energy barrier to go via the transition state (even though this effect is not very likely for this system, it is possible for certain systems). This leads to a higher rate constant since the system can form the products faster by "tunnelling past" the activation energy to form the products. However, this effect varies with the mass of the atoms and is the probability of tunnelling is usually quite small which is why in general, transition state theory overestimates the rate constant.
There are also assumptions made when calculating the partition functions (which include translational, rotational, vibrational and electronic contributions). [2] The equations used to determine translational and rotational contribution assume high temperatures (ie when the spacing between energy levels are much smaller than kT) and the vibrational contribution is determined using the basis of a simple harmonic oscillator, which is not always for high temperatures. [3]
Excellent, bonus points for your references! Mys18 (talk) 21:15, 1 June 2020 (BST)
Exercise 2: F-H-H system
Question 1
By inspecting the potential energy surfaces, classify the F + H2 and H + HF reactions according to their energetics (endothermic or exothermic). How does this relate to the bond strength of the chemical species involved?
By evaluation of the potential energy surfaces of F + H2 and H + HF [4] it was found that the first reaction is exothermic and the second endothermic. This means that the F-H bond is stronger than the H-H bond since the products of the first reaction (H + HF) are more stable than the reactants (F + H2). This corresponds to what we would expect: fluorine is a small and very electronegative atom which will therefore attract the partially positive H atom. The bond formed between the two atoms will therefore be a highly polar covalent bond.
Very thorough answer with consciousness of your own insight to bonding! One step further could be to reference some bond energies available in literature.Mys18 (talk) 21:17, 1 June 2020 (BST)
Question 2
Locate the approximate position of the transition state.
According to Hammond's postulate the structure of the transition state will resemble the structure of the nearest stable species (either products or reactants). Taking the first reaction F + H2 = H + HF, the transition state will resemble the reactants since it is an exothermic reaction. This is the opposite for the second reaction: the transition state will resemble the products for the endothermic reaction. In both cases, the structure of the transition state will be closer to that of "F + H2".
We can therefore assume that at the transition state the F-H distance will be larger than the H-H distance. After testing several initial distances, it was found that the transition state has the following internuclear distances: rFH = 182 pm and rHH = 74 pm. When setting the initial conditions to these parameters (with pFH = pHH = 0 g.mol-1.pm.fm-1), the Animation showed a small periodic oscillation of the atoms and the plot of Internuclear Distances vs Time was the following:
| Internuclear Distances vs Time of the transition state of HF + H | Forces at the transition state |
|---|---|
 |
 |
We can see that the oscillations of all internuclear distances are "parallel" to each other which shows that no collision will take place with 0 momentum at these specific distances, which is the definition of the transition state. Furthermore, the forces at the transition state are very close to 0 which means that the system will not move if no momentum or change in position is given to it.
Question 3
Report the activation energy for both reactions.
To find the activation energies of both reactions, we will run the program (using MEP) starting from the a structure close to the transition state and drive the reaction towards HF + H to find Ea for H + HF = F + H2 and to find Ea for F + H2 = H + HF, we will drive the reaction towards F + H2. Considering the previously determined internuclear distances of the transition state determined previously, it was found that the following parameters drive the transition state towards FH + H: rFH = 170 pm, rHH = 74 pm and pFH = pHH = 0 g.mol-1.pm.fm-1. In order to drive the transition state towards F + H2 we will need to prolong the F-H distance and reduce the H-H distance slightly. After several tries, the following parameters were used to find the activation energy: rFH = 190 pm, rHH = 70 pm and pFH = pHH = 0 g.mol-1.pm.fm-1. Using these two initial conditions, we will plot a graph of Energy vs Time and determine the activation energies of both reactions by taking the difference of the maximum of the curve (energy of the transition state) and the minimum (energy of the products).
The following results were obtained:
| Energy vs Time (rFH = 150 pm, rHH = 74 pm, pFH = pHH = 0 g.mol-1.pm.fm-1) | energy vs Time ( rFH = 190 pm, rHH = 70 pm and pFH = pHH = 0 g.mol-1.pm.fm-1) |
|---|---|
 |
 |
According to these graphs, the activation for the reaction H + HF = H2 + F is approximately 127 kJ.mol-1 and that of H2 = HF + H is around 0.9 kJ.mol-1. The very small activation energy for the second reaction is due to the strong driving force to form the H-F bond since this is a very stable compound. The same can be used to explain the relatively large activation energy for the inverse reaction: the HF compound is much more stable and has a very strong bon which means a lot of energy is required to break that bond in order to form a weaker, less stable one between two H atoms.
Nice. Mys18 (talk) 21:20, 1 June 2020 (BST)
Question 4
In light of the fact that energy is conserved, discuss the mechanism of release of the reaction energy. Explain how this could be confirmed experimentally.
Using the following initial conditions for the reaction F + H2 rHF = 200 pm, rHH = 74 pm, pHF = -1.0 g.mol-1.pm.fs-1 and pHH = 0 g.mol-1.pm.fs-1 (considering the activation energy for this reaction is very small, not much initial momentum is required since the reaction is "very spontaneous"), the following results were obtained:
| Contour plot | Momenta vs Time |
|---|---|
According to these graphs, we can see that once the system has passed the transition state, the newly formed H-F bond has a very large momentum (around 17 g.mol-1.pm.fs-1 ). This is because the bond between H and F is of such different nature compared to that of HH. The newly formed HF molecule is so much more stable than the reactants which is why the system gains a lot of energy once it has overcome the very small activation energy. This means that, in order to conserve energy, the system passes its excess energy into the vibration of HF. This can be seen when we observe the contour plot of this reaction: after the system passes through the transition state (in this case several times), it oscillates strongly.
This conversion from translational to vibrational energy can be tested experimentally by calorimetry, which would record an increase in temperature for exothermic reactions and a decrease for endothermic ones, or by IR spectroscopy using FTIR (Fourier transform infrared spectrometer). This would allow us to monitor vibrational excitations in a molecules and see them on the IR spectrum as bands of a certain frequency and overtones. If these are present, we know that the molecule must have some vibrational energy.
Another one to read up on is chemiluminescence... Mys18 (talk) 21:23, 1 June 2020 (BST)
Question 5
Setup a calculation starting on the side of the reactants of F + H2, at the bottom of the well rHH = 74 pm, with a momentum pFH = -1.0 g.mol-1.pm.fs-1, and explore several values of pHH in the range -6.1 to 6.1 g.mol-1.pm.fs-1 (explore values also close to these limits). What do you observe?
When testing different momenta of pHH close to the limits of -6.1 and 6 g.mol-1.pm.fs-1, we observe reactive and unreactive trajectories, however, most are unreactive. Some examples of tested trajectories are shown below:
| Contour plot pHH = -6.0 g.mol-1.pm.fm-1 | Contour plot pHH = -5.3 g.mol-1.pm.fm-1 | Contour plot pHH = 5.6 g.mol-1.pm.fm-1 | Contour plot pHH = 6.0 g.mol-1.pm.fm-1 |
|---|---|---|---|
 |
 |
 |

|
The energy put in to the HH vibration is much larger than the required activation energy of this reaction. Therefore, the H-H bond vibrates strongly whilst approaching the F molecule which makes them collide. However, the H atom colliding with the F atom has such a strong momentum that it effectively "bounces" back to the H atom and thereby back to the reactants. This results in unreactive trajectories. Even when the trajectory results in a reactive pathway (for example when pHH = 5.6 g.mol-1.pm.fm-1), the trajectory of the system has many twists and turns which represent the system making and breaking the H-H as well as the H-F bond very often. This proves that if too much initial energy is given to the system, it has enough energy to overcome the activation energy for the forward reaction as well as for the reverse reaction. Furthermore, as seen before, when the system forms the HF bond it gains a large amount of energy in the form of vibration. If this vibrational energy is large enough to overcome the activation energy of the reverse reaction, the system could potentially revert to the reactants.
For the same initial position, increase slightly the momentum pFH = -1.6 g.mol-1.pm.fs-1, and considerably reduce the overall energy of the system by reducing the momentum pHH = 0.2 g.mol-1.pm.fs-1. What do you observe now?
The following trajectory resulted from the decrease of the overall energy:
| Contour plot | Momentum vs Time |
|---|---|
 |

|
The Contour plot shows that even reducing the overall energy significantly will not result in a reactive trajectory. In this case, the HH molecule approaches the F atom and arrives at the transition state, the H-F bond forms but the strong vibrations of H-F bond (16 g.mol-1.pm.fs-1) make the system oscillate between the formation of the H-F bond and that of the H-H bond. In this case, the oscillations result in the system going back to the reactants. However, if we increase the initial H-F bond distance to 230 pm, we observe a reactive trajectory:

This proves that the correct combination of distances and momenta in the initial conditions is necessary to get a reactive trajectory. In this case, when the system starts slightly further away from the transition state, it already loses some of it's kinetic energy since it oscillates longer and therby gains less energy when it rolls down to the more stable products. The oscillations due to the products forming are still very strong but they will not cause the reactants to reform and therefore it is a reactive trajectory.
Let us now focus on the reverse reaction, H + HF. Setup initial conditions starting at the bottom of the entry channel, with very low vibrational motion on on the H - F bond, and an arbitrarily high value of pHH above the activation energy (an H atom colliding with a high kinetic energy).
After several tries, the following reactive trajectory was found:

The kinetic energy given to this reaction is 172 kJ.mol-1, a slightly larger amount than the activation energy. As we can see, a high vibration of the H-F bon dis required in order to overcome the activation energy of this reaction and break the very stable HF species.
Discuss how the distribution of energy between different modes (translation and vibration) affect the efficiency of the reaction, and how this is influenced by the position of the transition state.
According to Polanyi's rules, for a reaction with a late transition state (ie an endothermic reaction), it is more efficient to use vibrational energy instead of translational energy to drive the reaction. Similarly, for a reaction with an early transition state (exothermic reaction), it is better to use translational energy rather than vibrational energy to overcome the activation barrier. [5] This is also what was observed experimentally. For the exothermic F + H2 reaction with an early transition state, we gave no initial momentum to the HH bond (no vibration) and mostly translation was used to overcome the activation energy. The can be seen in the contour plot of the reactive trajectory: the reactants have some vibrational energy but the system stays mainly around equilibrium bond length until the products form and the excess energy gained from the formation of an extremely stable HF molecule is transferred to vibrational energy. For the endothermic HF + H reaction with a late transition state, a significant amount of vibrational energy was needed to overcome the large activation barrier in order to form the products. In the contour plot we see that the reactants oscillate a lot and we have effectively inverted the momenta of HH and HF. This proves that we have put in a significant amount of vibrational energy in order to overcome the activation barrier.
Collectively, this section is really well done. It is obvious you have thought this through and understood the task with appreciation of outside reading. Mys18 (talk) 21:28, 1 June 2020 (BST)
References
- ↑ Laidler, Keith J, Chemical kinetics, 3rd edition, 1987, 287-321.
- ↑ 2.0 2.1 Laidler, Keith J, Chemical kinetics, 3rd edition, 1987, 88-98.
- ↑ Laidler, Keith J, Chemical kinetics, 3rd edition, 1987, 115-123.
- ↑ Laidler, Keith J, Chemical kinetics, 3rd edition, 1987, 460-471.
- ↑ Laidler, Keith J, Chemical kinetics, 3rd edition, 1987, 272-274.