MRD:scm4918
EXERCISE 1: H + H2 system
Transition state
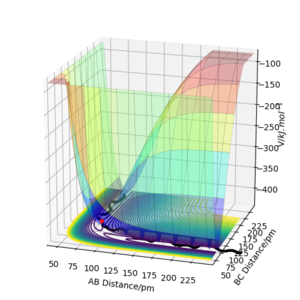
The mathematical definition for a transition state on a potential energy surface diagram is: δV/δr1 = δV/δr2 = 0, where V is the chemical potential and r1/2 the distances between the atoms. Furthermore, as this definition applies to all local minima, to distinguish the transition state from the rest, the following term must be less than 0: fxx(x0,y0)fyy(x0,y0)−f2xy(x0,y0), where x & y are the interatomic distances (r1/2) and (x0,y0) the coordinates of the saddle point. The transition state is shown in the diagram with a red dot. This is along the calculated dynamic trajectory shown by the black line.
Locating the transition state
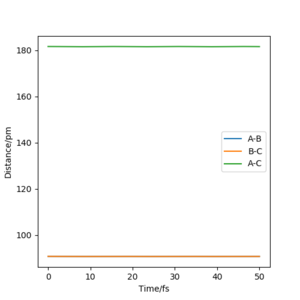
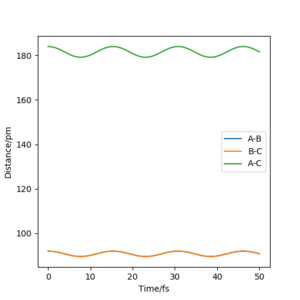
The best estimate for the transition state was found at r1=2 = 90.8 pm. By keeping the momentum at zero and the two distances equal a range of values from 85 pm to 110 pm were tested. The internuclear distance against time was plotted and at 90.8 pm the graph obtained showed 2 straight lines. Since the lines are straight the interatomic distances are constant and there is no more oscillation. Hence, the transition state has been reached.
Minimum energy path and calculated trajectory
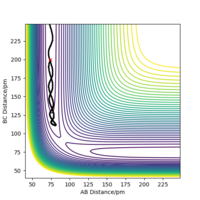
The mep (minimum energy pathway) is the lowest energy trajectory taken by a group of atoms that are rearranging themselves between two different stable configurations. At every point the velocities are reset to 0. The difference between this and the previously calculated dynamic trajectory is that as can be seen from the internuclear distances vs time graphs there are no oscillations in the mep graph. This can be explained by the fact that for mep the motion starts at the transition state and the entire path flows downhill along the lowest energy where the momentum is always reset to zero and hence the effects of inertia neglected. Good. Pu12 (talk) 01:42, 27 June 2020 (BST)
Reactive and unreactive trajectories
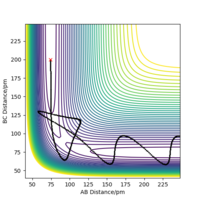
From the table above it becomes apparent that not all reactants that have enough kinetic energy to cross the TS barrier lead to a complete reaction since there is a possibility for the barrier to be crossed again.
Transition State Theory
The transition state theory does not allow for quantum mechanical phenomena and hence some of the reactions that are predicted not to occur by this theory would happen due to quantum tunneling. Another issue is the reaction is only allowed to pass through the lowest energy transition point which over predicts the frequency of reactions compared to what is found experimentally.The main effect is that the TS theory doesn't take account of system recrossing and this overestimates rate. Pu12 (talk) 01:42, 27 June 2020 (BST)


