MRD:sc3916
Molecular Reaction Dynamics Report
Potential Energy Surfaces
What value do the different components of the gradient of the potential energy surface have at a minimum and at a transition structure? Briefly explain how minima and transition structures can be distinguished using the curvature of the potential energy surface.
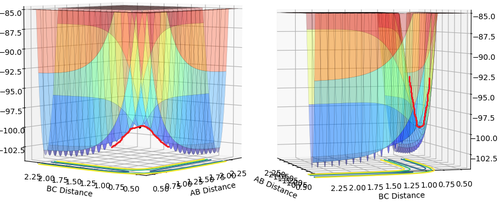
The transition structure is at a saddle point - the intersection of the minimum of a curve in one plane, and the maximum of a curve in the other. In this case, the minimum curve is on the plane corresponding to RAB=RBC, and the maximum is on the perpendicular plane. The gradient of both these curves is equal to zero.
This is different from when the potential energy surface is at a minimum - in one plane the gradient = 0, but not in the other. This allows us to distinguish between the transition structure and minima by looking at the curvature in both planes.
(Not quite - both the minimum and the saddle point have 0 gradient in all directions. You need to use second order partial derivatives to distinguish between minima and saddle points. Fjs113 (talk) 17:02, 3 June 2018 (BST))
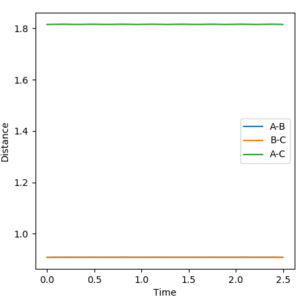
Report your best estimate of the transition state position (rts) and explain your reasoning illustrating it with a “Internuclear Distances vs Time” plot for a relevant trajectory.
rts= 0.9075 angstroms =rAB=rBC
To estimate this, a rough estimate was found by looking at the saddle point. At the saddle point, gradient = 0 in both planes - so if the system is at exactly this point, the atoms will remain stationary if it has no initial momentum. If it isn't at this point, it will start to oscillate - and the further away from the saddle point, the greater the oscillation. Therefore by plotting this internuclear distance vs time, and adjusting the distance by small amounts until there was very little oscillation seen, a more precise value was found.
Reaction trajectories
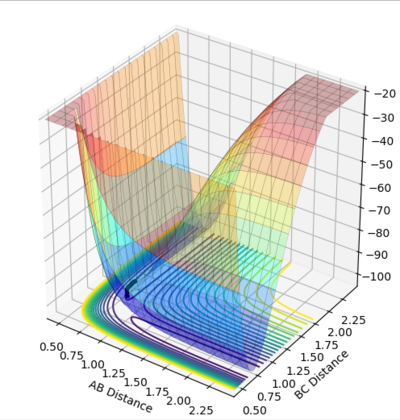
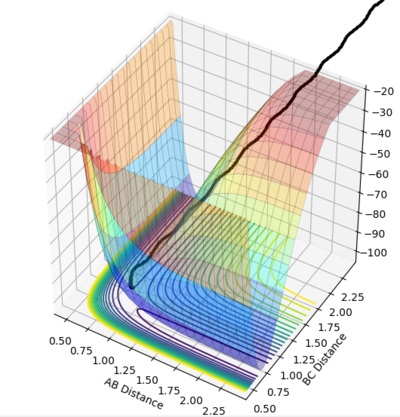
Comment on how the MEP and the trajectory you just calculated differ.
The minimum energy path represents an infinitely slow reaction trajectory. We start off a very small distance from the transition structure, and then the trajectory "rolls" down the potential energy surface, following where the gradient is most negative. Since velocity resets to 0 every time interval, so does momentum (p=mv). This means at every infinitesimally small step, this pathway will minimise its energy. This is not how it works in reality.
The dynamic trajectory is much closer to reality. As the trajectory starts to move down the potential energy surface it gains momentum. This means it will carry on rolling up the curve on the other side of the minimum (which increases its potential energy), leading to oscillations. This reflects the vibrational motion of atoms, which MEP does not include.
Dynamics Internuclear distance vs time plot:
Final AB distance = 0.8
Final BC distance = 9.0
Dynamics Internuclear Momenta vs time plot:
Final average momentum for AB = 1.25
Final average momentum for BC = 2.5
This shows the reaction path from the above calculation leads to A-B + C
If we switch around initial values, so now rAB=rts+δ and rBC=rts, the reaction path will output the same values, except the products are B-C + A.
Setup a calculation where the initial positions correspond to the final positions of the trajectory you calculated above, the same final momenta values but with their signs reversed.
The reaction proceeds from left to right across the below plot, A-B + C -> A + B-C. This reaction is essentially the reverse of the previous trajectory (allowing the pathway to "roll" down from the transition state), however it crosses over, to form the products.
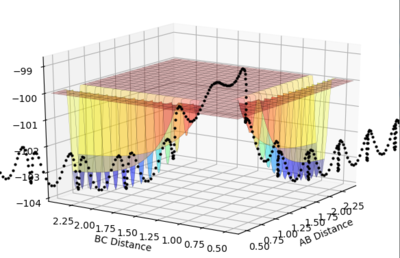
rAB = 0.8
rBC = 9.0
pAB = -1.25
pBC = -2.5
Reactive and unreactive trajectories
The following table is for the initial positions r1 = 0.74 and r2 = 2.0, with varying momentum.
| p1 | p2 | E(kcal/mol) | Reactive? |
|---|---|---|---|
| -1.25 | -2.5 | -99.119 | Yes |
| -1.5 | -2.0 | -100.456 | No |
| -1.5 | -2.5 | -98.956 | Yes |
| -2.5 | -5.0 | -84.956 | No |
| -2.5 | -5.2 | -83.416 | Yes |

the trajectory goes smoothly up to the transition state, then starts oscillating as it rolls down to the products
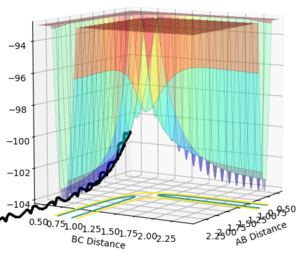
the trajectory goes up towards the transition state smoothly (but not very far), and then rolls back down the way it came, with oscillating

the trajectory goes smoothly up to the transition state, then starts oscillating as it rolls down to the products
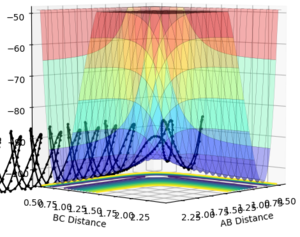
the trajectory goes smoothly up to the transition state, crosses it, but recrosses it and reverts back to the reactants, with very large oscillations
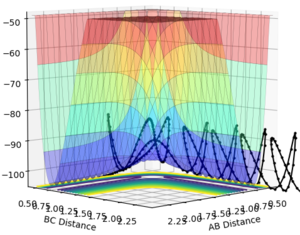
the trajectory crosses the transition state, forming the products, then recrosses it to the reactant side, and then recrosses it again, forming the products finally
State what are the main assumptions of Transition State Theory. Given the results you have obtained, how will Transition State Theory predictions for reaction rate values compare with experimental values?
4 major assumptions are used. Firstly, the Born-Oppenheimer approximation is used, and that the effects of quantum tunneling are negligible (there is a non-zero probability that reactants can convert to products without reaching the activation energy). The reactants are assumed to have a Boltzmann distribution - which is perfectly valid at low temperatures. The final assumption is that "once the system attains the transition state, with a velocity towards the product configuration, it will not reenter the initial state region again."1
This last assumption does not fit with our simulations. Both the 4th, and 5th plots contain the trajectory crossing over the transition state and back again. Since there will be more trajectories (like the 4th) which involve crossing over and are still unreactive - which are not predicted by Transition State Theory - experimental rate values will be slower than those predicted by the theory.
(Very good! Fjs113 (talk) 17:02, 3 June 2018 (BST))
EXERCISE 2: F - H - H system
Classify the F + H2 and H + HF reactions according to their energetics (endothermic or exothermic). How does this relate to the bond strength of the chemical species involved?
F + H2 is exothermic - the products have a more negative energy than the reactants. Because the enthalpy change only involves breaking a H-H bond and making a H-F bond, ΔH = +H(H-H) - H(H-F).
Since ΔH < 0:
H(H-F)>H(H-H)
This means HF has a greater bond enthalpy (and therefore strength) than H2. It can also be seen that H + HF is endothermic, which leads to the same conclusion.
(Would've been nice to see you using the PES given by the programme to explain this as well. Fjs113 (talk) 17:02, 3 June 2018 (BST))
Locate the approximate position of the transition state.
Since F + H2 is exothermic, we can assume the transition state is close in structure to the reactants (according to Hammond's postulate). Starting from near the reactants, MEP calculations with a large number of steps were done, varying the starting position to try minimise how far the trajectory moves from that position. This is because at the transition point, gradient will equal zero in both planes, so the MEP will not increase from there - so the shorter the MEP (from a constant number of steps), the closer we are to the transition state. With this method, a good approximation was found.
rts:
RHH = 0.7449 angstroms
RHF = 1.8108 angstroms
(0.7448778, 1.810754) is the super accurate value, but since this is just a model, this won't exactly match the real transition state position, so there is not much point doing it to this many decimal places.
Report the activation energy for both reactions.
By performing an MEP from next to the transition structure, the path from the TS to the reactants, or products, was found. By subtracting the final energy from the TS, the Ea was obtained. Since the activation energy for H2 + F is very small, the MEP has a very small gradient, and as such the calculation required an order of magnitude more steps in the calculation (than HF + H) to reach the reactants. Conversely, in HF + H a step change is seen.
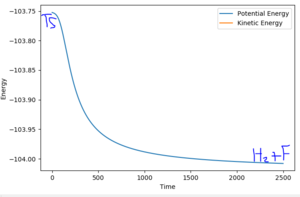
RHH=0.745
RHF=1.83
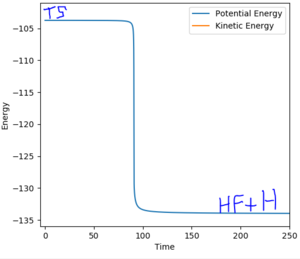
RHH=0.745
RHF=1.8
Ea(H2 + F Ea) = 0.256 kcal/mol
Ea(HF + H Ea) = 30.202 kcal/mol
(Well done for labelling the graphs! Fjs113 (talk) 17:02, 3 June 2018 (BST))
Reaction dynamics
- Identify a set of initial conditions that results in a reactive trajectory for the F + H2, and look at the “Animation” and “Internuclear Momenta vs Time”. In light of the fact that energy is conserved, discuss the mechanism of release of the reaction energy. How could this be confirmed experimentally?
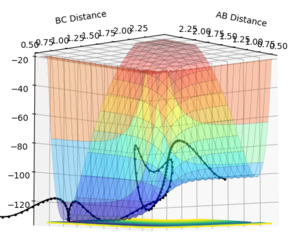
RHH (AB) = 0.74 angstroms
RHF (BC) = 2 angstroms
AB momentum = +3
BC momentum = -5
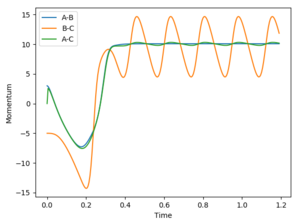
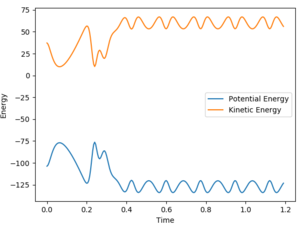
The animation of this reaction clearly shows the velocity of the lone H atom formed has increased, and vibrations occurring in HF. This can be seen in the momentum vs time plot - with the increased AB and AC momentum reflecting the increase in velocity, and BC momentum oscillation reflecting the vibrations of the H-F bond. Since translational and vibrational energy contribute to kinetic energy, we know that the energy released by this exothermic reaction (a decrease in enthalpy) is conserved in the form of increased kinetic energy. This can be seen in the below graph, and is easily shown experimentally by the resultant increase in temperature. To determine the extent vibrational energy contributes to this, we can use IR spectroscopy. If there is a lot of vibrational energy, there will be a relatively high population in the first vibrational level, and we will see overtone bands in the IR spectrum.
- Setup a calculation starting on the side of the reactants of F + H2, at the bottom of the well rHH = 0.74, with a momentum pFH = -0.5, and explore several values of pHH in the range -3 to 3 (explore values also close to these limits). What do you observe? Note that we are putting a significant amount of energy (much more than the activation energy) into the system on the H - H vibration.
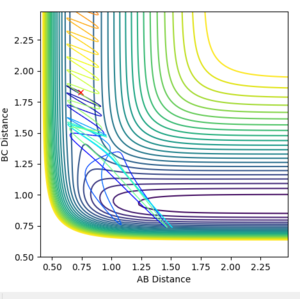
rHH=0.74 rHF=1.83
pHH=-3.0 pHF=-0.5
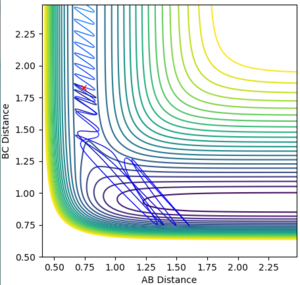
rHH=0.74 rHF=1.83
pHH=-2.0 pHF=-0.5

rHH=0.74 rHF=1.83
pHH=-1 pHF=-0.5
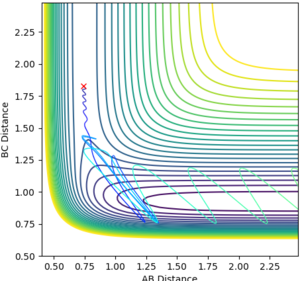
rHH=0.74 rHF=1.83
pHH=0.0 pHF=-0.5

rHH=0.74 rHF=1.83
pHH=+1.0 pHF=-0.5
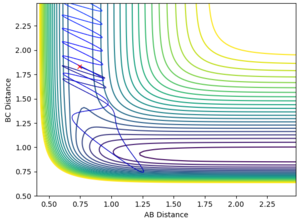
rHH=0.74 rHF=1.83
pHH=+3.0 pHF=-0.5
- For the same initial position, increase slightly the momentum pFH = -0.8, and considerably reduce the overall energy of the system by reducing the momentum pHH = 0.1. What do you observe now?
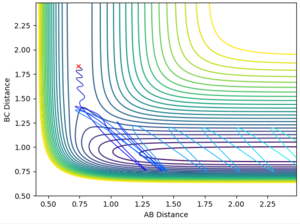
rHH=0.74 rHF=1.83
pHH=+0.1 pHF=-0.8
- Let us now focus on the reverse reaction, H + HF (an H atom with high kinetic energy colliding with HF).

rHH=0.9 rHF=1.83
pHH=-10 pHF=-5

rHH=0.9 rHF=1.83
pHH=-1.1 pHF=-13
The cases studied are an illustration of Polanyi's empirical rules. Discuss how the distribution of energy between different modes (translation and vibration) affect the efficiency of the reaction, and how this is influenced by the position of the transition state.
Polanyi's rules state, for a reaction with an early transition state, vibrational energy is more effective in overcoming the TS - so initial conditions with higher vibrational energy are more likely to result in reaction, so are more efficient. For a late transition state, translational energy is more effective in overcoming it - so atoms/molecules with a higher translational energy create a more efficient reaction.2
This can be seen in the above reaction trajectories. H2 + F has an early transition state (Hammond's postulate tells us that in an endothermic reaction, the transition state most resembles the reactants). Reaction trajectories with high initial vibrational energy (shown by pHH, conditions A, B, F) are unreactive trajectories. Conversely, those with low vibrational energy (C, D, E) are reactive. F also has increased kinetic energy on top of low vibrational energy, and this too is reactive.
The reverse reaction, HF + H, has a late transition state (from Hammond's postulate) - so initial conditions with greater vibrational energy will be more efficient. This can be seen in the reactive trajectory with conditions I. Conversely, conditions H has a much greater translational energy, and is unreactive.
(Overall, well done. Fjs113 (talk) 17:02, 3 June 2018 (BST))
References
1. T. Bligaard, J.K. Nørskov, Chemical Bonding at Surfaces and Interfaces, 2008, p.255–321, https://doi.org/10.1016/B978-044452837-7.50005-8 [accessed 24/5/18]
2. Z. Zhang, Y. Zhou, D.Zhang, G.Czakó, J. Bowman, J. Phys. Chem. Lett., 2012, 3 (23), pp 3416–3419 https://pubs.acs.org/doi/abs/10.1021/jz301649w [accessed 25/5/18]
