MRD:sb6014 Y2MRD
In this lab, the reactivities of triatomic systems were investigated, whereby an atom and a diatomic molecule collide; Matlab code was used to solve equations of motion, and determine the trajectory of the system.
EXERCISE 1: H + H2 system
What value does the total gradient of the potential energy surface have at a minimum and at a transition structure? Briefly explain how minima and transition structures can be distinguished using the curvature of the potential energy surface.
At both the minima and the transition state, the total gradient for the PES is given by along all directions; however the nature of these stationary points will differ.
At a minima, along all directions. Identification of this point gives the distances rab and rbc at the minima point. A small deviation of rbc from the minima ( where ) results in an increase in potential energy (i.e. movement across the surface, representing the vibrations of the molecules).
At a transition state, for all except along the reaction coordinate (pathway of the reaction) where it is a maximum, and . Therefore the transition point is a saddle point.
Report your best estimate of the transition state position (rts) and explain your reasoning illustrating it with a “Internuclear Distances vs Time” screenshot for a relevant trajectory.

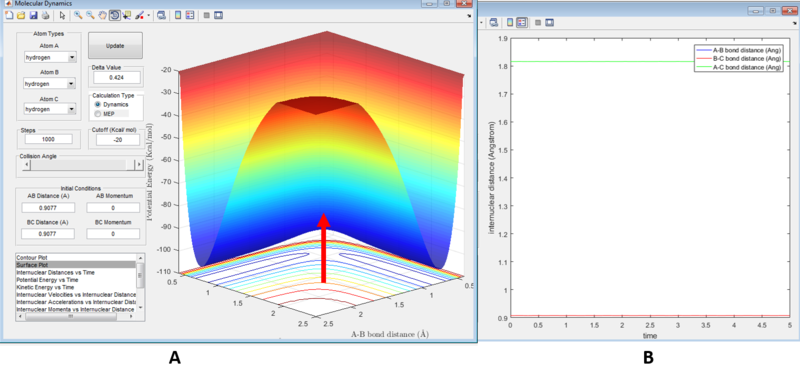
The transition state position was determined to be 0.9077 Angstroms from figure 1a where the saddle point of the PES is located by the arrow. The minima of the PES indicates the system has a minimum energy. The derivative here is zero, as mentioned previously, and thus the resultant force on the atom (which is the negative derivative of the potential) is zero. This is further illustrated in figure 1b as the internuclear distance between and , and between and are constant (no motion=no change in potential energy) and also equivalent (as both species are chemically equivalent, and so the system is symmetrical), hence their graphs are superimposed. is stationary to ensure that system remains in equilibrium.
Comment on how the mep and the trajectory you just calculated differ.

The MEP is illustrated in figure 2a. This calculation does not consider the momentum of the hydrogen atom/molecule per step, as the velocity is reset to zero at each time. The vibrations of the atom/molecule are not allowed as this would cause deviation from the well of the PES, i.e. the minimum energy of the system. In contrast, figure 2b shows the surface plot for the dynamic calculations where momenta is considered, and vibrations allowed. Also note that the MEP is very slow, hence why several steps are needed to form a path of sufficient length.
Reversal of the initial positions will result in the formation of HBC, and thus an exchange in graphs for internuclear distance/momenta against time. Following these changes, reversing the final momenta and beginning a new calculation from the final position of the last calculation, leads to a unreactive trajectory; HA approaches HB and almost reaches the transition state. However, the energy is insufficient to reach the energy of the TS and it rolls down back the products.
Complete the table by adding a column reporting if the trajectory is reactive or unreactive. For each set of initial conditions, provide a screenshot of the trajectory and a small description for what happens along the trajectory.

| p1 | p2 | outcome | Figure reference |
|---|---|---|---|
| -1.25 | -2.5 | reactive | A |
| -1.5 | -2.0 | unreactive | B |
| -1.5 | -2.5 | reactive | C |
| -2.5 | -5.0 | unreactive | D |
| -2.5 | -5.2 | reactive | E |
The first set of parameters show a reactive trajectory as seen in figure 3A; HA approaches HB, eventually reaching and overcoming the barrier at the transition state region. This is clearly seen by the change from mainly translational energy to vibrational. For the second set, figure 3B shows that the momenta of the incoming HA is insufficient to reach or overcome the barrier at the transition state. In the third set shown in figure 3C, much like the first, the barrier is overcome. In the fourth set, we observe that the system crosses the barrier but this is short-lived; HA possesses enough kinetic energy to overcome the dissociation barrier and therefore recrosses the barrier. A similar case is seen in fifth set in figure 3E; however this time, HA recrosses the boundary for a third time, this time with the correct energy to remain bound to HB. The discrepancy in the last two cases is a representation of how orientation must be correct to allow reactions to occur; the configuration of bond lengths in the final 'reactive' boundary crossing in figure 3E differs from that of previous boundary crossings, in the same trajectory, which led to recrossing. It is only the final orientation which is correct and allows reaction to occur with stable products forming.
State what are the main assumptions of Transition State Theory. Given the results you have obtained, how will Transition State Theory predictions for reaction rate values compare with experimental values?
TST does not consider the case whereby intermediates are short-lived and their energies are not in accordance with the Boltzmann distribution; this affects the momenta of the reactants and in turn the outcome (i.e. whether reaction occurs or not). The theory assumes the saddle point must be passed in the reaction; simulations show that some reaction trajectories are reactive, and do not pass this point. Either they have a greater potential energy and travel up the sides of the potential well or they have less than the energy TS; a reactive trajectory in this instance can be explained by quantum mechanics. Transition state theory utilises classical mechanics to model motion; small activation barriers could be surpassed through quantum tunneling, and so, TST fails to account for reactivity in these cases.
(how will Transition State Theory predictions for reaction rate values compare with experimental values? Lt912 (talk) 12:14, 12 June 2017 (BST))
EXERCISE 2: F - H - H system
Classify the F + H2 and H + HF reactions according to their energetics (endothermic or exothermic). How does this relate to the bond strength of the chemical species involved?

Note: atom A=Fluorine, B=hydrogen, C=hydrogen for the F + H2 system and A=hydrogen, B=hydrogen, C=Fluorine for H + HF system
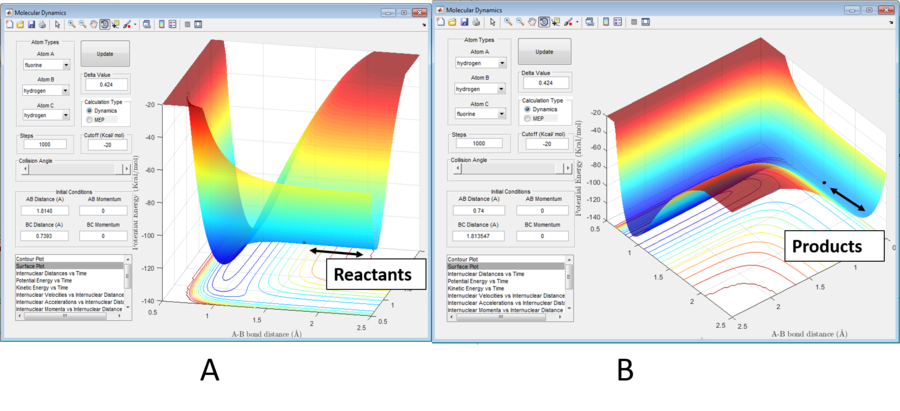
Figure 4a shows that the F + H2 must be exothermic as, by Hammond's postulate, in such a reaction, the TS structure will resemble the reactants. The transition state, marked, is closer to the reactants and thus this reaction is exothermic. More energy is evolved from the formation of the HF bond and therefore HF must have greater bond strength.
Conversely, the H + HF reaction is endothermic as the transition state resembles it's reactants.
The bond energy of HF is reported as 565 kJ/mol and H2 432; consequently we will expect the H + HF reaction to be endothermic, as more energy is required to break HF than is released from H2 formation.
Locate the approximate position of the transition state.
For F + H2: in the transition state, rHF=1.807 and rHH=0.745 Angstrom (approximately)
For H + HF: in the transition, rHH=0.745 and rHF=1.807 Angstrom (approximately).
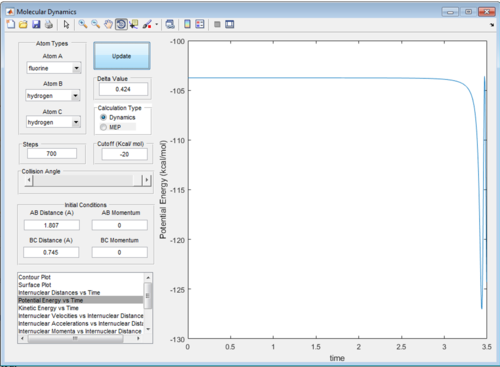
A maxima is observed at the transition state in the direction of the reaction pathway; using Hammonds postulate, we would expect this to occur closer to the the reactants in an exothermic reaction, and vice versa. This information was used to identify the rough transition state and then improved by estimation. The approximation was tested by checking the internuclear distance vs time graph for the parameters; we would expect the graph to show straight lines, indicating no vibrations and true minimum potential energy. As we approximated the TS, the system will roll down the potential, however this system will be very slow and is visible in figure 5, where the potential energy for system F + H2 remains constant for a while, but drops rapidly at time=3 a.u. For this lab, a plateau was obtained for 500 steps and deemed sufficient.

Report the activation energy for both reactions.
The activation energy is the energy of the TS state minus the minimum potential energy of the reactants.
For F + H2 :0.254 kcal/mol
For H + HF: 30.016 kcal/mol
The low activation energy of system one indicates that not much energy is needed to break H2 whereas system 2 has a high activation energy, hence HF is a stronger bond.
In light of the fact that energy is conserved, discuss the mechanism of release of the reaction energy. How could this be confirmed experimentally?
Potential energy is lost by reactants in an exothermic reaction, and converted in to vibrational and translational energy of the products, as energy is conserved. If the energy was purely translational, we would see the reaction trajectory follow the MEP, however we typically see significant vibration. The products are vibrationally excited, and eventually, this energy will dissipate, to release a photon (i.e IR radiation). This can be confirmed by calorimetry experiments.
Discuss how the distribution of energy between different modes (translation and vibration) affect the efficiency of the reaction, and how this is influenced by the position of the transition state

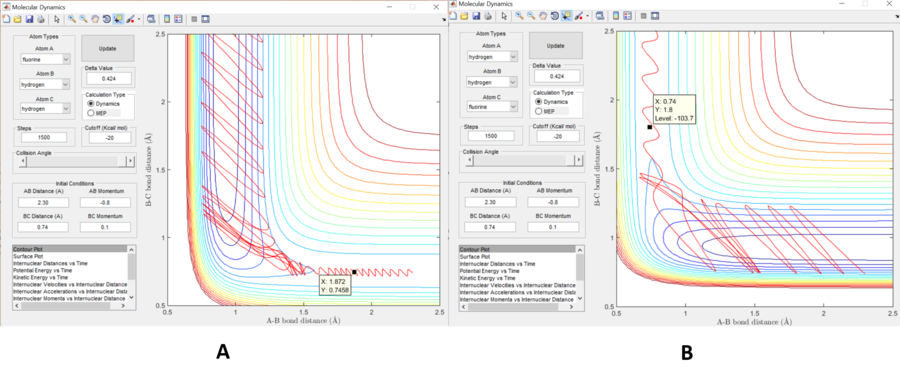
A reactive trajectory for an exothermic reaction is shown in figure 6a. At the beginning of the reaction trajectory, the ratio of vibrational to translational energy of the reactants is low. As the transition point is reached, the early release of exoergicity results in kinetic energy in the HF direction. This acceleration of H towards F allows the reaction path way to bypasses the transition point and travels up the PES, leading to a vibrationally excited HF, and the ratio of vibrational and translational energy is high. Therefore where there is early TS, translational energy is more efficient in activating the reaction.
A similar argument can be induced for the endothermic case, shown in figure 6b. For a late transition state, a greater ratio of vibrational to translational energy is most efficient.
