MRD:rs5215
Molecular Reaction Dynamics
Exercise 1: H + H2 System
Question 1) What value does the total gradient of the potential energy surface have at a minimum and at a transition structure? Briefly explain how minima and transition structures can be distinguished using the curvature of the potential energy surface.
The transition structure is a saddle point on the PES; it it is a maximum. Therefore, the gradient at the minimum and at the transition structure is zero. To distinguish between the two, the second derivative of the curve must be found.
If the second derivative is less than zero, then the point is a potential energy surface maxima (a transition structure) and if it is greater than zero then it is a potential energy surface minima.
(The derivative is taken along a direction in the PES. Here you are talking about a 1-dimensional PES but you must discuss how this applied to an N-dimensional PES. Tam10 (talk) 13:35, 31 May 2017 (BST))
Question 2) Report your best estimate of the transition state position (rts) and explain your reasoning illustrating it with a “Internuclear Distances vs Time” screenshot for a relevant trajectory.
Using the surface plot, the transition state maximum was shown to be around 0.907, as shown in the graph below.
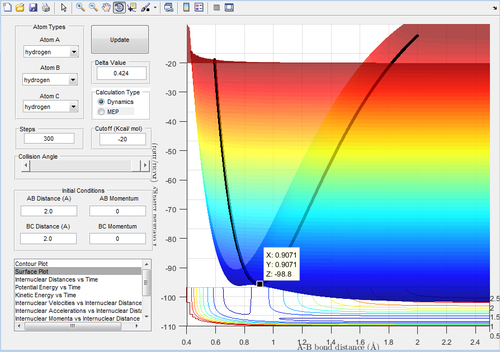
r1 = r2 = 0.9071 was then plotted using a Internuclear Distances vs Time graph:

Figure 2 shows that the oscillation of the internuclear distance is minimal with time - this is a property of transition states.
(You can still minimise this oscillation further. Tam10 (talk) 13:35, 31 May 2017 (BST))
Question 3) Calculating the reaction path: comment on how the mep and the trajectory you just calculated differ.
To calculate the reaction path, the AB distance was set to equal the transition state distance and the BC distance was set to equal the transition state distance + 0.01 angstroms.
Figure 3 and 4 show the mep and dynamic trajectories respectively.
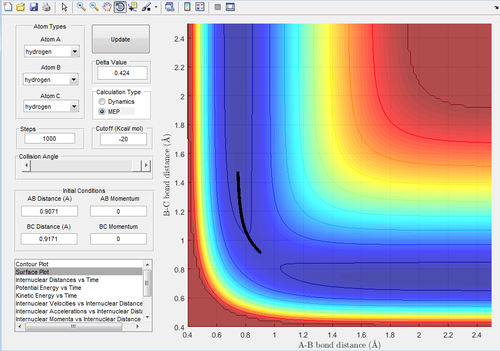
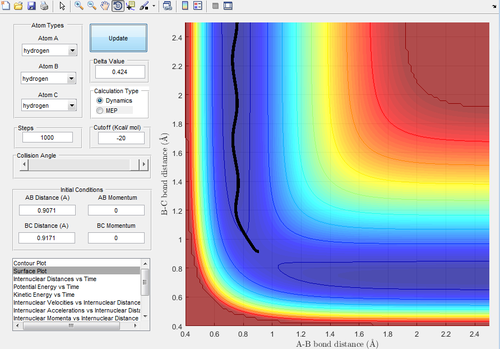
As can be seen, the dynamic trajectory shows the motion of the atoms. This is because the dynamic trajectory takes the mass of the atoms into account allowing the velocities to be included whereas the mep trajectory does not. Thus, the mep is just a line that follows the 'floor of the valley'.
Question 4) Complete the table by adding a column reporting if the trajectory is reactive or unreactive. For each set of initial conditions, provide a screenshot of the trajectory and a small description for what happens along the trajectory.
| p1 | p2 | Reactivity | Figure Number |
|---|---|---|---|
| -1.25 | -2.5 | Reactive | 5 |
| -1.5 | -2.0 | Unreactive | 6 |
| -1.5 | -2.5 | Reactive | 7 |
| -2.5 | -5.0 | Unreactive | 8 |
| -2.5 | -5.2 | Reactive | 9 |
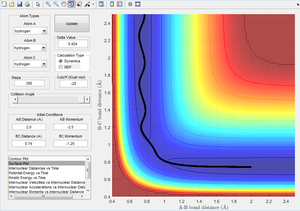
Figure 5 shows the reaction going to completion via a traditional pathway.
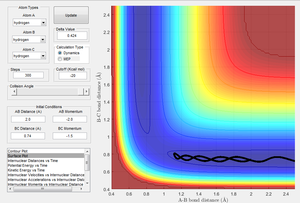
Figure 6 shows that the reactants do not have enough energy to overcome the activation barrier and thus they are unreactive and remain as reactants.

Figure 7, similarly to Figure 5, shows the reaction going to completion via a traditional pathway.
(I don't think "traditional" is the right word to use here Tam10 (talk) 13:35, 31 May 2017 (BST))
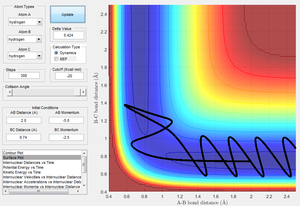
Figure 8 shows the reactants have enough energy to overcome the activation barrier, however they return to their state as reactants and thus are not reactive.
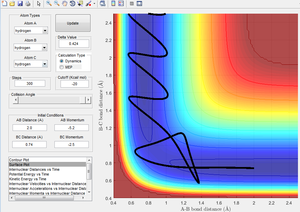
Figure 9 shows the reactants overcoming the activation barrier, returning to their state as reactants, before again crossing the activation barrier via a different pathway, allowing the reaction to go to completion.
Question 5) State what are the main assumptions of Transition State Theory. Given the results you have obtained, how will Transition State Theory predictions for reaction rate values compare with experimental values?
The Transition State Theory states that if the reactants collide with enough energy to overcome the activation energy barrier then they will react to form the products. This theory is based on classical mechanics and not quantum mechanics. Quantum mechanics includes the concept of tunnelling and alternate pathways of crossing the activation barrier. Figure 9 shows multiple ways of crossing the activation barrier, while Figure 8 shows that despite the reactants having enough energy to cross the activation barrier they do not fully react. Hence, the Transition State Theory predictions for reaction rate will be different than the experimental values - they will be lower on account of the availability of alternate pathways.
Exercise 2: F-H-H System
Question 6) Classify the F + H2 and H + HF reactions according to their energetics (endothermic or exothermic). How does this relate to the bond strength of the chemical species involved?
One way to classify the reactions is using the surface plot. For the F + H2 reaction, atom A is fluorine and atoms B and C are hydrogen.
The surface plot shows that the reaction is exothermic - the products are lower in energy than the reactants.
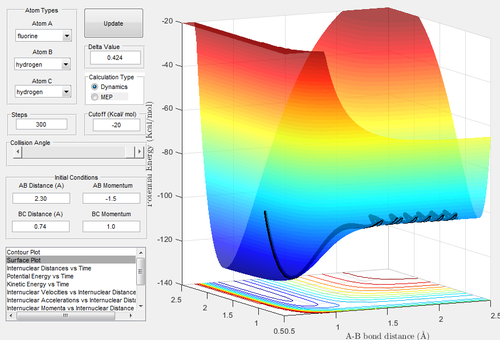
For the H + HF reaction, the surface plot shows that the reaction is endothermic - the products are higher in energy than the reactants.

To relate this to bond strength, the enthalpies of reaction must be discussed. The enthalpy of reaction can be calculated using this reaction: ∆Hreaction = Hbonds broken - Hbonds made.
The H-H bond has an enthalpy of 435 kJ mol-1 while the H-F bond has a bond enthalpy of 569 kJ mol-1. [1]
For F + H2, H-H is broken and H-F is formed.
∆HF+H2 = 435 - 569 = - 134 kJ mol-1 confirming F + H2 is exothermic.
For HF + H, the H-F bond is broken and a H-H bond is made.
∆HHF + H = 569 - 435 = 134 kJ mol-1 confirming that H + HF is endothermic.
Question 7) Locate the approximate position of the transition state.
The Hammond postulate states that the position of the transition state will resemble either the products or the reactants. If the reaction is exothermic, like the forward F + H2 reaction, the transition state will resemble the reactants more closely. If the reaction is endothermic, like the reverse reaction, the transition state will resemble the products more closely. In both these cases, the transition state will more closely resemble the F + H2 compounds.
The surface plot was used to find the approximate transition state.
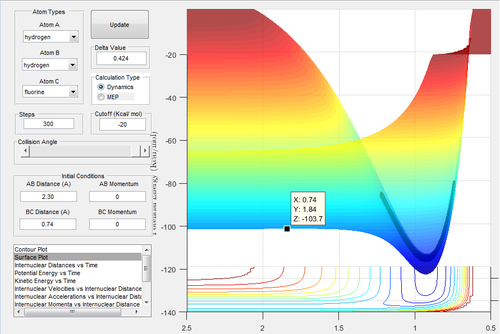
This point was checked using the internuclear distances vs time graph:

Hence, at this approximate position for the transition state, the H-F bond length is 1.814 angstroms and the H-H bond length is 0.743 angstroms. The transition state energy is -103.7 kcal mol-1
Question 8) Report the activation energy for both reactions.
The activation energy can be found using the following reaction: activation energy = energy of the transition state - the energy of the reactants.
This is different for the forward and backward reactions. In the exothermic reaction, the energy of the reactants is -103.9 kcal mol-1. For the endothermic reaction, the energy of the reactants is -133.9 kcal mol-1.
The approximate activation energies can be found by subtracting the energies above from the energy of the transition state, which is -103.7 kcal mol-1.
For the endothermic reaction:
(-103.7) - (-133.9) = 30.2 kcal mol-1
For the exothermic reaction:
(-103.7) - (-103.9) = 0.2 kcal mol-1
Question 9) In light of the fact that energy is conserved, discuss the mechanism of release of the reaction energy. How could this be confirmed experimentally?
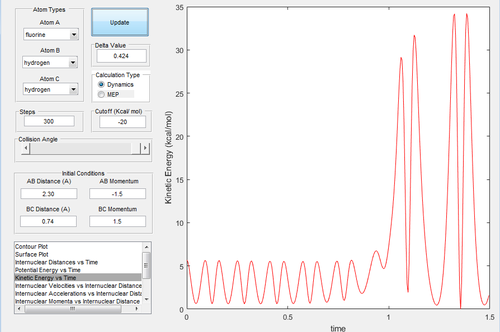
The energy of a reaction is a sum of the potential energy and the kinetic energy. It is known, from the potential energy surface for the exothermic reaction, that the products have less potential energy than the reactants. Hence, they must have more kinetic energy. This is shown using the kinetic energy vs time plot which shows that the kinetic energy dramatically increases midway.
Vibrational energy is a form of kinetic energy. Vibrational energy can be analysed experimentally using IR spectroscopy. The vibrational modes of H-F will appear as a peak in the IR spectrum while the peak created by the vibrational modes of H-H should be absent.
(H-H vibration would be absent anyway as there is no dipole moment Tam10 (talk) 13:35, 31 May 2017 (BST))
Question 10) Discuss how the distribution of energy between different modes (translation and vibration) affect the efficiency of the reaction, and how this is influenced by the position of the transition state.
Polanyi's rules relate the different modes of energy with the transition state: the rules claim that greater vibrational energy promotes a late-transition state and greater translational energy promotes an early-transition state. [2]
From Hammond's postulate, it is known that an exothermic reaction will have an early transition state (one that resembles the reactants) and an exothermic reaction will have a late transition state (one that resembles the products).
To demonstrate an increase in translational energy, the momentum can be increased. To demonstrate an increase in vibrational energy, the bond length can be decreased. The exothermic (forward) reaction therefore will not react with a high translational energy and low vibrational energy because these conditions would result in a set of less efficient trajectories thereby preventing the reaction from going to completion, as shown below.
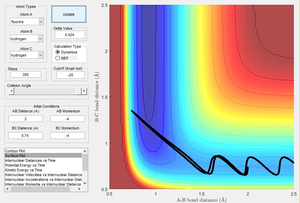
Figure 15 shows the exothermic reaction with high translational energy - it does not go to completion.
(This looks like a lot of vibrational energy Tam10 (talk) 13:35, 31 May 2017 (BST))

Figure 16 shows the same reaction with low translational energy. In this case, the reaction does go to completion.
(These are not the same conditions, and you've already started on the product side of the TS Tam10 (talk) 13:35, 31 May 2017 (BST))
The endothermic (reverse) reaction does not react with high vibrational energy (low bond length) for the same reasons as above. This is demonstrated in Figures 17 and 18.
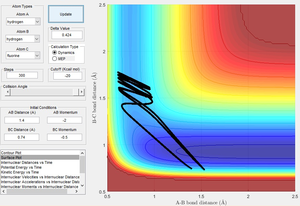
Figure 17 shows the reverse reaction with high vibrational energy. The reactants have enough energy to cross the activation barrier but instead return to their state as reactants.

Figure 18 shows the reverse reaction with low vibrational energy - the reaction goes to completion.
(Again, you're not starting at the same point, and for the reactive, you've started at an extremely high potential energy Tam10 (talk) 13:35, 31 May 2017 (BST))
Hence, the distribution of energy between the different modes can favour either an early or late transition state which affects the efficiency of the reaction by allowing the reaction to take alternate pathways.
(You must keep conditions that you are not testing the same for a fair assessment. Tam10 (talk) 13:35, 31 May 2017 (BST))
References
- ↑ http://www4.ncsu.edu/~shultz/Common_Bond_enthalpies.pdf - Accessed: 16/05/17
- ↑ Zhang, Zhaojun, et al. "Theoretical study of the validity of the Polanyi rules for the late-barrier Cl+ CHD3 reaction." The journal of physical chemistry letters 3.23 (2012): 3416-3419.
