MRD:rf116
Molecular Reaction Dynamics
Introduction
In this experiment, two reaction scenarios are investigated. In the first case, the H + H2 reaction is investigated, and in the second case, both the F + H2 --> H + HF and the reverse reaction H + HF --> F + H2 is investigated. The potential surface of the reactions are plotted, and the conditions optimised to find reactive trajectories and the locations of the respective transition states. Differences in the momenta and position of the particles are shown to have an effect on the kinetic energy of the reactants and thus determine whether or not the trajectory is reactive.
(Great that you included an introduction! Fjs113 (talk) 21:12, 17 May 2018 (BST))
H + H2 System

There are two minima (potential wells) and one saddle point, and at each the gradient, the partial derivative of the potential with respect to the position, r1 or r2, becomes zero. If a molecule starts in the first potential well, the potential defined by the Lennard-Jones potential, it then reacts and gains enough energy to oscillate out of the potential well. The transition state is then a saddle point, and the products exist in another potential well minima. The curvature of the potential energy can be used to distinguish between the minima and transition state, using differential calculus. If the potential is defined as V(r1, r2), then D is defined as D =∂V²/∂²r1.∂V²/∂²r2 - (∂V²∂r1∂r2)², which is the determinant of the Hessian. If D is less than zero, then the stationary point is a saddle point, if D is greater than zero, and ∂V²/∂²r1 is greater than zero, then the stationary point is an energy minima.
(Careful - the TS is not a saddle point with respect to r1 and r2, but rather q1 and q2 which denote the reaction coordinate as well as its orthogonal counterpart. Fjs113 (talk) 21:12, 17 May 2018 (BST))
Locating the Transition State
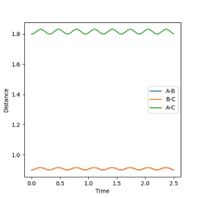
The transition state is located at the position where r1 = r2. This was determined to be rts = 0.9 Å, as this is the region where both potential and kinetic energy are constant, there is no oscillation and A-B and B-C overlap. The internuclear distance vs time, as shown in Figure 1, shows minimal oscillation of the bond distances and hence represents the saddle point, which is the transition state. The contour map shown in Figure 2 shows that the trajectory of the particle is minimal (as stationary as possible), corresponding to the transition state.
(As far as your plot goes, there is definitely still oscillation there. You could've gone to more decimal places to find a more accurate estimate of the TS. Fjs113 (talk) 21:12, 17 May 2018 (BST))
Calculating the Reaction Path
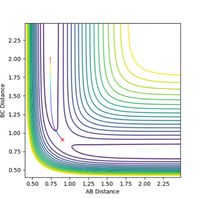
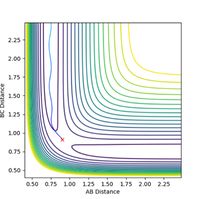
When r1 = 0.9 + 0.01 = 0.91 Å = rts + 0.01 and r2 = 0.9 Å = rts, and p1 = p2 = 0, the path from H1 to H2 - H3 as minimum energy path (mep) plot is observed as a smooth path, in comparison to the trajectory (calculated using dynamics) which is slightly oscillating as the particle oscillates along the well moving up and down the sides, as observed in Figures 3 and 4. The real trajectory is oscillating as a particle moves as a wave hence the AB and BC distance oscillates accordingly. Conversely, the minimum energy path does not oscillate in this way as the mep represents the most likely reaction mechanism, and therefore averages the motion, creating a smooth line. The minimum energy corresponds to the bottom of the potential well and therefore the particle does not move up and down the sides of the well, instead mapping a straight line along the base of the well, where the energy is at a minimum.
(What do you mean by "particle" here? Remember, this is a triatomic system. Speaking of particles is misleading. Fjs113 (talk) 21:12, 17 May 2018 (BST))
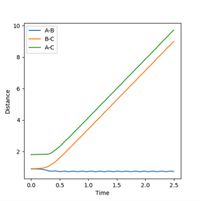


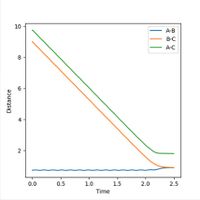
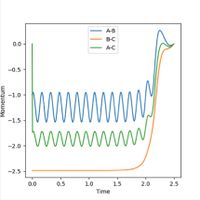
The Internuclear distance vs Time and Internuclear Momenta vs Time graphs, as shown in Figures 5 and 6 respectively, indicate that the final position of r1 is 0.73 Å and r2 is 9.00 Å. The internuclear distance vs time graph shows that the distance between H1 and H3 and the distances between H2 and H3 increase linearly with time, due to repulsion between particles. (Not quite - at large-ish distances, there is no repulsion. Instead, the particles travel at almost constant speeds apart because they have positive momentum with respect to each other. Fjs113 (talk) 21:12, 17 May 2018 (BST))
Similarly, the momenta is shown to also increase with time. Initially a smooth increase is observed, but after a short period of time, the momenta of the H1-H2 and H1-H3 particles begins to oscillate periodically, whereas the H2-H3 does not oscillate, but remains smooth and at the highest value. This is as the H2-H3 bond breaks, so there is no longer any oscillation between the atoms. Conversely, the momenta of the other molecules does oscillate as the distances between these particles is still changing - one represents the new bond formed, the bond vibration, and the other represents the changing distance between the particles. The final average momentum of p1(t) and p2(t) at large time, t is 1.74. In this order the reaction is shown as starting at the transition state and the trajectory of the particle moves towards the products. If the values of r1 and r2 are reversed, that is r1 = 0.9 Å and r2 = 0.91 Å, then the trajectory of the particle reverses, and approaches the transition state from the opposite direction. In this instance, the trajectory starts at the transition state, and proceeds to move towards the reactants, this is shown in Figure 7.
When the initial conditions are set to the final conditions, and the sign of the momenta changed to negative, the spectra reverse and show that the original initial conditions now become the final conditions. This represents the reverse reaction, the final conditions start at the products and end at the reactants, when previously this was the opposite.
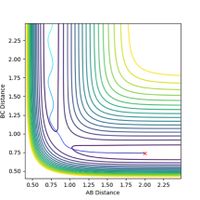
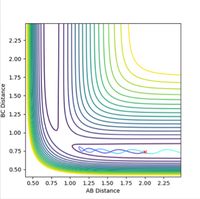
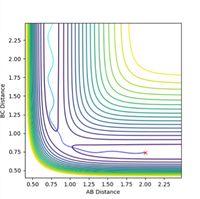

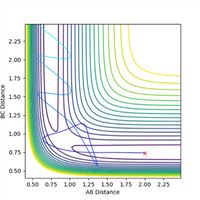
If a trajectory has enough kinetic energy to overcome the activation energy barrier, then the trajectory will be reactive, and if it has less energy than this amount, then it will be unreactive. Kinetic energy is equal to the momentum squared divided by 2 x the mass of the particle. Hence the momenta of the particles can be used to determine whether or not the trajectory is reactive. The trajectories of the particle at different momenta are shown in Figures 10-14.
Figure 10 is representative of a reactive trajectory, which occurs when the values of the momenta are p1 = -1.25 and p2 = -2.5. The particle clearly begins in the first potential well representative of the reactants, before oscillating past the transition state and into the second potential well, which corresponds to the products. Figure 11 shows the trajectory at p1 = -1.5 and p2 = -2.0, and shows an unreactive pathway. The particle begins in the reactants potential well, it oscillates closer to the transition state, but does not have sufficient energy to overcome the activation barrier, hence it oscillates back along the same path, and remains as unreacted reactants. Figure 12, when p1 = -1.5 and p2 = -2.5, shows a similar trajectory to that of Figure 10, in which the value of p2 is the same and p1 differs by only -0.25. This trajectory is also reactive as the particle starts at the reactants, oscillates out of the potential well, past the transition state and into the products. The particle in this instance oscillates with a higher frequency than in Figure 10, as observed by a slight increase in the number of oscillations. Figure 13 represents the trajectory when p1 = -2.5 and p2 = -5.0. This trajectory is slightly reactive, as the particle does oscillate slightly beyond the transition state and into the second potential well of the products, however the path does not extend very far into the products and it soon recrosses the barrier and circles back to the reactants. Figure 14 shows a reactive trajectory, when p1 = -2.5 and p2 = -5.2. The trajectory again maps from the reactants but initially does not have sufficient energy to enter the potential well of the products, and briefly recrosses the barrier back to the reactants, before finally entering the product potential well, oscillating at a much higher frequency.
In conclusion, when p2 is decreased too much (made less negative), the trajectory becomes unreactive. When p2 is increased (made more negative) to a sufficiently large amount and p1 is increased to -2.5, the trajectory is reactive but does not map a straight path through the transition state to the products, and circles back to the potential well of the reactants before it reaches the products - the trajectory recrosses the barrier. When the total energy is large <-100 kcal/mol, the trajectory is unreactive. When the momenta is decreased, the kinetic energy is decreased also as they are directly proportional. It can be concluded that when the momenta of p2 is decreased to at least -2.0, the particle no longer has sufficient kinetic energy to overcome the activation energy barrier.
| p1 | p2 | Total Energy | Is the trajectory reactive or unreactive? |
| -1.25 | -2.5 | -99.0 | Reactive |
| -1.5 | -2.0 | -100.5 | Unreactive |
| -1.5 | -2.5 | -99.0 | Reactive |
| -2.5 | -5.0 | -85.0 | Slightly Reactive |
| -2.5 | -5.2 | -83.4 | Reactive |
Transition State Theory
Transition state theory assumes an equilibrium between reactants and products, and that there is a quasi-equilibrium between the transition state and the products. An equilibrium constant for this equilibrium can then be determined using the equation K = (concentration of the transition state)/(concentration of reactant A)(concentration of reactant B) = [TS]++/[A][B]. The rate of reaction is therefore given by d[Products]/dt = k[Reactants]. Where k =k++K++. The value of k++ = κν, where κ is the proportionality constant and ν is the vibrational frequency. K++ = kBT/hν x (e-ΔG++/RT). The value of k is therefore dependent on the Gibbs free energy of activation, ΔG++. As ΔG++ increases and becomes more negative, the value of ΔG++/RT will increase, and of e-ΔG++/RT will decrease. Hence the value of the rate constant k will also decrease. The rate therefore decreases as ΔG++ increases. Transition state theory will therefore predict that when the energy difference between the reactants and the transition state is high - at high ΔG++, the rate of reaction decreases. When the particle has lots of excess energy the rate of reaction will be low, which would correspond to Figures 10 and 12. However, the theory does not take into consideration any barrier recrossing or quantum tunnelling as it does not account for any quantum phenomena, which can be observed as shown in Figures 13 and 14. The particles here have sufficient energy to overcome the activation barrier, and using transition state theory they would be expected to have a quicker rate of reaction than the trajectories shown in Figures 10 and 12. The experimental values would therefore differ from theory in this instance as the experimental rate is likely to be lower than the predicted value, as at any time, some of the reactants that have already reacted to form the products may cross back over the barrier to form the reactants again, reducing the rate.
(The latter half is absolutely perfect! Talking about the quasi-equilibrium makes less sense in this context as we're looking at three isolated atoms rather than a statistical ensemble. Fjs113 (talk) 21:12, 17 May 2018 (BST))
F-H-H System
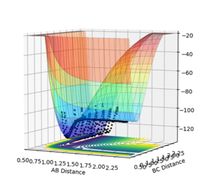

A surface plot of both F + H2 and H + HF reactions are shown in Figures 15 and 16 respectively. The F + H2 reaction is exothermic. The surface plot of the reaction shows the particles oscillating along the Lennard-Jones potential, and the particle eventually goes off to infinity, which indicates that the bond has been broken. The trajectory is concentrated near the reactants, and hence the transition state is early, and is located nearer the reactants, which is formed when the reactants approach each other. This is indicative of an exothermic reaction. Conversely, the H + HF reaction is endothermic. Figure 16 shows the trajectory, which begins nearer the products before oscillating out of the page past the reactants. This shows that the transition state is late and is formed nearer the products. The H-F bond strength is greater than the H-H bond strength. When the H-F bond breaks, more energy is absorbed in comparison to when the H-H bond breaks and alternatively more energy is released to form the H-F bond than the H-H. Since energy is released when a new bond is formed, and energy is absorbed when a bond is broken, in the forwards reaction F + H2 --> H + HF, more energy is released from the forming of the H-F bond than is taken in when breaking the H-H bond. Therefore more energy is released than is absorbed, and the process is exothermic (releases energy) and the enthalpy change is negative. For the reverse reaction H + HF --> F + H2, more energy is absorbed when breaking the H-F bond than is released when the H-H bond forms. Hence more energy is absorbed than released and the reaction is endothermic (absorbs energy) and the enthalpy change is positive.
(Very good! Fjs113 (talk) 21:12, 17 May 2018 (BST))
Locating the Transition State
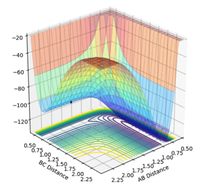
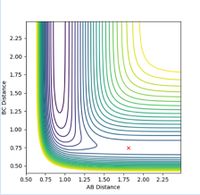
The transition state for the F + H2 reaction is located midway through the Lennard-Jones potential at the coordinates rHH = 0.745 Å and rFH = 1.811 Å. The transition state for this reaction can be observed as a surface plot in Figure 17 and as a contour plot in Figure 18. The transition state of the reverse reaction is located in the potential well at the back of the potential surface (not the Lennard-Jones potential well), and it is located in the centre of this well for the H + HF reaction at alternate coordinates. If the transition state was any further left or right, it would oscillate towards the reactants or the products.
(Good, but would've loved to see some reasoning/derivation of how you got to the TS. Show your working, even it is just an educated guess. Fjs113 (talk) 21:12, 17 May 2018 (BST))
Activation Energy
The activation energy was determined by first finding the potential energy of the transition state, which was determined to be -103.752 kcal/mol. The Hammond postulate was then used, that states that the transition state and a reactive intermediate near to the transition state have similar energy. Therefore, finding the energy of the intermediate will also give the energy of the transition state. For the forwards reaction, F + H2 --> H + HF, the trajectory was then modified to find the energy slightly nearer the reactants from the transition state; values of rFH = 0.745 Å and rHH = 11 Å were chosen and an mep plotted. The distance of rHH was extended so the trajectory of the particle is at a maximum. The potential energy at these coordinates was determined to be -134.025 kcal/mol. The activation energy is the difference between these two values, hence Ea = + 30.273 kcal/mol for the forwards reaction.
For the H + HF reaction, the coordinates were chosen such that rHF = 11 Å and rHH = 0.745 Å. The potential energy was determined to be -104.101 kcal/mol at this point, and therefore this reaction has an activation energy of Ea = + 0.349 kcal/mol, which is significantly smaller in comparison to the forwards reaction.
Finding Reactive Initial Conditions for F + H2
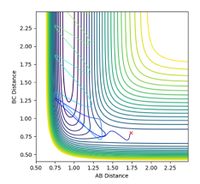
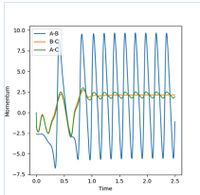
A set of initial conditions was found that indicated a reactive trajectory when rHH = 0.799 Å, rHF = 1.74 Å, pHH = -1.7 and pHF = -2.6. Figure 19 shows the contour map of this trajectory, whilst Figure 20 shows the corresponding graph of internuclear momentum vs time.
In the exothermic reaction F + H2 --> H + HF, total energy is conserved, but the ratio of kinetic to potential energy is subject to change. The reactants initially have both kinetic energy, and start at a potential minima. As the particles move along the trajectory and collide, some of the kinetic energy is converted to potential energy due to the repulsion between the two particles and some remains as kinetic energy. This reaction is an exothermic reaction, hence there is an excess of energy at the end of the reaction, which is released in the form of heat energy. In order to confirm this experimentally, calorimetry at constant volume can be used to monitor the difference in temperature before and after the reaction to determine whether or not energy has been released. If the excess energy has been released as heat energy, the temperature of the calorimeter should increase after the reaction has completed.
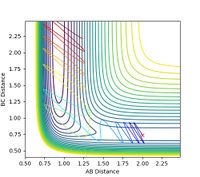
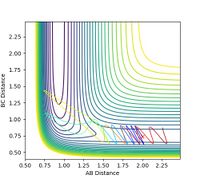
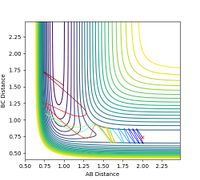
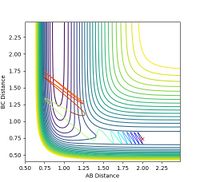


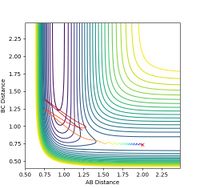
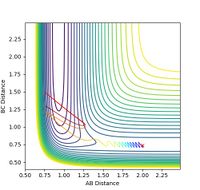
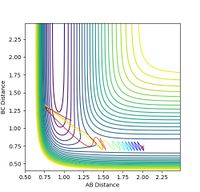
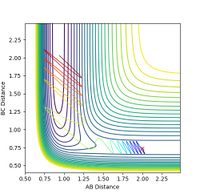


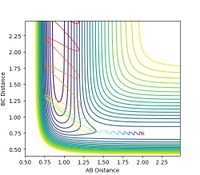
A reaction was set up that began located on the reactants side, when rHH is equal to 0.74 Å, pFH = -0.5, and rHF = 2.0 Å. The following range of values of pHH were investigated; 2.9, 2.5, 2.0, 1.5, 1.0, 0.5, 0, -0.5, -1.0, -1.5, -2.0, -2.5, -2.9, as shown in Figures 21-33.
(That's a very comprehensive range of values. You did however forget to check what happens at 3 and -3. Fjs113 (talk) 21:12, 17 May 2018 (BST))
When pHH = 2.9, the trajectory is reactive and the particle oscillates freely from the starting point past the transition state and through to the products. As pHH is decreased to 2.5, the trajectory becomes less reactive and recrosses the barrier, with a final position in the reactants region. When decreased again to 2.0, the particle does not recross the barrier, but instead is reactive, entering the products region. A similar pattern to 2.0 is observed when pHH = 1.5, the particle follows a similar trajectory, but oscillates with a higher frequency near the products in comparison. When pHH = 1.0, the initial oscillation has a much higher frequency, and the particle does not fully enter the potential well of the products. When pHH = 0.5, again the initial oscillation is of much higher frequency, but still crosses the transition state and into the products region. When pHH = 0 and -0.5, the particle moves similar to when pHH = 0.5, though they do not enter the products well as far. When pHH = -0.5 and -1.0, a similar pattern is observed - the particle slightly enters the potential well of the products. For pHH = -1.5, some barrier recrossing is observed. At pHH = -2.0, the trajectory becomes very reactive again, as the particle enters far into the products region. When pHH is decreased to -2.5 and -2.9, the trajectory becomes less reactive and barrier recrossing occurs, with the final position of the particle being located in the reactants potential well.
In summary, when pHH is close to the upper limit (3), the trajectory is very reactive and defined, when pHH is decreased but still remains positive, the trajectory becomes not as reactive and the frequency of the initial oscillation increases. When pHH becomes more negative, from -0.5 to -1.5, the trajectory reactivity decreases ultimately remains reactive. When pHH = -2.0, the trajectory becomes very reactive, but values more negative than this and close to the lower limit (-3), such as pHH = -2.5 and -2.9, show barrier recrossing and are less reactive trajectories.
As pHH is increased, so is the frequency of the vibration between the atoms. When the particles recross the barrier, the products only exist momentarily, and are then converted back to the products.
(Some very good observations, although you're not offering much in terms of explanation. Some text along the lines of why do you think that this happens at that value would've been even better. Fjs113 (talk) 21:12, 17 May 2018 (BST))
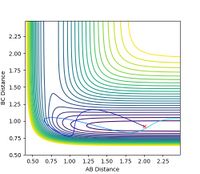
The momentum pFH was then increased to -0.8, and the overall energy of the system was reduced by setting pHH = 0.1, as shown in Figure 34. This shows the particle oscillating, the particle oscillates through to the second potential well, the products, but with an increased wavelength (reduced frequency). The particle moves far into the products region and is therefore a very reactive trajectory.
The overall energy of the system is reduced, but since pFH is still relatively high at -0.8, the trajectory is still reactive.
Reverse Reaction H + HF
For the reverse reaction H + HF, initial conditions were chosen such that the start position was located at the bottom of the reactants potential well, as shown in Figure 35. The conditions were set to pHH = 11, and pHF = -0.1. pHH was chosen to be large, so that the energy is greater than the activation energy, and pHF was chosen to be low, to ensure a low vibration of the HF bond. The position was set to rHH = 2.0 Å and rHF = 0.92 Å. The particle is observed to oscillate through to the products, but re-enters the barrier and oscillates in the opposite direction towards the reactants.
The momentum of pHH was then decreased (decreasing the energy of the HH vibration) and the momentum of pFH was increased (increasing the energy of the HF vibration), and both distances kept constant to find a reactive trajectory. The distances used are rHH = 2.0 Å, rFH = 0.92 Å, and momenta pHH = -0.4 and pFH = 7.6, the trajectory is shown in Figures 36 and 37 as a contour map and skew plot, respectively. The plots show the particle oscillating at a high frequency initially, until in the product state, where the frequency decreases slightly.


Energy Distribution
The total energy of the products and reactants is further constituted of both vibrational and translational energy. Polyani's empirical rules state that vibrational energy is more efficient than translational energy in promoting a reaction with a late transition state barrier, and that the translational energy promotes a more efficient reaction when there is an early transition state barrier than the vibrational energy. [1] Since F + H2 --> H + HF is an exothermic reaction, the energy barrier is located in the coordinates corresponding to the reactants, and the transition state barrier is early (nearer the reactants) as observed in this case. Hence the reaction proceeds more efficiently due to the translational energy of the reactants, as opposed to the vibrational energy of the reactants and so molecules with a higher degree of translational energy in comparison to vibrational are favoured, as they are more effective at crossing the barrier and promoting the reaction. [2]
The set of conditions investigated above show the difference in translational and vibrational energy. For the F + H2 --> H + HF system, changing the value of the pHH momentum changes the amount of vibrational energy the molecule has - increasing the momentum increases the amount of vibrational energy between the two H atoms in the H2 molecule. When the value of the momentum pFH is increased, the amount of translational energy the molecule has is increased. It can be observed that when pFH is increased, but the overall energy of the system is greatly reduced (as shown in Figure 34), the trajectory is still reactive. Also, when pHH is varied between 3 and -3, the trajectories do not change as drastically. This is indicative that the translational energy is more efficient at promoting a reactive trajectory than the vibrational energy in this instance as the transition state is early, in accordance with Polyani's empirical rules.
For the reverse reaction H + HF --> F + H2, the pHH momentum is decreased, and the pHF momentum is increased to obtain a reactive trajectory (Figure 36). In this instance, the translational energy is decreased and the vibrational energy is increased. Since for the reverse reaction the transition state is late, Polyani's empirical rules states that vibrational energy will be more efficient at promoting the reaction than the translational energy, which is indeed the case.
