MRD:report 01507455
EXERCISE 1: H + H2 system
On a potential energy surface diagram, how is the transition state mathematically defined? How can the transition state be identified, and how can it be distinguished from a local minimum of the potential energy surface?
On a potential energy surface diagram, the transition state is mathematically defined as the point on a potential energy surface where ∂V(ri)/∂ri=0 (i.e. the gradient of the potential is zero). The transition state can be identified by finding the saddle point, the highest potential energy point on the minimum energy path connecting the reactants and products. Saddle points can be identified by finding a stationary point (x0,y0) on a plot where ∂f/∂x=0, ∂f/∂y=0 and (∂2f/∂y2)(∂2f/∂x2) - (∂2f/∂x∂y)2 < 0. In this case, f = V(ri), x = r1 and y = r2. A local minimum of the potential energy surface will also have ∂f/∂x=0 and ∂f/∂y=0, but can be distinguished from the fact that (∂2f/∂y2)(∂2f/∂x2) - (∂2f/∂x∂y)2 > 0.
Great answer. Rs6817 (talk) 16:55, 27 May 2020 (BST)
Report your best estimate of the transition state position (rts) and explain your reasoning illustrating it with a “Internuclear Distances vs Time” plot for a relevant trajectory.
Best estimate for transition state position rts = 90 pm (1 s.f.)
Is 1 S.f. an appropriate accuracy for this value? Is the TS broad enough to cover 0.5 pm either side of this value? Rs6817 (talk) 16:55, 27 May 2020 (BST)
The kinetic energy is at its minimum value at the transition state and the potential energy is at its maximum value at the transition state in the "Energy vs Time" plot. By analysing the data for the r1(0) = 74 pm r2(0) = 230 pm, p1(0)= = 0 g.mol-1.pm.fs-1, p2(0)= = -5.2 g.mol-1.pm.fs-1 trajectory, the time at which kinetic energy was at its minimum and potential energy was at its maximum was found to be 237 fs. At this time, AB distance was found to be 74 pm and BC distance was found to be 100 pm. The mean of these two distances was my first estimate for the transition state position (90 pm to 1 significant figure).
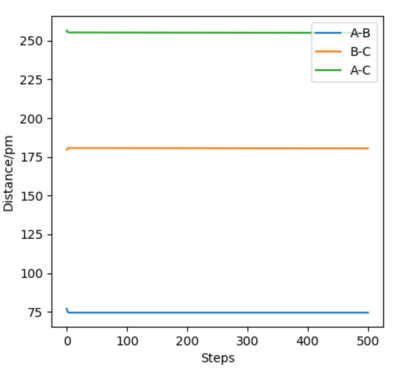
We also know that in an “Internuclear Distances vs Time” plot, at the transition state r1(t) = r2(t) = rts. Therefore the point of intersection between the AB distance and BC distance of the “Internuclear Distances vs Time” plot for the r1(0) = 74 pm r2(0) = 230 pm, p1(0) = 0 g.mol-1.pm.fs-1, p2(0) = -5.2 g.mol-1.pm.fs-1 trajectory (the plot is shown below in Figure ) can be used to figure out a second estimate for the transition state position. This was found again to be 90 pm to 1 significant figure.

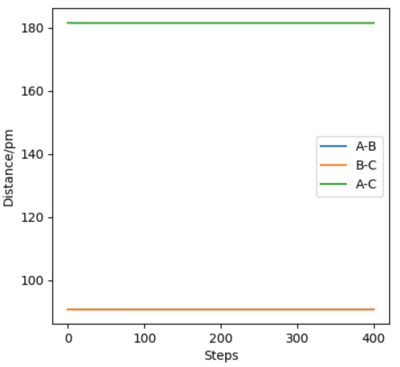
Both the first and second estimates are the same to 1 significant figure therefore 90 pm is a good estimate, as demonstrated by the “Internuclear Distances vs Time” plot for a r1(0) = r2(0) = 90 pm, p1(0) = p2(0)= 0 g.mol-1.pm.fs-1 trajectory below:

The plots for AB distance and BC distance are superimposed on top of each other and remain constant over time - this proves that the system has transition state geometry.
There are factors you could use to prove this, force along the bond, the Hessian matrix both give better indicators and would have allowed you to report a more accurate value. Rs6817 (talk) 16:55, 27 May 2020 (BST)
Comment on how the mep and the trajectory you just calculated differ.
Both the mep and the dynamics trajectory follow the valley floor to H1+ H2-H3, however they differ in the fact that the mep trajectory is a smooth consistent curve (as it does not take into acount bond vibration) whilst the dynamics trajectory is wavy (indicating that the diatomic molecule is vibrating).
More detail is required here, how does the MEP work? What are the advantages of both? Could you directly compare these using figures? Rs6817 (talk) 16:55, 27 May 2020 (BST)
For the initial positions r1 = 74 pm and r2 = 200 pm, run trajectories with the following momenta combination and complete the table. Complete the table below by adding the total energy, whether the trajectory is reactive or unreactive, and provide a plot of the trajectory and a small description for what happens along the trajectory. What can you conclude from the table?
The hypothesis made was that all trajectories starting with r1 =74 pm and r2 = 200 pm but with -1.6 > p1/ g.mol-1.pm.fs-1 and -5.1 > p2 g.mol-1.pm.fs-1 are reactive (because they have enough kinetic energy to overcome the activation barrier). The trajectory starting at the same positions but with p1 = -5.1 g.mol-1.pm.fs-1 and p2 = -10.1 g.mol-1.pm.fs-1 is unreactive. Therefore since the momenta satisfy the inequalities -1.6 > p1/ g.mol-1.pm.fs-1 as well as -5.1 > p2 g.mol-1.pm.fs-1 but the trajectory is unreactive, the hypothesis is incorrect and not all trajectories with enough kinetic energy to overcome the activation barrier will react.
Good table and answer. The second experiment in the table does not have enough kinetic energy. Rs6817 (talk) 16:55, 27 May 2020 (BST)
Given the results you have obtained, how will Transition State Theory predictions for reaction rate values compare with experimental values?
Transition State Theory estimates that all trajectories with a kinetic energy along the reaction coordinate greater than the activation energy will be reactive. However, this is not true as seen from the results obtained of a barrier recrossing case where the system reverts back to the reactants. Transition State Theory is based upon the assumption that atoms behave classically - however, when atoms behave quantum mechanically, there is a possibility of them tunneling across any barrier with a finite amount of energy.
Therefore Transition State Theory overestimates the reaction rate values when compared with experimental values because recrossings of the barrier will reduce the rate of reaction, and this isn't accounted for in a classical system.
Succinct and well described, you could have used a reference to support where this information came from.How would quantum tunnelling affect the rate? Rs6817 (talk) 16:55, 27 May 2020 (BST)
EXERCISE 2: F - H - H system
By inspecting the potential energy surfaces, classify the F + H2 and H + HF reactions according to their energetics (endothermic or exothermic). How does this relate to the bond strength of the chemical species involved?
The F + H2 reaction is exothermic whereas the H + HF reaction is endothermic. The difference between energy needed to break bonds and energy released when new bonds form gives the bond enthalpy. The greater the bond enthalpy, the more energy required to break the bond and hence the stronger it is. Therefore The H-F bond is stronger than the H-H bond because the overall H + HF reaction is endothermic, which tells us more energy was used to break the H-F bonds than was released when forming the new H-H bonds.
Correct but how does this relate to the PES? Rs6817 (talk) 16:55, 27 May 2020 (BST)
Locate the approximate position of the transition state.
H-H distance = 77 pm
H-F distance = 179.5 pm

Report the activation energy for both reactions.
Activation energy for H2 + F reaction is 128 kJ/mol-1
Activation energy for H + HF reaction is 2.06 kJ/mol-1


It is unclear how you calculated these values? The figures suggest how you did this although there is no clear explanation. Rs6817 (talk) 16:55, 27 May 2020 (BST)
Identify a set of initial conditions that results in a reactive trajectory for the F + H2, and look at the “Animation” and “Momenta vs Time”. In light of the fact that energy is conserved, discuss the mechanism of release of the reaction energy. Explain how this could be confirmed experimentally.
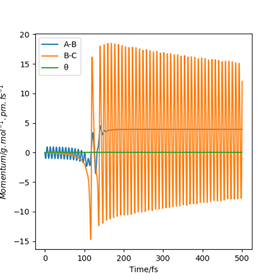
Total energy is conserved, therefore we can conclude that kinetic energy has been lost in this reaction because potential energy is gained from the conversion of reactants (F + H2) to products (HF + H). The mechanism of release of the reaction energy is therefore from an inelastic collision occurring between F and H2, causing kinetic energy to be lost by conversion into vibrational energy of the newly formed HF molecule. This increase in vibrational energy is confirmed by the "Momenta vs Time" plot of the H2 + F reaction - as shown in Figure 6, the newly formed H-F bond's vibration is much greater than the reactant H-H bond's vibration as the bond stretching displacement for B-C (which corresponds to H-F) is much greater than that for A-B (which corresponds to H-H).
Raman spectroscopy could be used to measure the vibrational frequency of bond directly to confirm the increase in bond vibration.
How could you determine this in a simpler manner? How would the vibrational energy be distributed from the reaction? Rs6817 (talk) 16:55, 27 May 2020 (BST)
The cases studied are an illustration of Polanyi's empirical rules. Discuss how the distribution of energy between different modes (translation and vibration) affect the efficiency of the reaction, and how this is influenced by the position of the transition state.
For exothermic reactions with an early transition state, more energy is distributed in the translational modes than the vibrational modes, therefore translational energy between the two colliding particles is the most effective in overcoming the barrier and increasing the efficiency of the reaction.
For endothermic reactions with a late transition state, there is a greater distribution of energy in vibrational modes than in translational modes, hence vibrational excitation is more able to improve the reactivity than the translational energy.
How does the F-H-H systme relate to the above rules? How could you have explored this? The vibrational and translational energy components could be modelled in our programme. A refernece may have helped here. Rs6817 (talk) 16:55, 27 May 2020 (BST)


