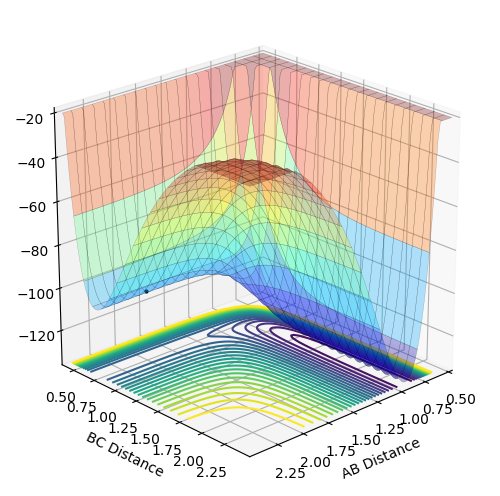
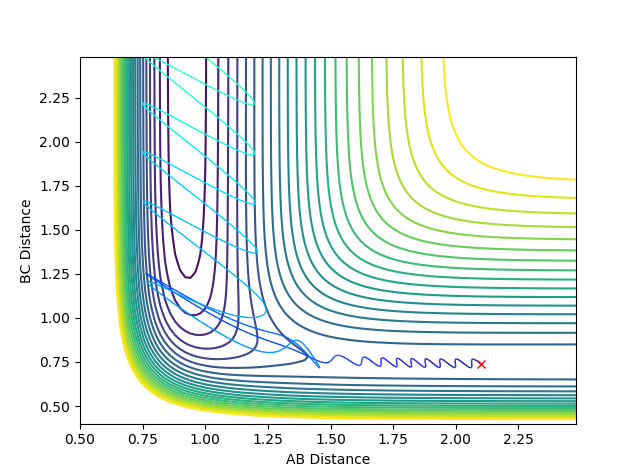
MRD:psl1618
Introduction
The reactivity of triatomic systems can be studied using molecular reaction dynamics. For a successful reaction, the reactants must collide with sufficient energy to overcome the energy barrier, and the energy has to be in the appropriate vibrational modes. In this report, the linear collision between an atom and a diatomic molecule in the gas phase was studied with an H + H2 system and an F-H-F system.
(Very nice. Fjs113 (talk) 22:30, 17 May 2018 (BST))
Exercise 1: H + H2 system
Locating the transition state
The transition state is found at the maximum of the lowest energy pathway linking the reactants and products and is a saddle point on the potential energy surface. If the system was placed at the TS with no momentum, it would stay at that point.
1. What value do the different components of the gradient of the potential energy surface have at a minimum and at a transition structure? Briefly explain how minima and transition structures can be distinguished using the curvature of the potential energy surface.
The gradient of the potential energy surface is 0 at all minima and at a transition structure. To distinguish between the two, we can evaluate the second derivatives of the potential energy with respect to r, a given interatomic distance, to find the curvature. A positive curvature indicates a minimum whereas at a transition structure, the curvature is positive with respect to one interatomic distance and negative respect to the orthogonal interatomic distance, representing a saddle point in the PE surface.
(Careful - you're referring to second order partial derivatives! Also, the TS is a saddle point with respect to the reaction coordinate and its orthogonal counterpart, not with respect to the interatomic distances. Fjs113 (talk) 22:30, 17 May 2018 (BST))
2. Report your best estimate of the transition state position (rts) and explain your reasoning illustrating it with a “Internuclear Distances vs Time” plot for a relevant trajectory.
At the transition state, rAB = rBC since the system is symmetric. With the conditions in part one, the internuclear distance vs time plot showed that the transition state was around 0.91 Å. Through further trial and error, the AB/BC distance at the transition was determined to be 0.90777 Å. The plot of internuclear distance against time showed that the rAB and rBC stayed constant until around 13 s, suggesting that this is still not the optimised TS, but given the relatively long lifetime of the transition structure, it can be said that this is a very close estimate. The constant A-B/B-C distance shows that the trajectory oscillates around that point, and the fact that A-C is double that of A-B shows that the atoms are equidistant, which is as expected for a transition state for this system.

(Very good! Fjs113 (talk) 22:30, 17 May 2018 (BST))
Calculating the reaction path
MEP vs. Dynamics calculation
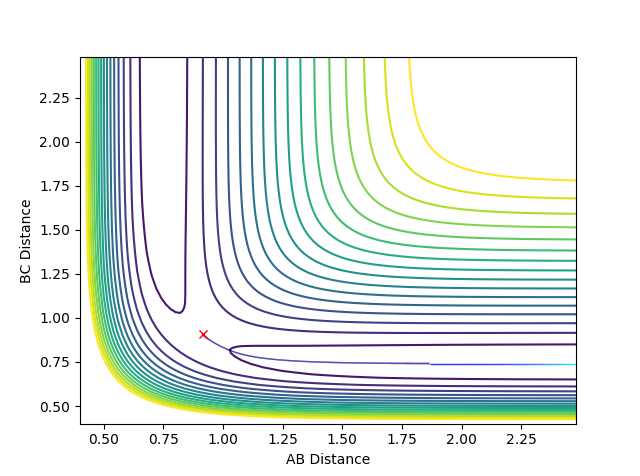
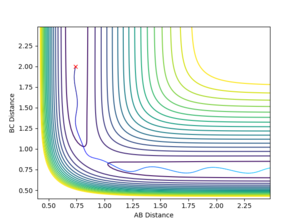
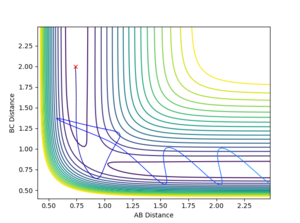
To make the system slightly displaced from the transition state, r1 was set to be 0.91777 Å (rts + 0.01) while r2 remained at the rts value of 0.90777 Å. The following contour plots were obtained using MEP and dynamics calculations respectively:
Contour plot obtained using MEP:
Contour plot obtained using dynamics:
3. Comment on how the mep and the trajectory you just calculated differ.
The MEP plot shows the trajectory as a straight line, demonstrating that the trajectory progresses along the lowest potential energy pathway. This is because after each step, the velocity is set to 0 and it does not accumulate as the reaction occurs so the system is not able to go via a higher energy reaction coordinate. However, in the dynamics plot, the trajectory oscillates, showing that the molecule vibrates. This can happen because in the dynamics calculation, the velocity accumulates as the reaction continues, and the molecule has enough energy to deviate slightly from the lowest energy pathway.
Analysis of the internuclear distances and momenta
For r1 = 0.91777 Å and r2 = 0.90777 Å:
- At large t, rAB = 9.98317239895753 Å and rBC = 0.7561648286099723 Å
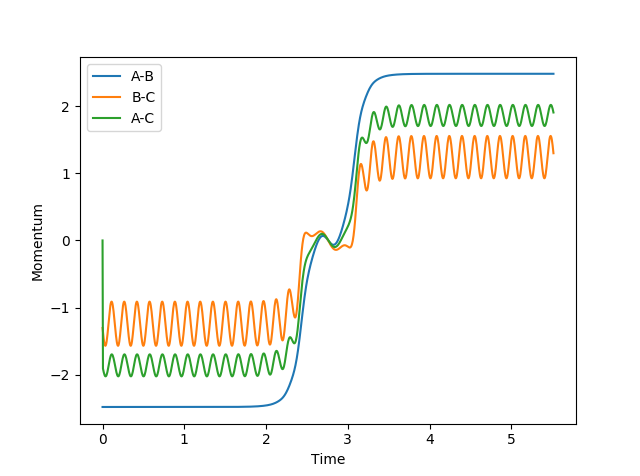
- At large t, the average AB momentum = 2.4808930094594905 and the average BC momentum = 1.304330465173753
If we had r1 = rts = 0.90777 Å and r2 = rts + 0.01 = 0.91777 Å instead, the same internuclear distances and average momenta as above were obtained, except the values for A-B and B-C were swapped. This is as expected as if you start at a point that was displaced towards the reactants, the reaction trajectory would go towards the reactants, and vice versa if you started at a point displaced towards the products.
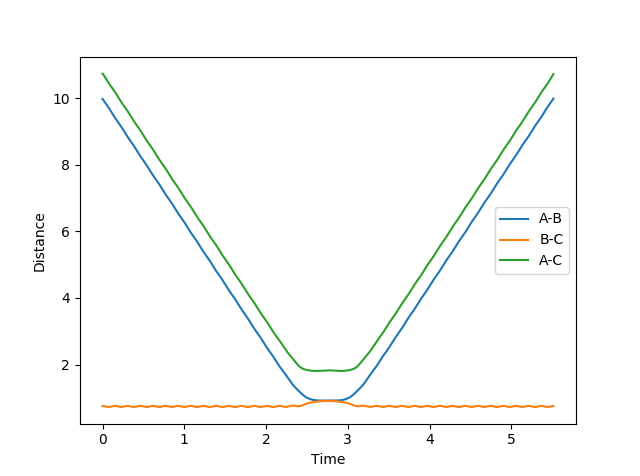
If we set the starting distances as 9.98317239895753 Å and 0.7561648286099723 Å (output distances from above) and the momenta as -2.4808930094594905 and -1.304330465173753 (negative of the output momenta from above) respectively, the following plots of internuclear distance and internuclear momentum against time is obtained. Since the momenta are reversed, the system travels back towards the transition state. At roughly 2.7s, rAB = rBC and the momenta = 0, as if the reaction was going to happen. However the trajectory travels back towards where it started, showing that a reaction did not occur, perhaps because the energy was not in the correct vibrational modes.
Reactive and Unreactive trajectories
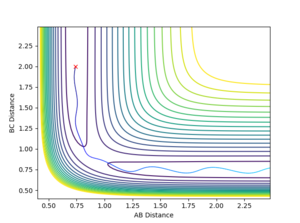
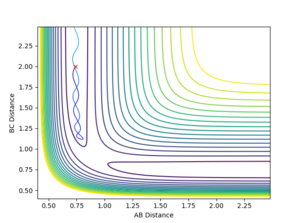

4. Complete the table by adding a column with the total energy, and another column reporting if the trajectory is reactive or unreactive. For each set of initial conditions, provide a plot of the trajectory and a small description for what happens along the trajectory.
With r1 = 0.74 Å and r2 = 2.0 Å, calculations with the following momenta values were run and the results summarised:
| Trajectory | p1 | p2 | Total Energy | Reactive? |
|---|---|---|---|---|
| 1 | -1.25 | -2.5 | -99.018 | Yes |
| 2 | -1.5 | -2.0 | -100.456 | No |
| 3 | -1.5 | -2.5 | -98.956 | Yes |
| 4 | -2.5 | -5.0 | -84.956 | No |
| 5 | -2.5 | -5.2 | -83.416 | Yes |
As seen in the contour plots for the trajectories:
- Trajectory 1: The trajectory passes through the transition state and forms products, showing a successful reaction. Atom C approaches the vibrating molecule A-B, they collide and form molecule B-C which also vibrates, while atom A moves away.
- Trajectory 2: The trajectory approaches the transition state but does not pass through it, instead doubling back towards the reactants, showing an unsuccessful reaction. Atom C does not collide with molecule A-B with sufficient energy to overcome the energy barrier so the reactants move back towards the respective directions from which they came.
- Trajectory 3: The trajectory passes through the transition state towards the products, showing a successful reaction. Atom C collides with the vibrating molecule A-B and forms products molecule B-C (also vibrating) and atom A and they move away from each other.
- Trajectory 4: The trajectory passes through the transition state region and briefly forms a new molecule, but then loops back towards the reactants, showing an unsuccessful reaction. Atom C collides with non-vibrating molecule A-B and forms a new molecule B-C via a high energy transition state. However, molecule B-C vibrates once and is quickly dissociated again, reforming A-B which vibrates strongly and atom C.
- Trajectory 5: The trajectory passes through the transition state region and doubles back towards the reactants, before going towards the products, showing a successful reaction. Atom C collides with non-vibrating molecule A-B, passes through a transition state to reform A-B, which vibrates once and dissociates, finally forming molecule B-C (strongly vibrating) and atom A.
The Main Assumptions of Transition State Theory
5. State what are the main assumptions of Transition State Theory. Given the results you have obtained, how will Transition State Theory predictions for reaction rate values compare with experimental values?
Transition state theory is based on the principles of classical statistical mechanics, where the transition state is found at the saddle point on the potential energy surface, and does not consider the microscopic picture of chemical collisions. Its main assumptions are[1]:
- The electron and nuclear motions are separated
- The reactants, as well as the transition states that are becoming products, are distributed according to the Maxwell-Boltzmann distribution
- If the system has crossed the transition state towards the product side, it cannot go backwards to reform the reactants
- The system's motion in the transition state is treated classically as a translation and can be separated from the other motions
However, as shown in trajectories 4 and 5, systems can recross the transition state and potentially reform reactants, leading to a rate constant that is much lower than transition state theory predicts. This theory also neglects quantum effects such as tunnelling, which is especially significant for reactions that involve light species like Hydrogen atoms. Finally, the theory ignores the possibility of the reaction progressing through a pathway that is not the lowest energy configuration such that the effective activation energy is higher than that predicted. Nonetheless, transition state theory is a useful estimate for rate constants and equilibrium partition functions for a wide range of chemical systems.
(Perfect! Fjs113 (talk) 22:30, 17 May 2018 (BST))
Exercise 2: F-H-F system
PES inspection
6. Classify the F + H2 and H + HF reactions according to their energetics (endothermic or exothermic). How does this relate to the bond strength of the chemical species involved?
For F + H2 -> H + HF (H-H = B-C distance), the potential energy surface indicates that the reactants are at a higher energy than the products, showing that the reaction is exothermic. For F + HF+ H2 (H-F = B-C distance), the opposite is observed, showing that the reaction is endothermic. This is as expected since the first reaction involves the breaking of a weaker H-H bond (436.0 kJ/mol[2]) to form a stronger H-F bond (568.6 kJ/mol[2]) i.e more energy is released from the formation of the product bond than was put into breaking the reactant bond, giving an overall exothermic processes.
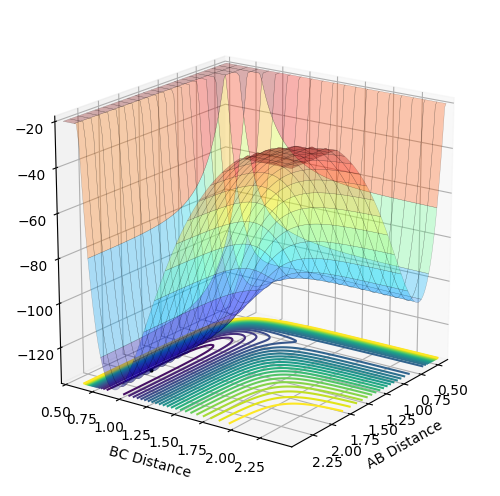
PES for F + H2 (right) and H + HF (left):
7. Locate the approximate position of the transition state.
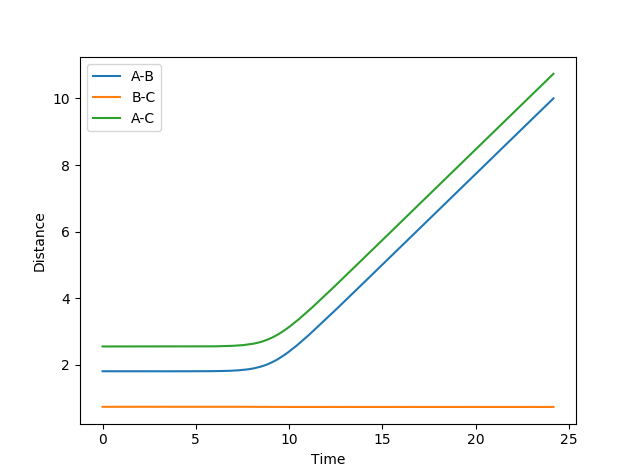
Through trial and error, the transition state was determined to be at AB = 1.8112 Å, BC = 0.7440 Å (AB and BC momenta set to 0). As can be seen in the graph of internuclear distance vs. time, the system remains at this position for nearly 10s before deviating, showing that it is a very close approximate to the transition state.
(Correct, but how did you arrive at these values? Please show some working, even if it's just an educated guess! Fjs113 (talk) 22:30, 17 May 2018 (BST))
8. Report the activation energy for both reactions.
Ea = ETS - Ereactant
The total energy of the approximated transition state is -103.752 kcal/mol. By doing an MEP calculation starting at a position slightly displaced towards the H-F (AB = 1.75 Å, BC = 0.7440 Å), the following graph of energy vs. time was obtained, giving the E(H-H) to be -103.856 kcal/mol and E(H-F) = -133.601 kcal/mol.
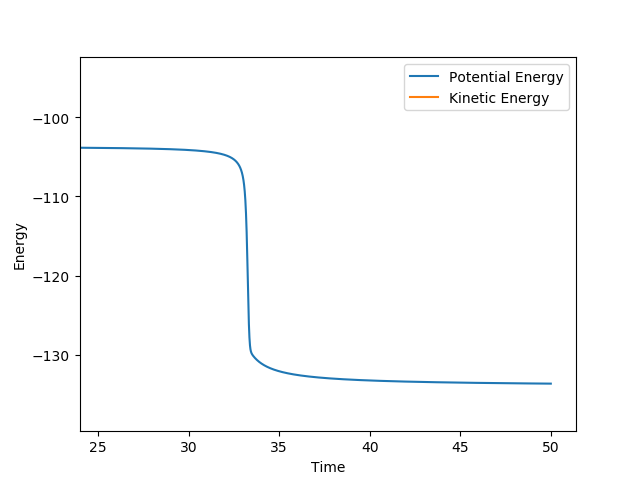
- For F + H2: Ea = -103.752 - (-103.856) = 0.104 kcal/mol
- For H + HF: Ea = -103.752 - (-133.601) = 30.081 kcal/mol
The activiation energy for the first reaction is much lower, showing that it is a more facile reaction. This is as expected since the reaction involves breaking a weaker H-H bond to form a stronger H-F bond, but the reverse reaction requires the breaking of a stronger bond to form a weaker bond.
Reaction Dynamics
H2 + F
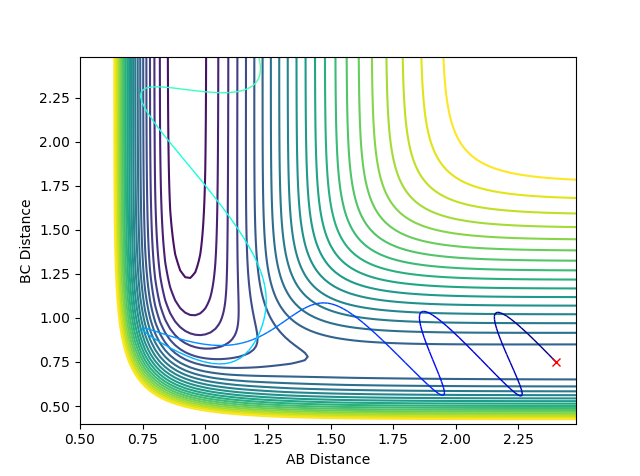
Through trial and error, the following initial conditions were found to lead to a successful reaction: rAB = 2.4 Å, rBC = 0.75 Å, pAB = -3.0, pBC = 2.99.
Contour plot for the reaction:
9. In light of the fact that energy is conserved, discuss the mechanism of release of the reaction energy. How could this be confirmed experimentally?
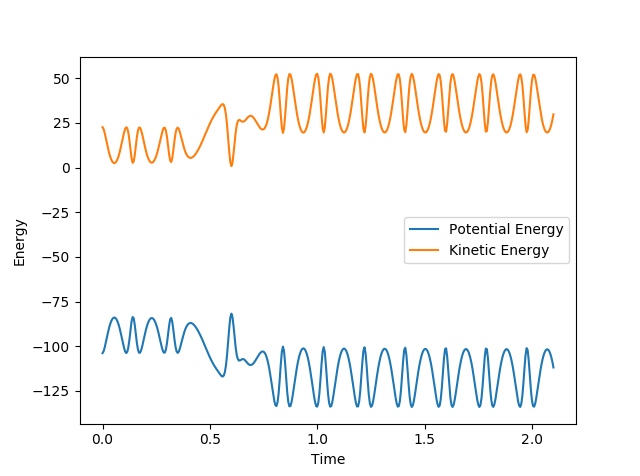
As seen in the graph of energy vs. time below, the KE increases after the system passes through the transition state at around 0.6s and the product molecule oscillates with a bigger amplitude. This is as expected since the reaction is exothermic, meaning that some of the the 'excess' energy produced is converted into the vibrational energy of the products. The PE mirrors the KE, showing that the overall energy in the system is conserved. To confirm this experimentally, we could use bomb calorimetry to measure the amount of energy released in the reaction. We can also analyse overtone bands in the IR spectrum which would be more significant for the product molecule since it has more vibrational states.
Polanyi's Empirical Rules
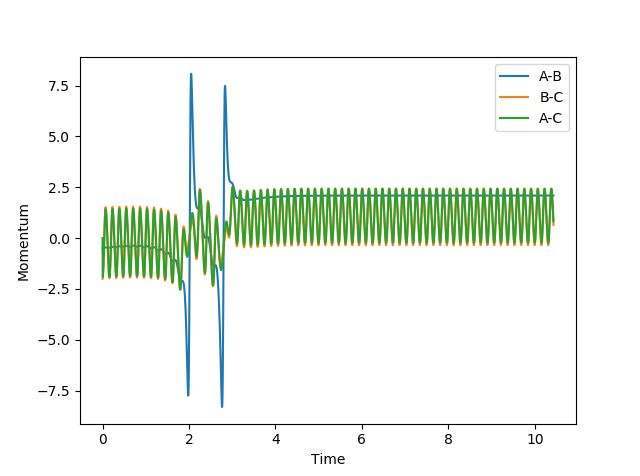
10. Discuss how the distribution of energy between different modes (translation and vibration) affect the efficiency of the reaction, and how this is influenced by the position of the transition state.
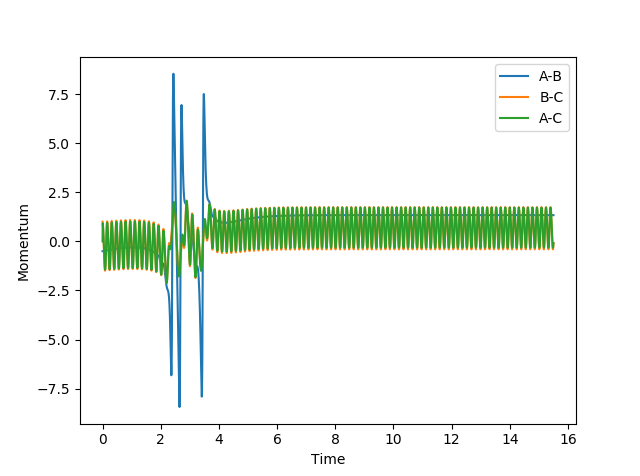
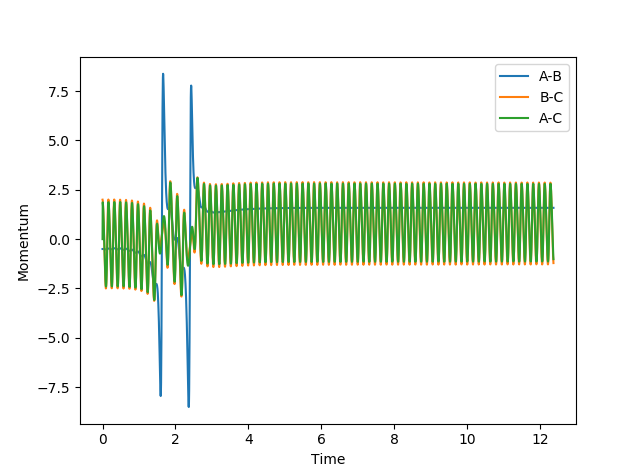
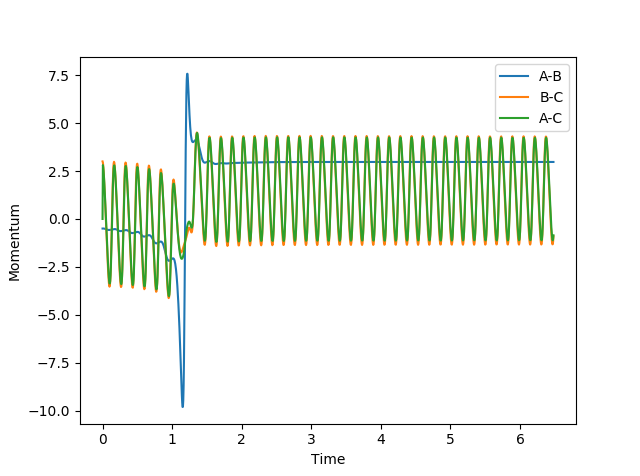
For a successful reaction, the system must have enough energy to cross the transition state. Polanyi's empirical rules state that a reaction with an early transition state (i.e in the reactant channel) is favoured by a high translational energy, whereas a reaction with a late transition state (i.e in the product channel) is favoured by high vibrational energy.[3][4] By Hammond's postulate, an exothermic reaction has an early transition state and an endothermic reaction has a late transition state.[4]
Since the F + H2 reaction is exothermic, a high translational energy (large pHF, small pHH) should lead to a successful reaction.
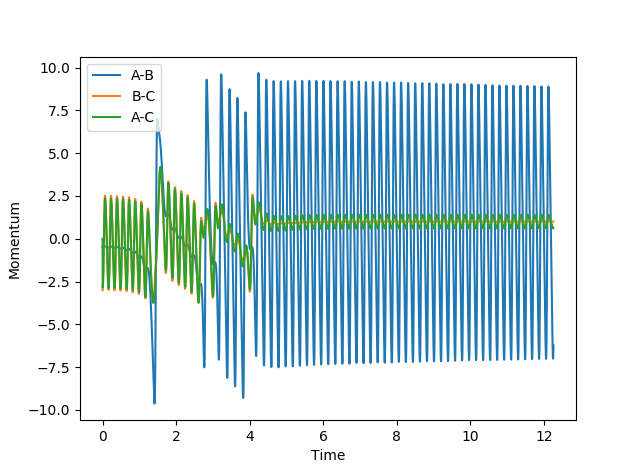
The following conditions were set up: rHH = 0.74 Å, rHF = 2.1 Å, pHF = -0.5 and -3 < pHH < 3 and the results summarised in the table:
| pHH | Contour Plot | Momentum | Reactive? |
|---|---|---|---|
| -3 | 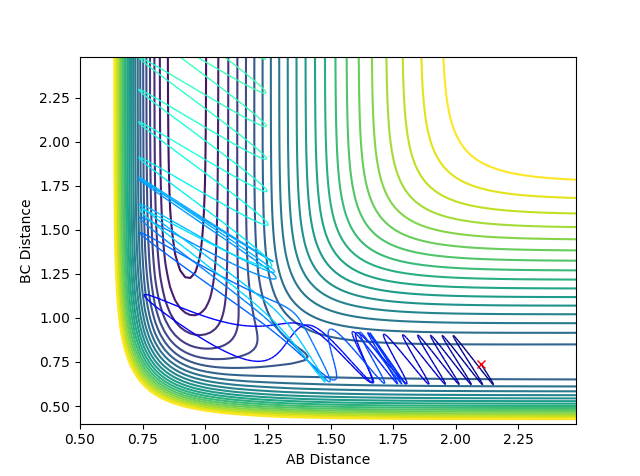 |
 |
Yes |
| -2 | 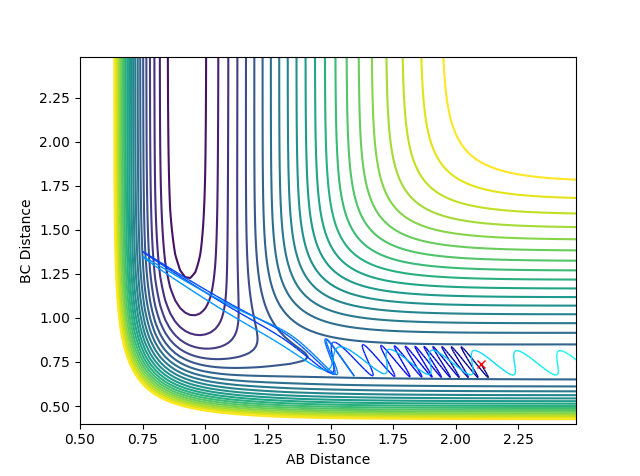 |
 |
No |
| -1 | 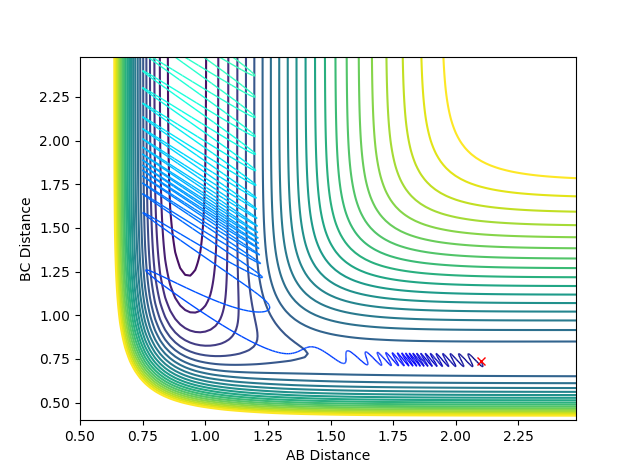 |
 |
Yes |
| 1 | 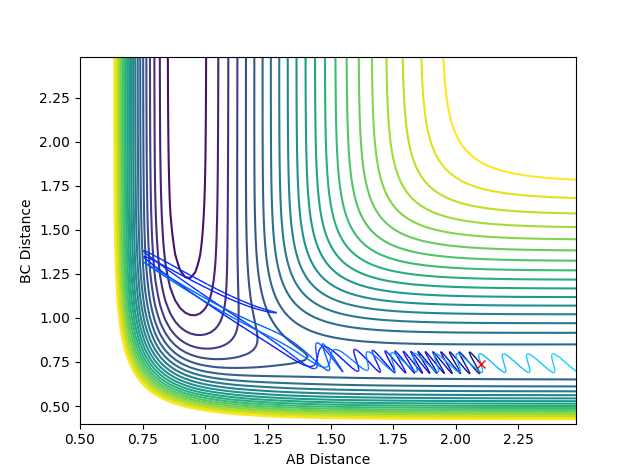 |
 |
No |
| 2 | 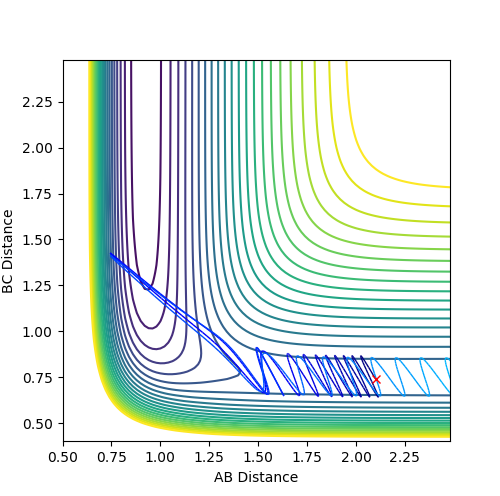 |
 |
No |
| 3 |  |
 |
No |
If we increased the translational energy slightly such that pHF = -0.8 and decreased the vibrational energy such that pHH = 0.1, the reaction was successful as seen below. This is in accordance with Polanyi's rules.
However, as seen in the first and third case in the table, the reaction can still occur if there was a high vibrational energy, showing that although it may be more favourable to have higher translational energy for this system, it is possible to surmount the energy barrier and cross over to the product channel even if the vibrational energy was larger than the translational energy.
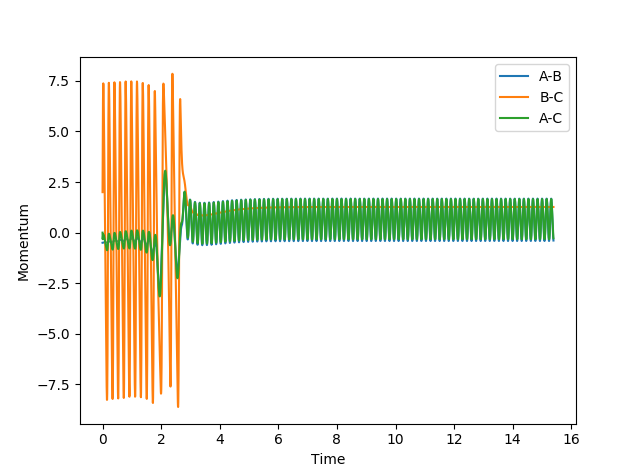
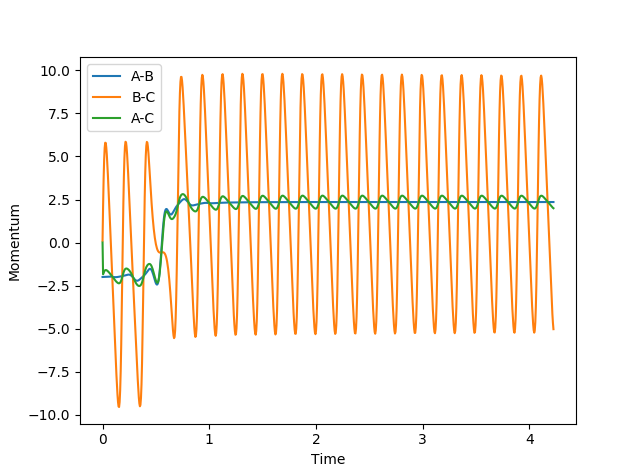
For the reverse reaction H + HF -> H2 + F, it is expected that higher vibrational energy would favour the reaction since it is endothermic. Indeed, in scenario 1 where there is a high vibrational energy, the reaction was successful, whereas in scenario 1 where there is a low vibrational energy, the reaction does not cross over the transition state successfully and instead reforms the reactants.
| Scenario | rHH | rHF | pHH | pHF | Contour Plot | Momentum | Reactive? |
|---|---|---|---|---|---|---|---|
| 1 | 2.4 | 0.75 | -0.5 | 2 | 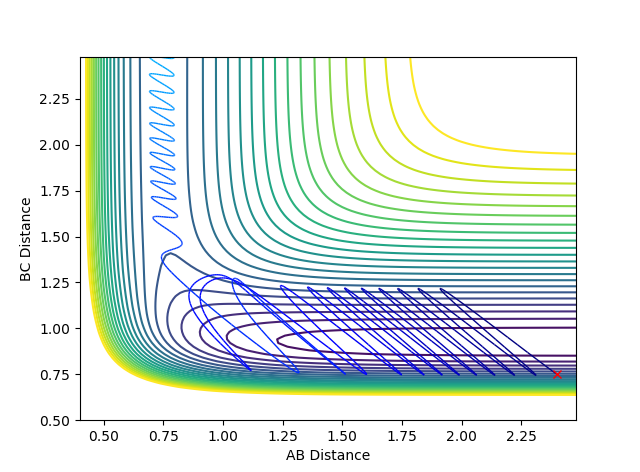 |
 |
Yes |
| 2 | 2.4 | 0.75 | -2 | 0.1 | 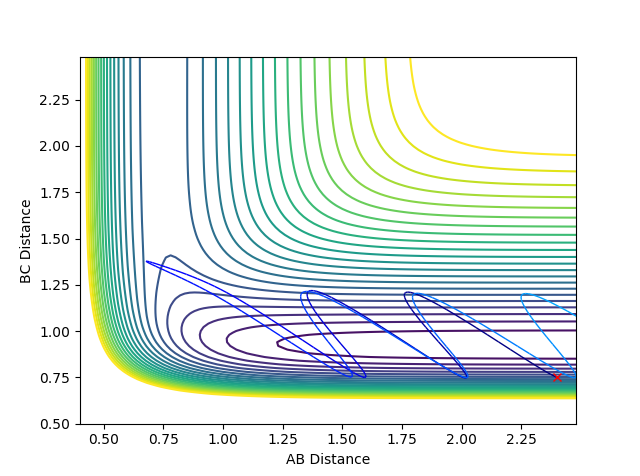 |
 |
No |
(Very good! Fjs113 (talk) 22:30, 17 May 2018 (BST))
References
- ↑ Steinfeld, J.; Francisco, J.S.; Hase, W.L. Chemical Kinetics and Dynamics; New Jersey, 1989; pp 308-337.
- ↑ 2.0 2.1 T. L. Cottrell. The Strengths of Chemical Bonds; 2d ed.; Butterworth, London, 1958
- ↑ Cite error: Invalid
<ref>tag; no text was provided for refs namedPolanyi paper - ↑ 4.0 4.1 Steinfeld, J.; Francisco, J.S.; Hase, W.L. Chemical Kinetics and Dynamics; New Jersey, 1989; pp 297-299.

