MRD:pg3518
Good report with understanding shown throughout. This could be improved with references and some more detail in a few of your answers. You included good figures to support your findings. Mys18 (talk) 03:40, 23 May 2020 (BST)
Molecular Reaction Dynamics: Applications to Triatomic systems
Exercise 1: H +H2 system
The transition state
On a potential energy surface diagram, how is the transition state mathematically defined? How can the transition state be identified, and how can it be distinguished from a local minimum of the potential energy surface?

The transition state is defined as the point with maximum energy on the minimum energy pathway of the reaction. Thus, the transition state has to be a saddle point. The saddle point is a stationary point, therefore its gradient has to equal zero. But also moving along the two different directions from the saddle point we get a local minimum in one direction and the local maximum in the direction orthogonal to the first. This means the transition state can be distinguished from the local minimum of the potential energy surface by identifying that it is also a local maximum in one of the directions.
Mathematically we could take the second derivative and find if it is >0 or <0. what would these values tell us?Mys18 (talk) 03:20, 23 May 2020 (BST)
Dynamics from the transition state region
Trajectories from r1 = r2: locating the transition state
Report your best estimate of the transition state position (rts) and explain your reasoning illustrating it with a “Internuclear Distances vs Time” plot for a relevant trajectory.
The products are identical to the reactants in the reaction of H + H2. The Hammond's postulate suggests the transition state resembles the products and the reactants equally. This means that the potential energy surface is symmetrical along rAB=rBC and the transition state lies at the local minimum of this axis. Shifting along rAB=rBC will result in vibrations, which results in sinusoidal curves instead of perfectly straight lines. The position of the transition state was then adjusted by looking at forces acting along AB and BC directions. The transition state is a stationary point. Thus, the forces should be 0 at the point. The position of the transition state for this reaction was found to be rts=90.775 ± 3 pm.
Calculating the reaction path
Comment on how the mep and the trajectory you just calculated differ.
Once the transition state was identified the minimum energy path can be calculated by slightly displacing the system (rAB=rts+1 pm, rBC=rts) with zero momentum (pAB=pBC=0 g.mol-1.pm.fs-1). The calculation type was changed from dynamic to MEP (minimum energy path), which resets the moments to zero after each step. This ensures that the system does not gain kinetic energy and does not oscillate as a consequence.
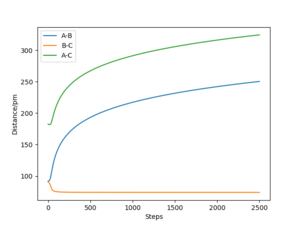
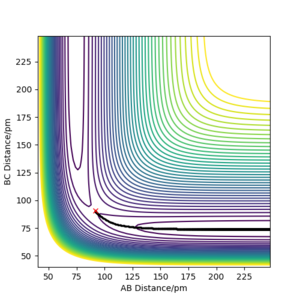
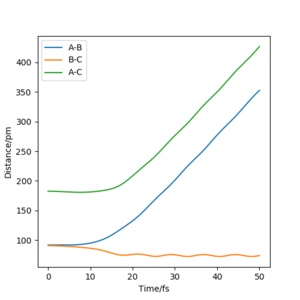
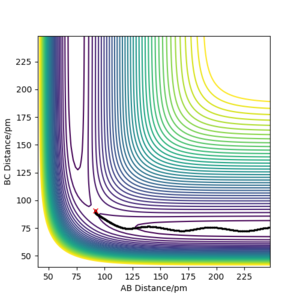
Referencing your figures below into your discussion would help with your explanation. How does the dynamic trajectory differ to MEP and why? Mys18 (talk) 03:22, 23 May 2020 (BST)
| Dynamic | MEP | |
|---|---|---|
| rAB / pm | 1113 | 232 |
| rBC / pm | 76 | 74 |
| pAB mol·fs / g·pm | 5.1 | 0 |
| pBC mol·fs / g·pm | 2.7 | 0 |
When (rAB=rts, rBC=rts +1 pm) are used as initial values for calculation of the reaction path, the result is a reflection trough mirror axis rAB=rBC of the previously calculated reaction path. This is a result of the symmetric potential energy surface. When the final position from the table above was used as the initial position in the calculation and the signs of the momentum were reversed, we can see exactly the same trajectory where the system stops at the transition state.
Reactive and unreactive trajectories
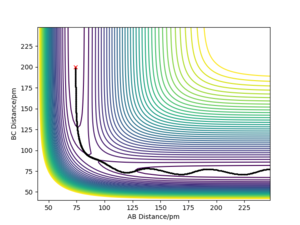
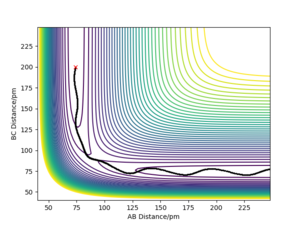
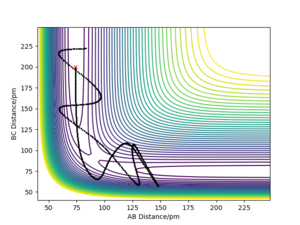
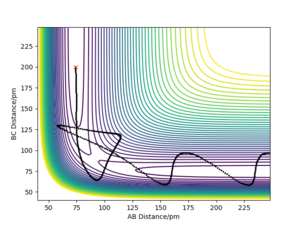
Complete the table by adding the total energy, whether the trajectory is reactive or unreactive, and provide a plot of the trajectory and a small description for what happens along the trajectory. What can you conclude from the table?
The calculations above show that the hypothesis: "All trajectories starting with the same positions but with higher values of momenta (higher kinetic energy) are reactive, as they have enough kinetic energy to overcome the activation barrier." is incorrect. The condition of having higher kinetic energy than the activation barrier to be reactive is a necessary condition, not a sufficient one.
Transition state theory
Given the results you have obtained, how will Transition State Theory predictions for reaction rate values compare with experimental values?
The Transition State Theory predicts rates of the reactions assuming the following:
- the potential energy surface is divided between reactants and products by line orthogonal to MEP at the transition state.
- all trajectories with kinetic energy along the reaction coordinate greater than the activation energy will be reactive
This approximation is very useful for the reactions at low temperatures (kinetic conditions) as only some of the molecules have efficient energy to overcome the activation barrier. As shown in the table above in example 4, sufficient kinetic energy to pass the activation barrier is not the only condition. At high temperatures, the molecules with high energy can react to form products, which then can react again to produce reactants. Furthermore, the Transition State Theory does not account for orientation and molecular geometry, which both are important factors determining the reaction rate. Therefore, we would expect the experimental reaction rates to be lower than estimated ones.
Good, we would expect TST to overestimate the rate of reaction. This can also be due to other factors. Consider the other assumptions that exist...is the transition state treated classically? I believe you have answered this in
your discussion, but another assumption states once the TS has been crossed and products have formed, it cannot be recrossed to form reactants.Mys18 (talk) 03:30, 23 May 2020 (BST)
Exercise 2: F-H-H system
PES inspection
By inspecting the potential energy surfaces, classify the F + H2 and H + HF reactions according to their energetics (endothermic or exothermic). How does this relate to the bond strength of the chemical species involved?
The reactants (atom F and molecule H-H) are much higher at the potential energy surface than products (F-H, H). This difference suggests the reaction (H2 + F → HF + H) is exothermic, releasing approximately 125.6 KJ/mol. The backward reaction (HF + H → H2 + F) is endothermic. The FH bond is much stronger than the bond in the H2 molecule.
did you calcualte this value? If not, reference please. Mys18 (talk) 03:31, 23 May 2020 (BST)
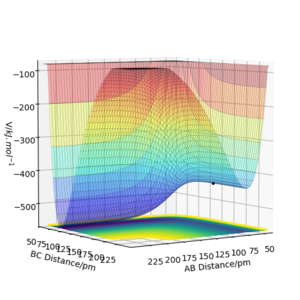
Locate the approximate position of the transition state
According to Hammond's postulate, the transition state resembles the state, which is closer in energy. This means that the transition state will be more similar to the reactants (F, and H2). In the reaction, the activation barrier is very small and the transition state is not obvious. In these calculations, the distance AB is referring to the distance between HA and HB and the BC is the distance between HB and F. The transition state was found to lie at rAB= 74.487 pm, rBC= 181.11 pm.
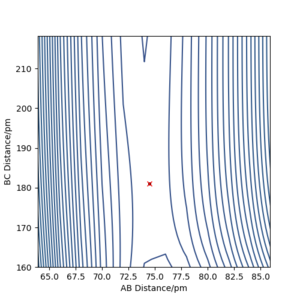
Report the activation energy for both reactions.
This was done by slightly displacing the system from the transition state and calculating MEP.
The H2 + F → HF + H reaction
This is an exothermic reaction. Therefore, the activation energy was expected to be smaller than the reverse reaction. To calculate the activation energy of this reaction, the system was moved to the direction of the reactants (in the direction of the backward reaction). The activation energy was found to be 0.7 KJ/mol.
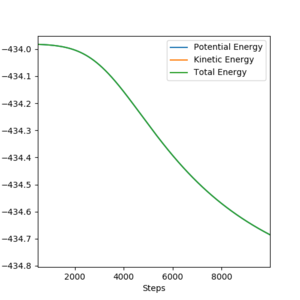
The HF + H → H2 + F reaction
This is an endothermic reaction. Therefore, the activation energy was expected to be larger than in the previous reaction. The activation energy was found to be 126 KJ/mol.

Reaction dynamics
In light of the fact that energy is conserved, discuss the mechanism of release of the reaction energy. Explain how this could be confirmed experimentally.
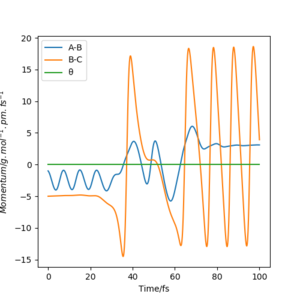
The initial conditions resulting in successful trajectory were found to be rAB= 75 pm, rBC= 225 pm, p1= -1 g.mol-1.pm.fs-1, p2= -5 g.mol-1.pm.fs-1. This is an exothermic reaction. Therefore, the energy is released, but total energy has to be conserved. The plot below shows the trajectory of this reaction. The H2 vibrates moderately while approaching the F. The FH is formed with high vibrational energy and the H was close. The H2 was reformed for a brief moment to react with F again. This time the HF was formed and did not react with H. The released energy can be observed as vibrations with high energy and large amplitude. The vibration modes can be experimentally observed by Infrared Spectroscopy and the released energy can be measured in a calorimeter.
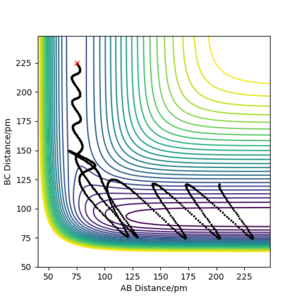
Good. Mys18 (talk) 03:33, 23 May 2020 (BST)
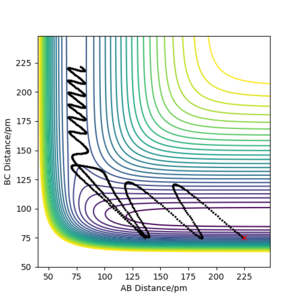
The reaction HF + H → H2 + F is endothermic. This means that in order for the reaction to be successful, we need to put a large amount of energy into the system in the form of large momentum. The initial conditions for the reaction shown below are: rAB= 225 pm, rBC= 75 pm, p1= -4 g.mol-1.pm.fs-1, p2= -1 g.mol-1.pm.fs-1
Discuss how the distribution of energy between different modes (translation and vibration) affect the efficiency of the reaction, and how this is influenced by the position of the transition state.
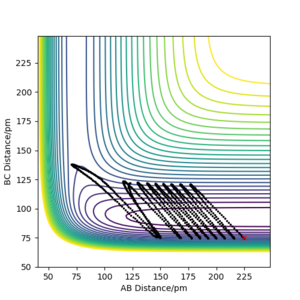
Polanyi's empirical rules stats that translational energy is better than vibrational energy at promoting the reaction with an early transition state (exothermic reaction) and vise versa. These rules were confirmed to be useful by examining HF + H → H2 + F reaction with the same initial position rAB= 225 pm, rBC= 75 pm but different momentum.

Excellent, good supporting figures. Mys18 (talk) 03:34, 23 May 2020 (BST)

