MRD:oop17
Molecular Reaction Dynamics Report: Oana Popescu
Exercise 1
On a potential energy surface diagram, how is the transition state mathematically defined? How can the transition state be identified, and how can it be distinguished from a local minimum of the potential energy surface?
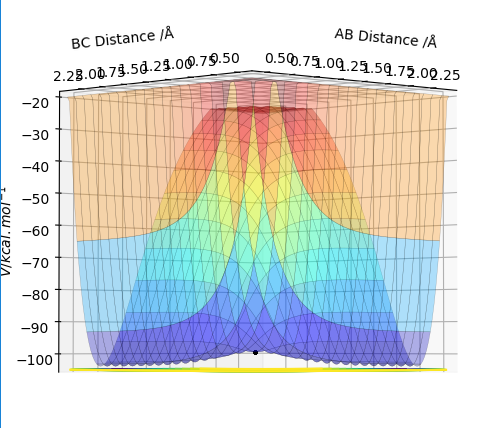
The transition state is defined as being the maximum point on the path of minimum energy. Furthermore, on a 3-dimensional plot of internuclear distance against energy, at the transition state the potential gradient is zero, with the energy decreasing in both directions on the minimum energy path. Thus, the point of the transition state forms a local maximum of zero gradient, whilst being a minimum on the overall potential energy surface - corresponding to the fact that it is on the minimum energy path. This can be visualized on a three-dimensional plot, in (Fig. 1.)
It would help to define the TS mathematically, describing that the transition state has a positive second derivative of energy with respect to internuclear distance in one direction but a negative second derivative in the other. Also you should compare it to a local minimum. Overall this answer is not very clear. Pu12 (talk) 23:32, 30 May 2019 (BST)
Transition State
Report your best estimate of the transition state position (rts) and explain your reasoning illustrating it with a “Internuclear Distances vs Time” plot for a relevant trajectory.
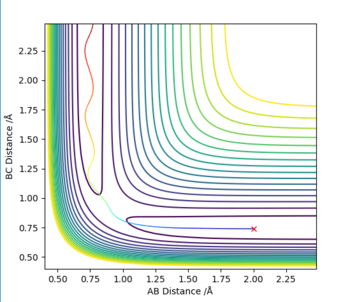
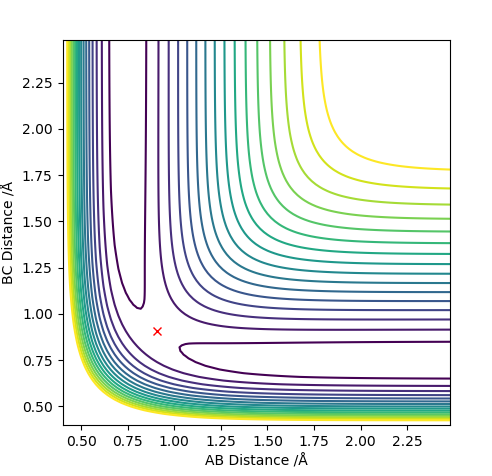
The initial estimate was made by setting p1=p2=0, then continuously changing the internuclear distance (r1=r2) until the Dynamic graph plot appeared as a dot rather than a line. This happened at around r1=r2=0.9 (Fig. 2)
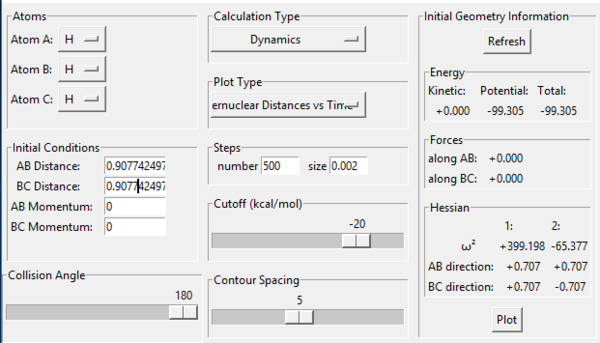
This was a highly rough estimate, and zooming in it could still be seen that the graph was a line. The Transition State was then further narrowed down using the energy values given under “Initial Geometry Information”; the Transition State is the point where the forces along AB and BC as well as the Kinetic Energy should all be zero. Through trial-and-error, this was pinpointed at r1=r2= 0.907742497 (Fig. 3).
The Internuclear Distances vs. time plot at this point is two straight lines, with the A-B (r1) line being invisible (Fig. 4);

This suggests it perfectly overlaps with one of the other lines, namely B-C (r2), and the straight-line nature suggests the molecule is at a point of balance, as neither distance is increasing or decreasing. Both facts suggest the transition state has been deduced correctly. good. Pu12 (talk) 23:32, 30 May 2019 (BST)
MEP Calculations
Comment on how the mep and the trajectory you just calculated (Dynamic Trajectory) differ.
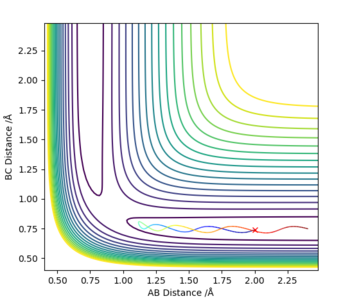
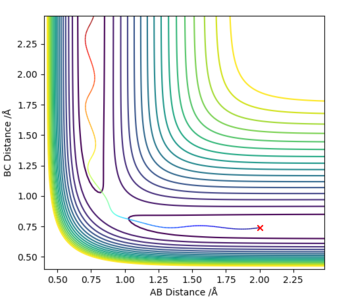
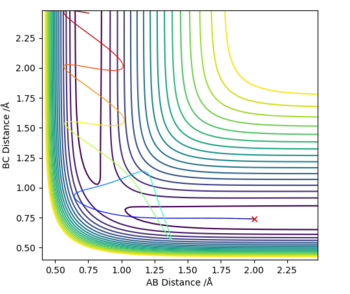
On a contour plot, it can be seen that the Dynamic calculation results in a sine-like wave along the Minimum Energy path, whilst the MEP calculation only gives a straight line (Fig. 5, 6).
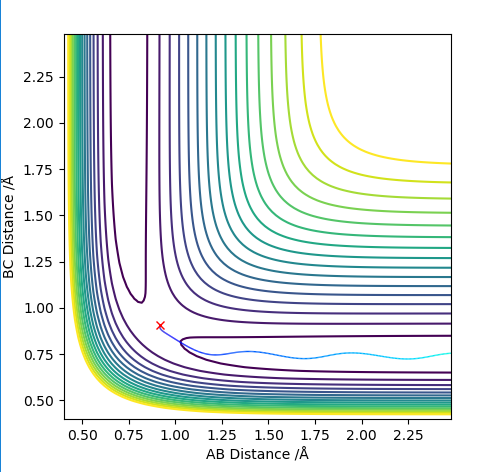
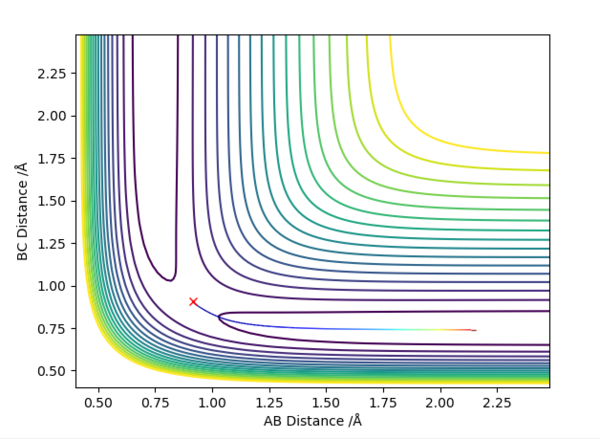
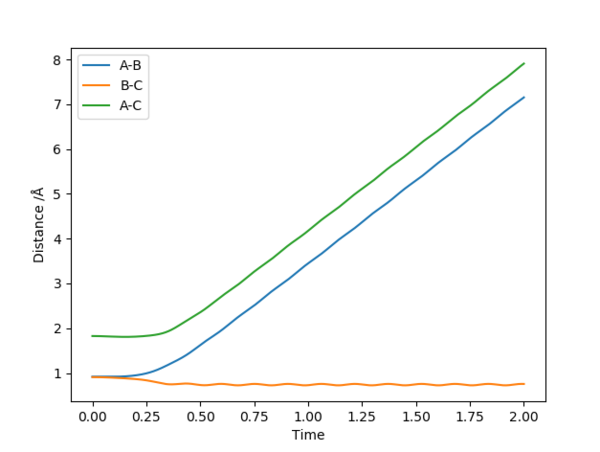
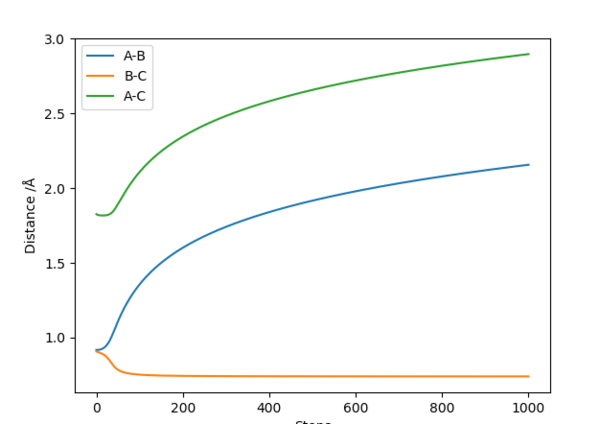
On a distance-time plot, however, the difference becomes more apparent ( Fig. 7, 8); starting from the Transition state, where the distances A-B and B-C are equal, both graphs show a decrease in distance B-C (the newly formed bond), and an increase in both A-C and A-B as molecule A moves further away. However, on the Dynamics plot B-C is once again shown as a sinusoidal wave, with A-B and A-C becoming straight lines after an adjustment period; on the MEP plot, B-C is a smooth line, with A-B and A-C nearing a plateau. This is due to the MEP plot not containing kinetic energies, whilst the Dynamics plot factors it; the wavy line is due to molecular vibrations, which are not present in the MEP calculations.
If the values of r1 and r2 are reversed, the trajectory is reversed when viewed on a contour plot; that is, it begins at the transition state but r2 is the one that varies, whilst r1 remains constant. Other than that, there are no notable changes.
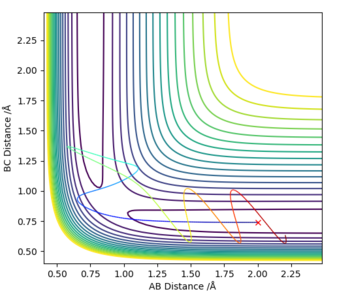
Table 1 - Completed table of molecule trajectories for different initial momenta. For the table below: r1=BC distance=0.74; r2=AB distance=2.0; p1=BC momentum; p2=AB momentum.
The table demonstrates that higher energy does not necessarily mean better chances of a successful collision; this is illustrated in the second to last example, where there is a higher amount of momentum in the system than before, yet the collision is unsuccessful.
State what are the main assumptions of Transition State Theory. Given the results you have obtained, how will Transition State Theory predictions for reaction rate values compare with experimental values?
The transition state theory is a model used to describe the energy pathway of a reaction via an intermediate state; this is the energetically highest point of the pathway, and is known as the transition state. The model can be used to calculate a rate constant for the transformation of reactants into products. However, it is purely statistical, not taking into account individual collision details. [1] There are several assumptions required for the model:[1]
1. The nuclear and electronic motions are completely independent and do not affect each other (Born-Oppenheimer Approximation)
2. The reactant molecules have a Maxwell-Boltzmann Distribution of Energy;
3. Once the transition state is crossed, the molecule will become a product and will not turn back;
4. The reactants are in thermal equilibrium with the reaction state;
5. Motion along the reaction coordinate in the Transition State can be treated as an independent translation separate from all other motions.
In the Transition State Theory, the rate of reaction is equal to the rate at which molecules pass through the transition state [1]. However, experimentally this is not always the case; an example is the second-to-last set of conditions in Table 1, where the reactants cross the Transition State Barrier and then return to reactant state. Such recrossings occur due to the above approximations not always being correct (eg. the Born-Oppenheimer approximation not applying); thus, the experimental rate of reaction is smaller than the flux of particles across the transition state. Due to this, the Transition State theory provides the upper boundary of the rate of reaction, which is usually experimentally lower [1]. good. Pu12 (talk) 23:32, 30 May 2019 (BST)
Exercise 2
PES Inspection
By inspecting the potential energy surfaces, classify the F + H2 and H + HF reactions according to their energetics (endothermic or exothermic). How does this relate to the bond strength of the chemical species involved?
The reactions can be considered the forward and backward reactions of the same system; the forming of an F-H bond by the breaking of an H-H bond, and the forming of an H-H bond by the breaking of an F-H bond. It can immediately be deduced that the F-H bond is much stronger than H-H, as fluorine is highly electronegative and so the bond would have a very high ionic character. Thus, it can be easily extrapolated that the F+H2 reaction would be exothermic, whilst its reverse has to be endothermic. This can also be seen through the energy surfaces, as shown in Fig. 9 and 10. This can also be deduced through the very high momentum values (and short H-H distance) necessary to get HF to react with H, as opposed to the relatively low values for F to react with H2, indicating much more energy needs to be put in to break the H-F bond.
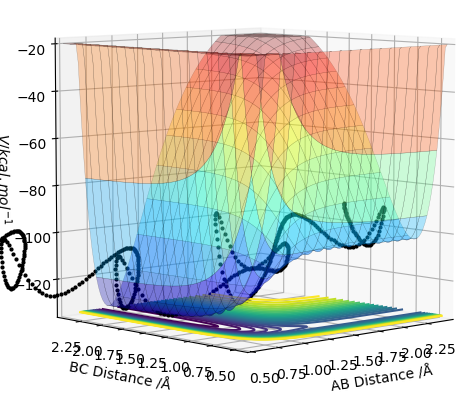
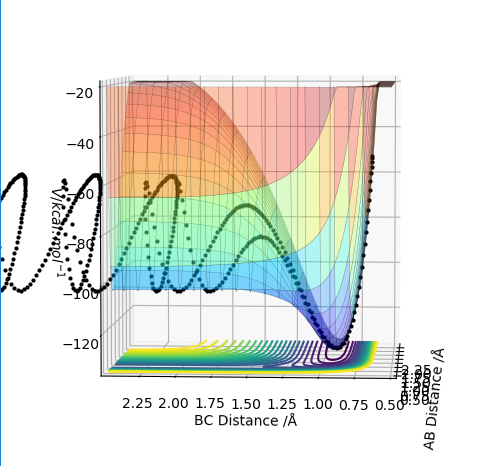
This corresponds to literature; the F+H2 reaction is one of the simplest exothermic reactions, often used as a model for such systems. [1]
Locate the approximate position of the transition state.
As in the previous exercise, both momenta for the F-H-H system were set to zero, and the distances at which both molecules had forces 0, as well as overall kinetic force 0, were indentified. This was harder than before, as the molecules were irregular and so the bond lengths were not the same. Through repeated Trial-and-Error, the transition state was deduced to be at an F-H distance of 1.810760, and an H-H distance of 0.7448785. Correct, a distance vs time plot would help as in the previous question asking for the TS. Pu12 (talk) 23:32, 30 May 2019 (BST)
Report the activation energy for both reactions.
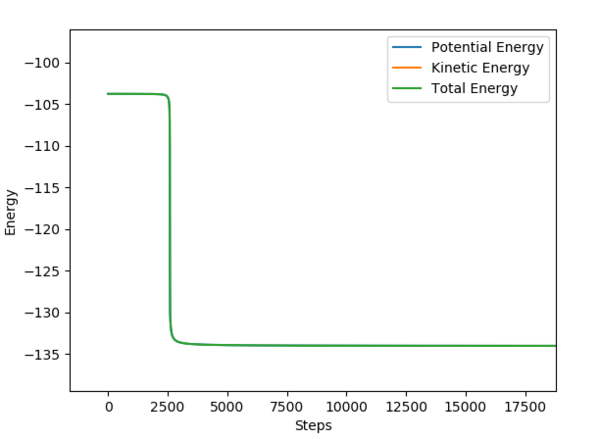
An MEP calculation was performed using the previously determined Transition State distances. The F-H distance was changed by +0.01 to calculate the activation energy of the forward reaction (F+HH), and by -0.01 for the reverse reaction (H+HF). The activation energies were determined from the Energy vs Time plots, as shown in Fig. 9 and 10.
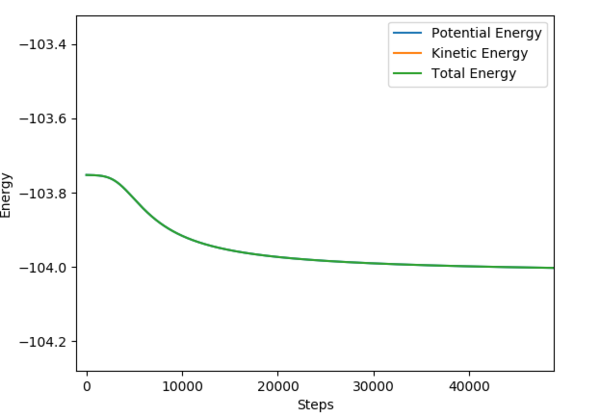
F + H-H i: -103.756 f:-104.002
Ea: 0.246 kcal/mol
H + H-F i: -103.658 f: -133.888
Ea: 30.23 kcal/mol
It can be seen that the activation energy for the reverse reaction is bigger by a magnitude of almost 100; this corresponds to the F-H bond being much stronger and harder to break than the H-H bond.
Identify a set of initial conditions that results in a reactive trajectory for the F + H2, and look at the “Animation” and “Momenta vs Time”. In light of the fact that energy is conserved, discuss the mechanism of release of the reaction energy. Explain how this could be confirmed experimentally.
The following conditions were identified as being a reactive trajectory:
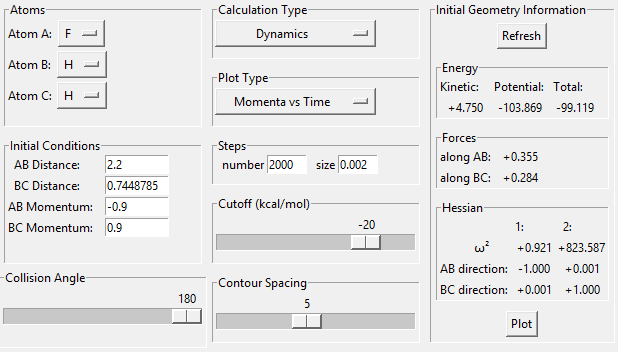
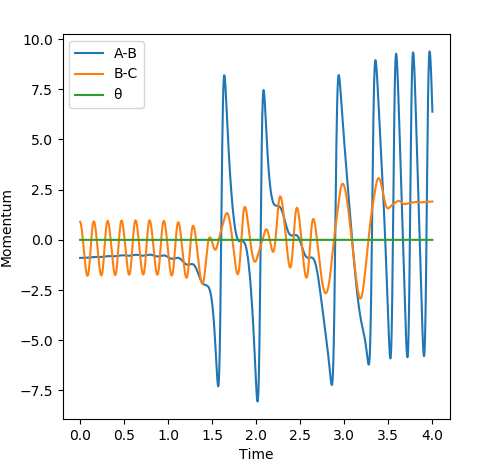
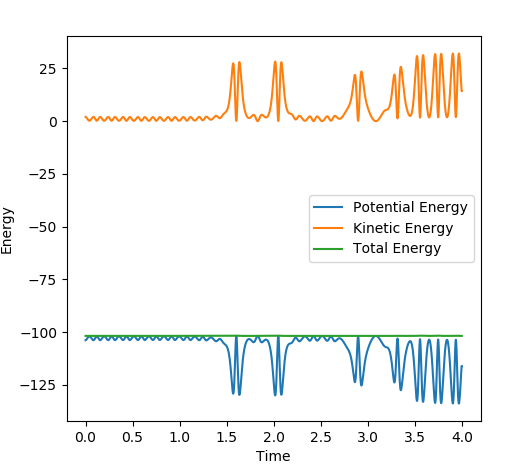
On the momentum-time graph, ( Fig. 13 ), the area of reaction can clearly be seen. The regular vibrations on the left side of the graph correspond to the H-H molecule before it has reacted; the vibrations of the newly-formed H-F bond can be seen on the right. The vibrational energy of the H-F bond is much bigger than that of the H-H bond, as can be seen by the larger oscillations. The energy-time graph ( Fig. 14 ) indicates that, on average, the H-F molecule has much higher kinetic energy than the H-H molecule. Thus, it can be assumed that the reaction energy is released in the form of vibrational energy. Experimentally, this could be confirmed through spectroscopy; as the vibration is assymetrical, an IR spectrum could show the intensity of the vibrational motion for different particles, and how it changes.
Good. Calorimetry could also be used as it would be simpler because it just measures heat output, the vibrations will be detectable as heat. Pu12 (talk) 23:32, 30 May 2019 (BST)
Discuss how the distribution of energy between different modes (translation and vibration) affect the efficiency of the reaction, and how this is influenced by the position of the transition state.
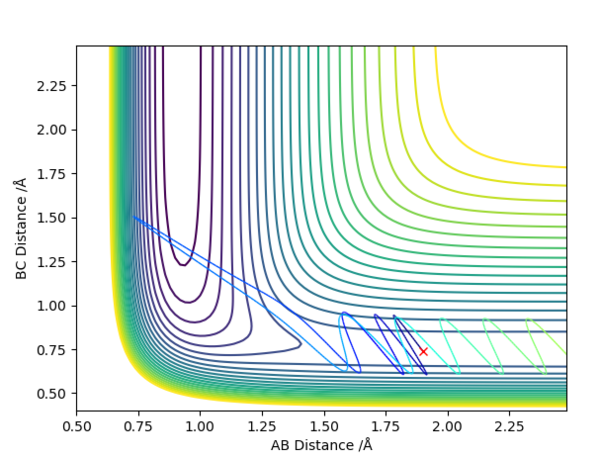
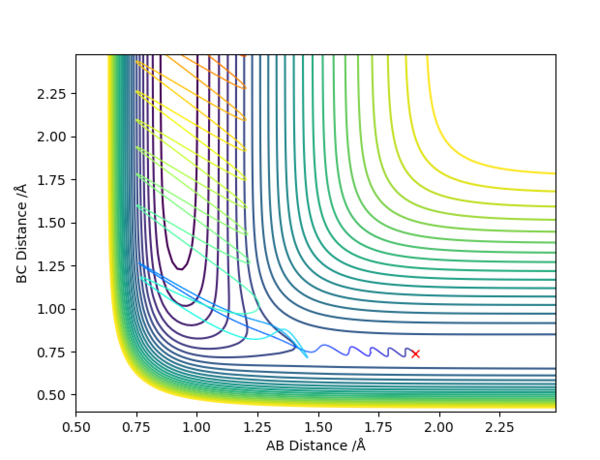
The F + H-H reaction was set up with initial conditions of H-H distance = 0.74, F-H distance = 1.9, F-H momentum = -0.5. After adjusting the value for the H-H momentum, it can be seen that an increase in it does not necessarily correlate with a successful reaction; a momentum of 3 results in an unsuccessful collision. This shows that increasing the H-H vibrational momentum does not result in a higher chance of reaction. However, one the F-H translational momentum was increased by only a slight 0.2, the molecules reacted, even though the overall energy was greatly reduced; this suggests the translational energy to be much more important than the initial molecular vibration energy in determining whether a collision is successful or not.
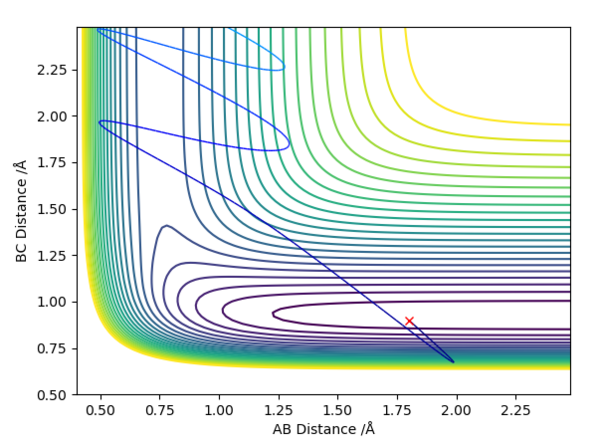
The reaction was reversed so that it was H reacting with F-H (H-H distance = 1.8, F-H distance = 0.9). Through trial and error, reactive conditions were found at an F-H vibrational momentum of -13, and an H-H translational momentum of -1. These are the opposite conditions to above; the vibrational energy of the initial molecule is incredibly high, with the translational momentum being very low. Decreasing the vibrational energy to almost anything lower will not result in a reaction.
Although they seem to demonstrate opposite trends, both results are in line with Polanyi's rules. The principle states that the preferred amounts of momentum depend on the position of the transition state; if it is close to the reactants, then a high amount of translational energy and very little vibrational energy is preferred. If the opposite is true, then a very high amount of molecular vibrational energy will surmount the transition state.[1]
In the F-H-H system, the transition state is close in energy to the H-H molecule. For the forward reaction - F + H-H - this is near the reactants, meaning that high translational energy is preferred, or in this case a high p(F-H). For the reverse reaction, the opposite is true; the transition state is now far from the reactants, meaning that a large amount of vibrational energy is needed to surmount it, once again favouring a high p(F-H).
This relationship can be illustrated on the Dynamic graphs below. When the Transition state is towards the reactants, it is located in the horizontal low energy path, in which the molecule travels to the left towards the products; translational motion moves horizontally and thus past the transition state, whilst vibrational motion only moves up and down, thus being unnecessary. When the transition state is towards the products, it is located in the vertical area of low energy, where the initial molecule's vibrational motion, illustrated as "up-down", is useful to get the molecule to overcome the transition state through the path of lowest energy.
good. Pu12 (talk) 23:32, 30 May 2019 (BST)
Well done overall. Pu12 (talk) 23:32, 30 May 2019 (BST)
Bibliography
<references> <ref name="ref">J. I. Steinfeld, J. S. Francisco and W. L. Hase, Chemical kinetics and dynamics, Prentice Hall, Englewood Cliffs, NJ, 1989. Pages 299, 308, 311, 329 <\ref>

