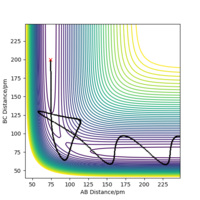
MRD:ohoyoureapproachingme
Exercise 1 H+H2:
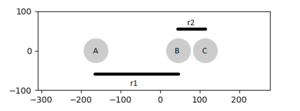
In this system, we are simulating if an atom and a diatomic were to collide and by varying the bond distance and atom momenta to see if they would react. The simplest system would be a hydrogen atom colliding with a hydrogen molecule.
 |
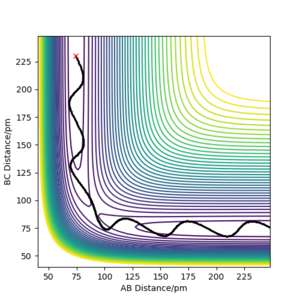 |
| Initial position(pm): | Initial momenta(g.mol-1.pm.fs-1): |
| rAB: 74 | 0 |
| rBC: 230 | -5.2 |
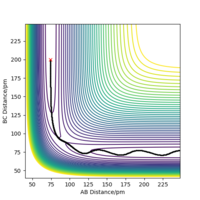
From figure 2, we can see that the reaction was successful as the original molecule bond, rAB has increased and broken while the new molecule bond rBC has decreased and formed.
Transition state is mathematically defined as a point at which the function graphing the point has a derivative dV.(dri/dri) equal to 0. It can be identified by being a maxima on a minimum energy pathway, also a Hessian second derivative of the function can be taken and if less than 0, is shown to be a maxima and the transition state.The transition state is both a maximum and a minimum, just in orthoganal directions. How would you distinguish it from a local minimum? Pu12 (talk) 16:04, 23 May 2020 (BST)
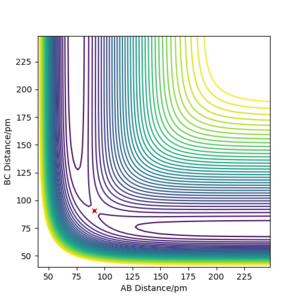
For a symmetrical system like H + H2, the transition state occurs when rAB = rBC shown in figure 3, in this case the transition state occurs when AB distance is 90.8 pm Correct Pu12 (talk) 16:04, 23 May 2020 (BST)
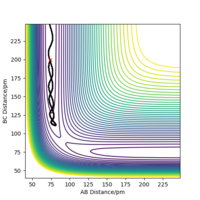
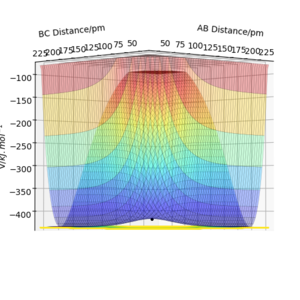
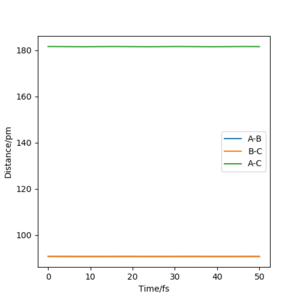
with a total energy of -415.38 kJ.mol-1 found in figure 4. Evidence to suggest this can be found in figure 5 and 6, figure 5 is a PES plot of the system with the co-ordinate placed on the peak of the minimum energy pathway and figure 6 shows that the distances have remained constant indicating little to no vibrations are occurring. This shows that at these bond lengths, there isn't a lower energy state that the system can tend to.
| Transition state plots | |||
|---|---|---|---|
 |
 |
 |
 |
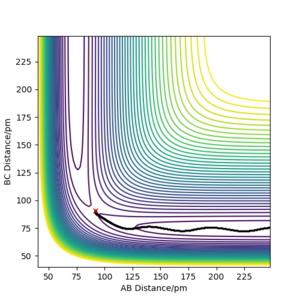
From the transition state being known, the minimal energy pathway can be found by using a MEP calculation at transition state bond distances and momenta set to 0, this calculation would set the momenta of the atoms to be 0 at every time step, resulting in an infinitely slow reaction, figure 7 was found by offsetting the distance AB by 1 pm from the transition state distance and let occur for 500 seconds Most certainly these are not seconds. João (talk) 10:14, 14 June 2020 (BST) . Comparing a dynamic calculation with identical conditions of figure 8, it shows that the molecule H2 is vibrating due to the trajectory moving sideways relative to the contours parallel to it.
| MEP calculation | Dynamic calculation |
|---|---|
 |
 |
With distance rAB set at 74 pm and rBC set at 200 pm and varying the momenta the following table is found.
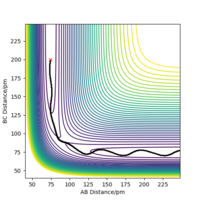
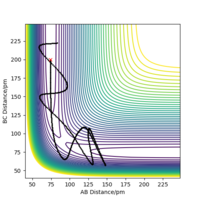
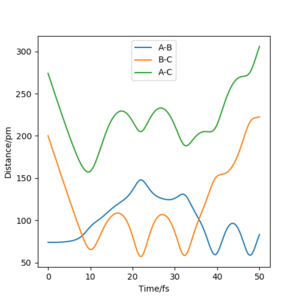
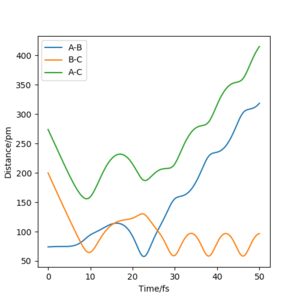
You should comment on the trajectory more, there is no reference to a change in vibration between reactants and products. Pu12 (talk) 16:04, 23 May 2020 (BST) From the table, it can be found that from comparing momenta Set 1 and Set 2, that the reaction requires a certain amount of energy in order to make it to the transition state and possibly form products, as shown in Set 3 where the total energy is around -414 kJ.mol-1 allows the reaction to occur. Set 4 shows that too much energy would allow the products to react again and forming the transition state for a second time and reverse the reaction to form the reagents. Set 5 has enough energy to form the transition state 3 times, from figure 14 and 15, any point when the distance AB is equal to BC shows that the transition state has been reached.
| Inter-nuclear distance over time: | |
|---|---|
 |
 |
Transition State Theory will overestimate the rate of reaction compared to the experimentally calculated rate of reaction due to the theory assuming that all trajectories that make it past the transition state will end up as products, which is then shown in set 4 which did have enough energy to make it to the transition state but the trajectory wasn't reactive. Correct Pu12 (talk) 16:04, 23 May 2020 (BST)
Exercise 2 H + HF and F + H2:
 |
 |
 |
 |
 |
 |
 |
 |
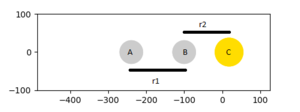
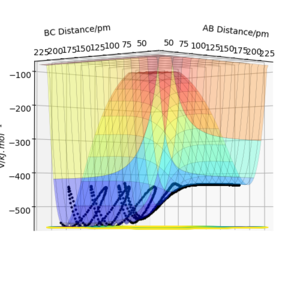
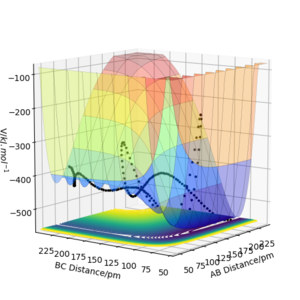
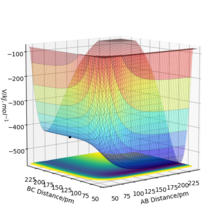
From the PES plots of figure and 18 and 19 the molecule bond has been assigned BC and the bond to be made is assigned AB. Figure 18 shows the reaction is exothermic, the reactants are at a higher energy state than that of the products. Figure 19 shows the reaction is endothermic as reactants are at a lower energy state than the products. Comparing these figures, we can see that the H-F bond is much stronger than the H-H bond as the reaction which involves breaking a H-F bond is very high energy. Figure 20 and 21 shows the respective transition states, the H-H is much weaker than H-F as F is nearly 200 pm away at the transition state while the H-H bond length is near 75 pm. The transition state co-ordinates have been found to be: F-H1 rts = 181.15 pm, H1-H2 rts = 74.2 pm with total energy -433.97 kJ.mol-1. Correct. Pu12 (talk) 23:48, 10 June 2020 (BST)
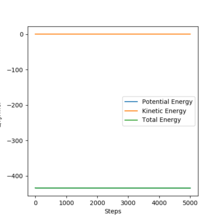
The activation energy of a reaction can be found by the difference in energy between the transition state and the initial energy of the reactants. By doing a MEP calculation between the transition state and initial energy and plotting the energy over time is shown in Figure 22 and 23. Initial energies were found by getting last geometry after 5000 steps of 0.1 fs. Initial energy of reactants in F + H2 = -434.71 kJ.mol-1 with activation energy of F + H2 = 0.74 kJ.mol-1. Initial energy of reactants in H + HF = -560.31 kJ.mol-1 activation energy of H + HF = 125.6 kJ.mol-1.
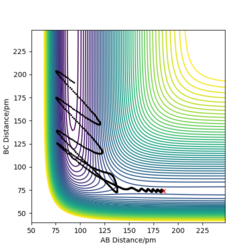
Figure 24 shows a reactive F + H2 trajectory with minimal momenta (pAB = -1 g.mol-1.pm.fs-1, pBC = 0 g.mol-1.pm.fs-1 ) to push the reaction to completion. Once the reaction reaches the transition state and passes it, the products are vibrating wildly, gaining large amount of vibrational energy from H2 translation energy. To find the energy of the reaction that produce heat a bomb calorimeter can be used to find the temperature difference of a solution with a known heat capacity and calculate the energy given off as heat. However translational and vibrational energy can't be distinguished by using a calorimeter, as translational energy is heat and excited vibration states that relax would emit IR photons. So producing IR spectra of the reactants and products allows us to determine the contribution of vibrational energy to the total energy. As H2 is a symmetrical and non polar molecule, it isn't IR and there is no change in dipole, HF is asymmetrical and polar thus IR active.
As energy is conserved, taking an IR spectrum before and after the reaction, the IR spectrum before the reaction should show only a very low intensity peak at ~3980 cm-1[1] while the IR spectrum after the reaction should show a strongly intense peak at ~3300 cm-1[2]. As the system before had very little vibrational energy and after the reaction occured, excited states of HF can then emit photons associated with the energy difference of the first excited state and the vibration ground state.
Polanyi's emperical rules[3] states that the vibrational energy promotes the formation of products where the it has a late transition state that already resembles the products more than the translational energy of the system. The opposite is true when the reaction has an early transition state that resembles the reactants. Polanyi states there are two types of energy barriers, type 1 is a barrier that occurs later in the reaction and type 2 is a barrier that occurs earlier in the reaction. Thus he said type 1 is easily traversed by reagent vibration while type 2 is traversed by reagent translation. Good, but could use some examples from the simulations to illustrate this. Pu12 (talk) 19:17, 11 June 2020 (BST)
A study by Z. Zhang et al[4]. has shown that while the rules hold true for many atom and diatomic systems, for a reaction that should follow the rules found that the vibration of a C-H bond would have no effect in promoting the formation of products. This reaction of Cl + CHD3 to form HCl + CD3 was picked due to simulations showing a late transition state, a type 1 energy barrier. The simulations showed that the rules has worked except at low energy collisions.

