MRD:nw3817
Questions from script:
Exercise 1
- On a potential energy surface diagram, how is the transition state mathematically defined? How can the transition state be identified, and how can it be distinguished from a local minimum of the potential energy surface?
Transition points are the point of maximum potential along the reaction path, the reaction path being the path of least potential energy from the reactants to the products. The transition state is thus a saddle point, being a maximum in one direction (the reaction path) and a minimum in the perpendicular direction. Mathematically, this means that it is a point where the first derivative of the potential is 0 in both the plane of the reaction path and the orthogonal plane. The second derivative of the potential in the plane of the reaction path will be negative representing a maximum point in this plane, while the second derivative in the orthogonal plane will be positive, indicating that the point is a minimum in this plane. The TS is different from a local minimum in that a local minimum (such as the reactants or products) in that local minima will be a minimum point in both the plane of the reaction path and the orthogonal plane. The first derivitive in both planes will be 0 and the second derivative in both planes will be positive. Good explanation. Also it's the second partial derivative. Sf3014 (talk) 22:54, 14 May 2019 (BST)
- Report your best estimate of the transition state position (rts) and explain your reasoning illustrating it with a “Internuclear Distances vs Time” plot for a relevant trajectory.
The transition state position can be calculated by inspecting the internuclear distance vs time graph of a collision where a reaction takes place like the conditions set up in the script (r1=0.74, r2=2.3, p1=0, p2=-2.7)
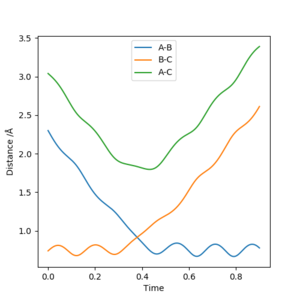
Upon inspecting the graph the intersection of the A-B distance and the B-C distance occurs at the TS position. Reading from the graph this is a distance of approximately 0.917 angstroms.
To confirm this, r1 and r2 were set to 0.917, with both initial momenta set to 0 and the internuclear distance vs time graph was taken
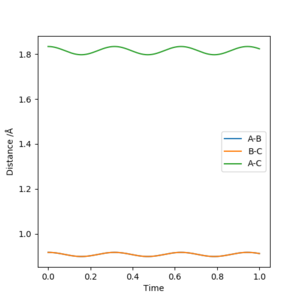
Very little oscillation in r1 and r2 shows that this is a relatively accurate estimate of the transition state position. Well done, but another thing to note is that the oscillation is about a constant point ie the distance is constant. Sf3014 (talk) 23:01, 14 May 2019 (BST)
- Comment on how the mep and the trajectory you just calculated differ.
Both go to the same product, but the mep plot is goes straight down the minimum potential valley, whereas the trajectory plot shows the oscillation in the potential valley.
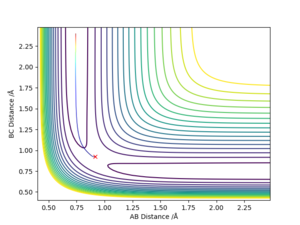

Why does the MEP calculation follow a path of minimum energy and the dynamic calculation oscillates? Comparison of the momenta vs time graph will help in your explanation. Sf3014 (talk) 23:14, 14 May 2019 (BST)
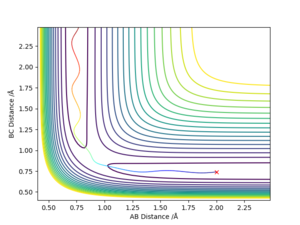
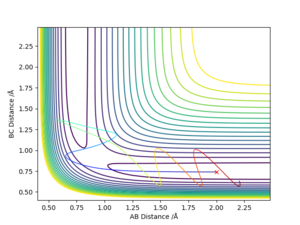
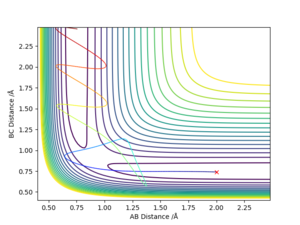
- Complete the table by adding the total energy, whether the trajectory is reactive or unreactive, and provide a plot of the trajectory and a small description for what happens along the trajectory. What can you conclude from the table?
From this table it can be seen that having total energy in the system be above the activation energy does not necessarily mean that the reaction will proceed. In every case the total energy of the system was sufficient for activation, but it was only when the particles had the correct relative momenta that the reaction could actually take place. Good observations in table. However, you shouldn't mix terms ie either refer to molecule H2 and H atom or A-B and C. What is defined as "the correct relative momenta"? Refer to the momenta of the reactions that took place compared to the ones that didn't. Sf3014 (talk) 23:32, 14 May 2019 (BST)
- State what are the main assumptions of Transition State Theory. Given the results you have obtained, how will Transition State Theory predictions for reaction rate values compare with experimental values?
The main three assumptions of Transition state theory[1] are that reactants are in constant equilibrium with the transition state, that the energy of the particles follows the Boltzmann distribution, and that once reactants enter the transition state, they will not collapse back to reactants, instead going forward to the products. Based on the results obtained in this exercise, in reality a collision occurring with sufficient energy to create the transition state will not necessarily be reactive. The distribution of total energy between kinetic energy and vibrational energy of each molecule will play a role as well, and even if a transition state is reached, it may still revert back to products. Thus, Transition State Theory will predict reaction rates as being faster than in reality, as it fails to account for transition states reverting back to reactants. Good explanation and use of reference. Sf3014 (talk) 23:38, 14 May 2019 (BST)
Exercise 2
- By inspecting the potential energy surfaces, classify the F + H2 and H + HF reactions according to their energetics (endothermic or exothermic). How does this relate to the bond strength of the chemical species involved?

The side of the plot that represents FH + H is much deeper in energy than the side representing F + H2. This reflects How the H-F bond is significantly stronger than the H-H bond. As a result of this difference in potential energy, going from FH + H to F + H2 will require intake of energy, thus it is endothermic, and the reverse reaction is thus exothermic. Good, but you forgot to refer to the bond energies. What are the HF and H2 bond energies? Sf3014 (talk) 23:41, 14 May 2019 (BST)
- Locate the approximate position of the transition state.
According to Hammond's postulate, the transition state resembles more the reactants or products, whichever is closer in energy to the transition state. Since the F + H2 side is so much higher in energy, than the FH + H side, and the transition state is the highest point on the reaction path, it can be approximated that the TS will resemble the F + H2 system. Thus the transition state position occurs at approximately r1=0.74, r2=1.809 Good, but reference needed for Hammond's postulate. Also, how did you get to those positions for the transition state? And it would be better to include graphs proving that you found the position of transition state. Sf3014 (talk) 23:50, 14 May 2019 (BST)
- Report the activation energy for both reactions.
From the above point's conclusion on the position of the transition state, and the fact that the potential curve is so steep that the exothermic reaction of F + H2 to FH + H is spontaneous, the activation energy for the exothermic reaction can be taken to be 0. The activation energy for the endothermic reverse reaction is the difference in energy between the transition state and the products. These energies can be found by performing an mep from a structure neighbouring the TS and inspecting its energy vs time plot as the structure goes from the TS to the product.
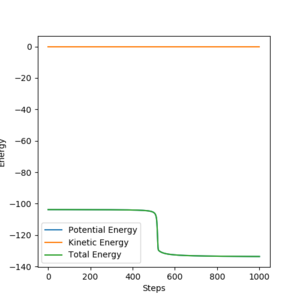
Potential energy of F + H2=-103.8
Potential energy of FH + H=-133.4
Activation energyendothermic reaction= -103.8 - (-133.4)=29.6 Yes, the activation energy will be small for the exothermic reaction but you can still try and determine it the same way you calculated the activation energy for the endothermic reaction. There is some confusion here, the potential energy of -103 is the potential energy at the transition state (as you stated earlier) not at F + H2 which you more recently defined. Sf3014 (talk) 00:09, 15 May 2019 (BST)
- In light of the fact that energy is conserved, discuss the mechanism of release of the reaction energy. Explain how this could be confirmed experimentally.
After the exothermic reaction, reaction energy is converted to momentum of the new diatomic formed, and vibrational energy in the new diatomic. thus one way reaction energy is released is by being released to the environment as heat, which can be measured experimentally by calorimetry. Energy converted into vibrational energy in the diatomic atom formed, can be measured experimentally by emission spectroscopy. Adding the energy released by these different modes will confirm experimentally the amount of reaction energy released. What is the basis of your explanation on the conservation of the reaction energy? You should use graphs from your simulation to support your statements. How does emission spectroscopy give you proof on the conservation of energy? More explanation is needed. Sf3014 (talk) 00:30, 15 May 2019 (BST)
- Discuss how the distribution of energy between different modes (translation and vibration) affect the efficiency of the reaction, and how this is influenced by the position of the transition state.
The distribution of energy between vibrational and translational modes is important as it will determine if a collision will be reactive. [2]Polanyi's empirical rules say that the contribution of vibrational energy to the reaction rate is related to where the energy barrier (transition state position) lies. For reactions where the barrier is early, like the exothermic reaction, vibrational energy makes a lesser contribution, and the energy supplied to overcome activation energy must be more in the form of translational energy. The reverse is true when the energy barrier is later in the reaction, closer to the reactants as is the case for the endothermic reaction. The efficiency of the reaction will be effected as for the reaction to proceed, not only must activation energy be reached, but the energy must be in the correct mode as well, so the reaction will only have good efficiency if these criteria are met. This is good, but how does this compare to you simulation results which illustrates Polanyi's rules. You could of included contour plots for reactants F + H2 with different initial values to compare with Polanyi's rule. Sf3014 (talk) 00:42, 15 May 2019 (BST)


