MRD:nt814
Exercise 1: H+ H2
Transition state vs local minimum
An investigation of the potential energy surface plot can be used when determining the transition state. Along the reaction coordinate and its orthogonal axis a gradient of 0 would imply either a local minimum or the transition state. The second derivative is required to differentiate between the two; the transition state is represented by a saddle point, meaning that the second derivative is negative along the reaction coordinate and negative along its orthogonal. A positive second derivative along both axes would mean that the point is a local minimum.
Ng611 (talk) 23:26, 7 June 2018 (BST)Good explanation
Locating the transition state
Given the symmetric nature of the system in question, at the transition state the distances between the three atoms (r1, r2) will be equal. As discussed above, the gradient of the potential energy surface at the transition state is zero indicating that the force acting on the system will be zero. It can, therefore, be inferred that all the energy is converted to potential energy, resulting in the momenta being zero. By investigating different different values for the internuclear distances the transition state was found to occur at 0.908 Å.
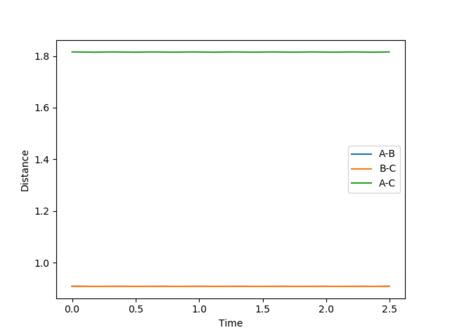

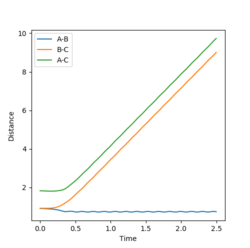
The figures above show the system being in the transition state. In the plot of the internuclear distances vs time the straight lines indicate a constant energy, meaning that the bond is not fluctuating. In the contour plot for the transition state determined, the molecule can be seen as being stationary. This reflects the lack of kinetic energy at the transition state.
Reaction dynamics and the minimum energy path
Calculating the reaction path
The minimum energy path is a special trajectory where every point along it is a en energy minimum in every direction perpendicular to it. The minimum energy path calculated for this system does not display the oscillation , something clearly demonstrated in the dynamic calculation as a result, it can be said that the minimum energy path is not a realistic representation as it does not account for the inertial motion of molecules in the gas phase.
Ng611 (talk) 23:27, 7 June 2018 (BST) Why is this the case?
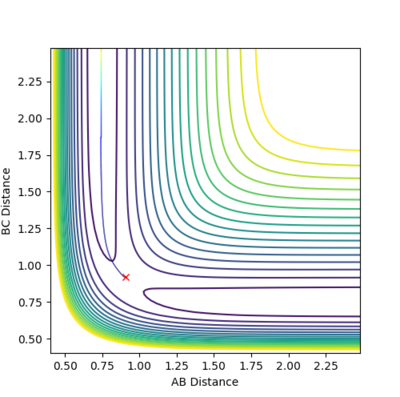
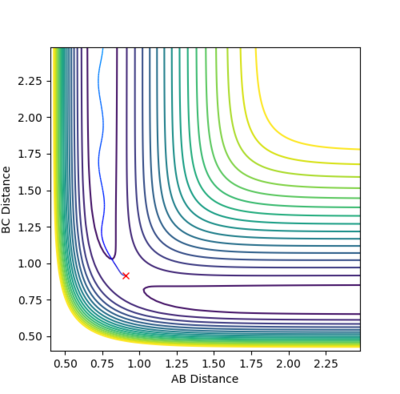
Trajectories from r1 = rts+δ, r2 = rts
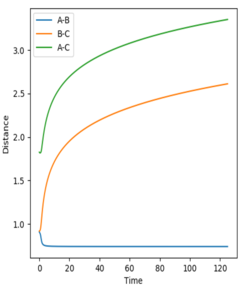
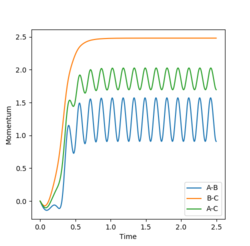
The MEP compared to the dynamics in both the internuclear distance and internuclear momentum took much longer to show a completed reaction. For internuclear momentum it took almost ten times longer for the momentum to plateau compared to the dynamic momentum. In the plot of internuclear momentum vs time the momentum of distances changed for MEP compared to dynamics. In dynamics HC-HB had the highest momentum followed by HC-HA whereas in the MEP HC-HA had the highest momentum with HC-HB having the second highest. The MEP is the lowest energy possible reaction path that allows the reaction to run to completion. Its dependency on the transition state allows it be mapped out by following the downhill gradient in both the forward and backward direction from the transition state. As a result, even if it does not represent the most realistic situation, for example by not taking inertial motion of gas molecules, it is useful in characterising a chemical reaction. A summary of the calculations can be seen below.
| MEP | Dynamic |
|---|---|
 |
|
 |
|
The final momenta and final positions were used to see what would happen when initial and final values were switched. The reverse of the previous reactions occur. The products do not react as they do not go over the transition state. Switching the values produces no change in the values, just lead to the distances being swapped around.
Reactive and unreactive trajectories
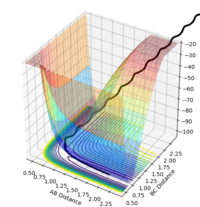
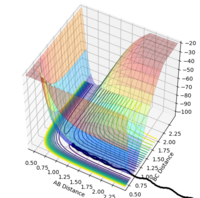
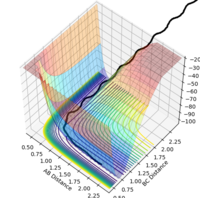
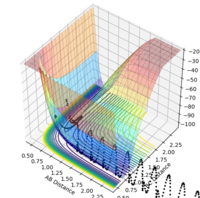
Reactions go into completion if there is enough energy in the system to overcome the activation barrier, which occurs at the transition point. This assumption was tested using r1 and r2 value of 0.74 and 2.0 respectively, and the values of p1 and p2 were varied according the the values seen in the table below. The total energy of the reaction and whether the reaction trajectory was reactive or not was recorded. In the contour and energy surface plots presented below it can be clearly seen which trajectories are reactive and unreactive.
| p1 | p2 | Total Energy | Trajectory | Controur | Energy surface |
|---|---|---|---|---|---|
| -1.25 | -2.5 | -99.018 | reactive | 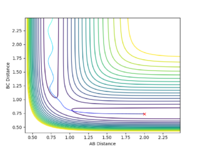 |
|
| -1.5 | -2.0 | -100.456 | unreactive | 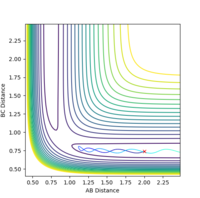 |
|
| -1.5 | -2.5 | -98.956 | reactive | 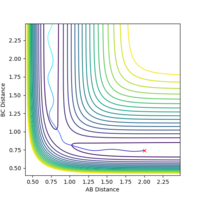 |
|
| -2.5 | -5.0 | -83.956 | unreactive | 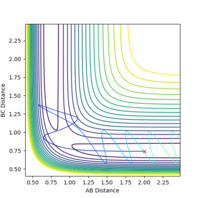 |
|
| -2.5 | -5.2 | -83.416 | reactive | 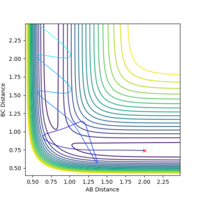 |

|
Transition state theory
The transition state theory is used to explain the reaction rates of elementary chemical reactions. It assumes a special case of chemical equilibrium between reactants and activated transition state complexes, but not between the latter and products. It also assumes that nuclei behave according to laws of classical mechanics and that the system will pass through the lowest energy transition state available to it. This allows for the prediction of the highest reaction rate allowed for the particular system. However, these assumptions do not always prove accurate. As can be seen from the figures above, some reactions go to completion without going through the lowest energy saddle point, progressing at a rate lower than what the transition state theory would permit. This can be attributed to quantum mechanical contributions not accounted for given that, as said above, the theory assumes a classical behavior for atomic nuclei. Finally transition state theory does not account for the recrossing of the transition state, as it assumes that anything that passes through the transition state will go to completion. [1].
Ng611 (talk) 23:29, 7 June 2018 (BST) I think you're a bit confused here. Reactant going through other points than the TS is not the same as tunelling, which is not modelled in these simulations. TS recrossing, as seen in the final 2 examples, is a far more significant effect.
Exercise 2: F-H-H system
PES Inspection
Endothermic vs Exothermic
In the case of F+H2 the significant difference in electronegativity between hydrogen and fluorine makes the bond strong, stronger that between two hydrogen atoms. As a result, the formation of the bond between hydrogen and fluorine will be associated with a release in energy, making the reaction exothermic. The high reactivity of both fluorine and the diatomic hydrogen molecule also point to an exothermic reaction. Conversely, the following will be true in the case of H+HF. This is clearly demonstrated in the energy surface plots for the reactions as in the first case the reactants a higher energy than the products with the opposite being true for the second case.

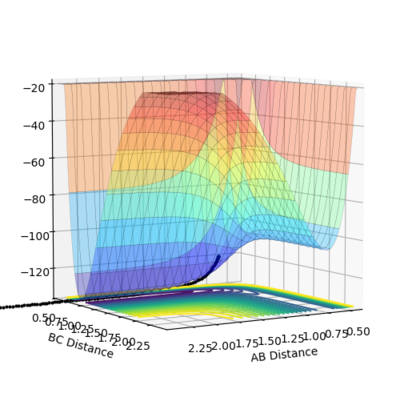
Locating the transition state
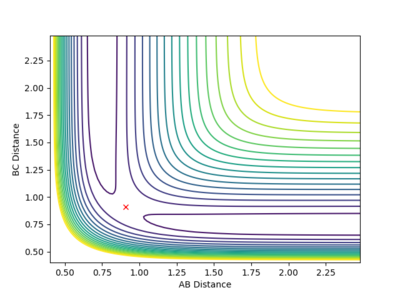
To locate the transition state Hammond's postulate was applied. According to that if a reaction is exothermic, the transition state will be an early one and will occur without significant molecular reorganization. AS a result it will resemble the reactants. In an endothermic reaction the opposite will be true and the transition state will resemble the products. In the case of the exothermic reaction of fluorine with hydrogen. Through a trial and error process the transition state was found at H-F=1.811 and H-H=0.745 Angstrom distances respectively. this can be seen below.
Activation Energy
To get the value for the activation energy, an MEP calculation was set up from a structure neighbouring the transition state. By subtracting the potential energy of the reactants from the potential energy of the transition state to get a reasonable estimate of the value. This was found to be 27.13 Kcal/mol for the endothermic and 0.23 kcal/mol for the exothermic reaction of fluorine with the hydrogen diatom. These deviated from literature values. As mentioned above the MEP method does not provide the most realistic image of the reaction system.
Ng611 (talk) 23:30, 7 June 2018 (BST) Good, although some results to show how you arrived at these figures would be useful.
Reaction Dynamics
F + H2
To identify a reactive trajectory a process of trial and error was employed to identify a set of initial conditions that would produce such a trajectory. These were found to be rHH=0.75A, pHH=2.991, rHF=2.40A, pHF=-3. The trajectory in question can be seen below.
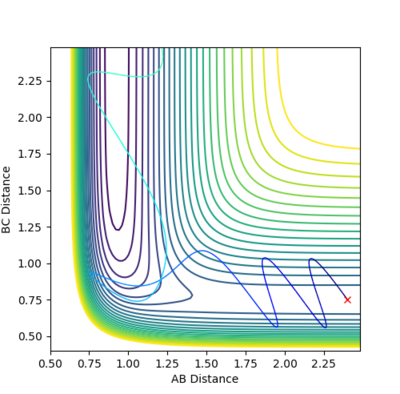
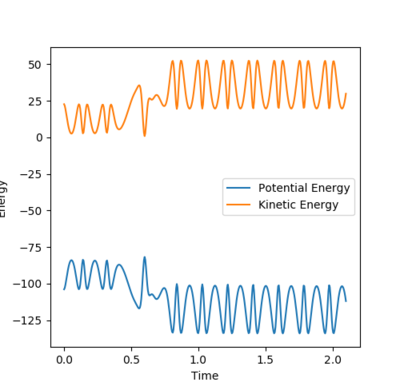
The energy is system is conserved as can be seen from the energy vs time plot below. The potential and kinetic energies are mirror images of each other. It can be concluded that total energy of the system remains the same. However, the bigger amplitude by which the product molecule oscillates implies that the heat released (this reaction is exothermic) leads to an increase in the kinetic energy. As a result, the potential energy decreases to accommodate for that change. This can be monitored using methods such as IR spectroscopy to identify overtone bands arising from molecules in higher vibrational states and calorimetry (using a bomb calorimeter), to measure heat released.
After the initial conditions were identified, a range of conditions were explored with pHH values between 3 and -3 and values of pHF=-0.5 and rHH=0.74A and rHF=2.3 Angstrom.
| pHH | Trajectory | Controur |
|---|---|---|
| -3 | reactive | 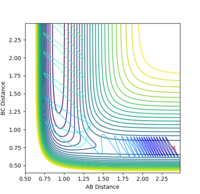
|
| -2.5 | unreactive | 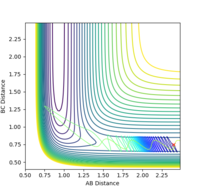
|
| -1.5 | unreactive | 
|
| 1 | unreactive | 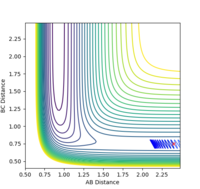
|
| 1.5 | unreactive | 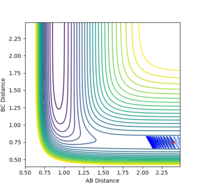
|
| 2.5 | reactive | 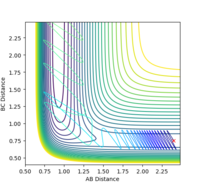
|
| 3 | unreactive | 
|
The trend that is observed is that in order for the atoms to cross the energy barrier and the reaction to go to completion a certain amount of momentum is needed. This can be in either direction and the reaction goes to completion even if barrier recrossing is observed as is the case in some of the cases presented above. For the same initial position, the momentum were set as pFH = -0.8 pHH = 0.1 respectively. the reaction proceeded to go to completion.
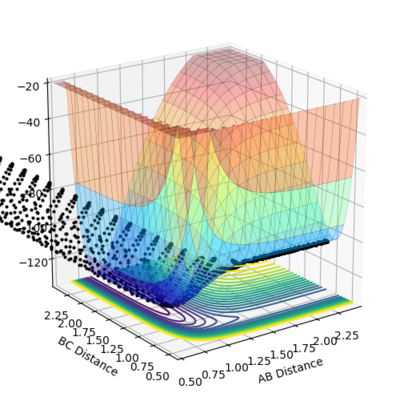
H+ HF
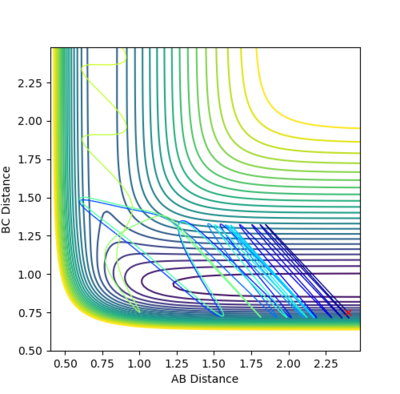
Initial conditions starting at the bottom of the entry channel were set, with very low vibrational motion on on the H - F bond pHF=2, rHF=0.75A, rHH=2.4A, pHH=-0.5. A reactive trajectory was determined by a process of trial and error by simultaneously keeping the momentum of the H-F diatom low and that of the hydrogen atom high. That produces a system of high translational energy. According to Polanyi's empirical rules, favor the crossing of a late transition barrier, whereas translational energy is more effective than vibrational when the energy barrier is an early transition. This example illustrated these rules as an increase in the vibrational energy made for a more efficient reaction. [2]. A reaction trajectory was determined where pHH= -0.1 and pF=6.
Ng611 (talk) 23:33, 7 June 2018 (BST) Good examples, and overall a good report. I've provided feedback in individual bits and pieces throughout the work but overall, well done.
