MRD:ns3516cp3md
EXERCISE 1: H + H2 system
Dynamics from the transition state region
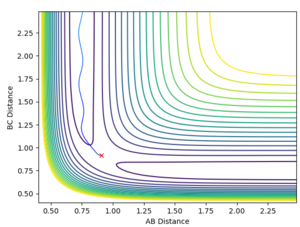
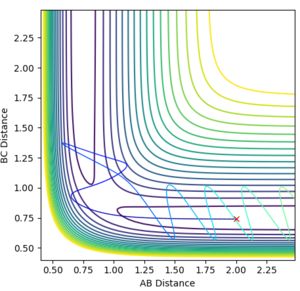
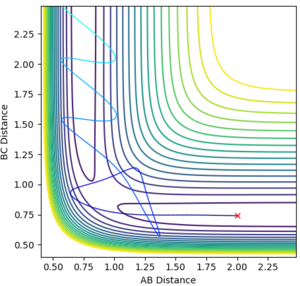
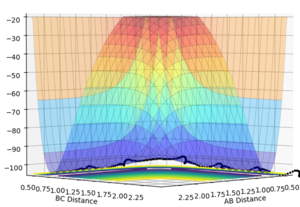
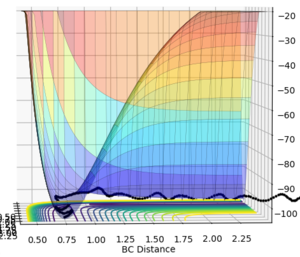
The gradient, dV/dr, is equal to zero at both the minimum point and at the transition structure. The transition structure is the free energy maximum along the reaction coordinate and is described as a saddle point. Despite both of these structures being stationary points, with a first derivative of zero, they differ quite significantly.1 This is such that a minimum will be viewed as minimum at every angle whereas a saddle point will only be seen maximum along the reaction coordinate but will be a minimum everywhere else. 1 This is such that we can differentiate between these two structures by taking the 2nd derivative. For a minimum point dV2/dr is greater than 0 for all r however for the transition structure dV2/dr is greater than 0 for all r, excluding along the reaction coordinate and is less than 0 along the reaction coordinate. 1 This phenomenon was then used to describe the potential energy surfaces (PES) below.This transition structure (saddle point) can be seen on a PES. If we look along the reaction path, a maximum point corresponding to a transition structure can be seen. However, if we now look at an angle orthogonal to this path, a minimum point would then be observed. This is depicted in the two PES plots given below.
Ng611 (talk) 23:02, 7 June 2018 (BST) Good explanations. Your example diagrams were a bit confusing at first -- consider a top-down perspective in future -- but they do get the point across.
Trajectories from r1= r2: locating the transition state
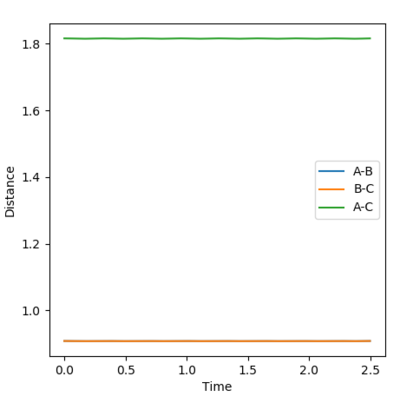
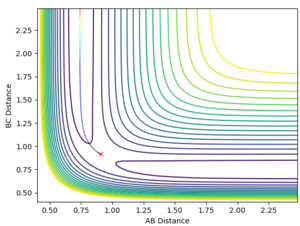
Since r1 is equal to r2 (as the H + H2 surface is symmetric) and the momenta are both equal to 0, all that had to be done was to employ trial and error to determine a distance that would result in a disappearance of the reaction path indicating that a transition state had been reached. The value of r1 and hence r2 was determined to be 0.908 Å. This is shown in the diagrams below.
This is a plot of internuclear distance vs time. It shows two flat lines that are not oscillating. The fact that the lines are not oscillating implies that the bond has been broken and the reaction has now reached a transition state as there is no longer oscillation of the bonds. This proves that the correct bond length for r1 and r2 was established (0.908 Å).
This contour plot also shows that a transition state has been reached as a reaction trajectory is not present.
Reaction path
The minimum energy pathway (MEP) is a special trajectory that corresponds to infinitely slow motion in which the velocity resets to 0 in each time step. A table denoting the difference between the two calculation types is provided in the table below.
A calculation was then set up where the initial conditions were set so that r1=rts and r2 = rts + 0.01. The internuclear distance vs time plots using the respective calculations types MEP and dynamic are provided below.
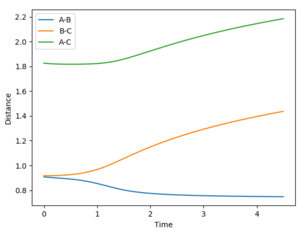
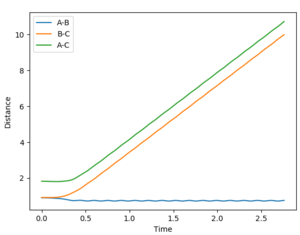
The calculation was then adjusted such that the value of r1 and r2 were swapped - the internuclear distance vs time plots are provided by the diagrams below.


As you can see, when the respective value of r1 and r2 it results in no change to the internuclear distance vs time plots.
Reactive and unreactive trajectories
Transition state theory
What is Transition State Theory (TST)?
Transition State Theory (TST) addresses the calculation of a reaction rate for an elementary reaction that is unlikely occur. It does this by splitting the dividing space in to two regions: the reactant region (RR) and the product region (PR). The partition between these two sections is known as the transition state. 2
What are the main assumptions?
The first significant assumption involved in TST is the fact that the atoms in the reactant state are said to obey a Boltzmann distribution. 2 This would only occur if thermal equilibration has been reached. 2 TST also assumes that once the transition has been reached - the initial state thus becomes unattainable. 2There are also several other assumptions which are worth noting. The first of which being that the thickness of the transition state is said to be 0. 2 TST also assumes quantum-tunneling effects to be negligible when applied to PES'. 2
The assumption by TST that quantum-tunneling effects are negligible may not be sufficiently accurate. This is because at the subatomic level classical mechanics becomes increasingly relevant and thus needs to be considered. This could result in a increased experimental rate as perhaps more particles may become viable in reacting through tunnelling.
Ng611 (talk) 23:04, 7 June 2018 (BST) Yes tunnelling is somewhat important (especially in lighter molecules) but recrossing of the TS is far more important.
EXERCISE 2: F-H-H system
PES inspection
The energetics of the F + H2 and H + HF reactions can be classified simply by considering electronegativity differences. Let us first consider the reaction of F + H2. This reaction involves the formation of HF and the breaking of the H2 bond. The formation of HF is highly exothermic as a very stable bond is being formed. This is because fluorine, the most electronegative atom in the periodic table, extremely polarises the HF bond. Although the H2 bond is quite energetic (432 kJ/mol)3 this is dominated by the HF bond (565 kJ/mol)3. Thus this reaction overall is exothermic and hence is extremely favourable. Now considering the second reaction, it can be seen that it would require the cleavage of a HF bond and the synthesis of a H2. For the reasons stated previously, this reaction would not be expected to be favourable and so the overall reaction would be endothermic.
The approximate positions of the transition state can be approximated by invoking Hammond's postulate. This states that the transition state of a reaction will resemble either the structure of the reactants or that of the products - that which is chosen depends on which of the two species the transition state is closest to.
F + H2
As established previously this reaction is exothermic. Therefore by invoking Hammond's postulate we can see that it will have an early transition state in which the transition state can be assumed to have a reactant-like structure.
H + HF
For this system, it was said that that the overall reaction was endothermic. According to Hammond's postulate this will have a late transition state in which the transition state will closely resemble the product and so will be product-like.
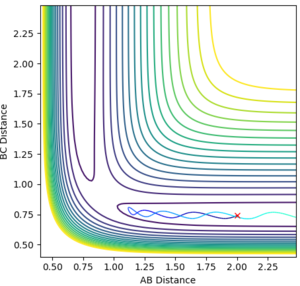
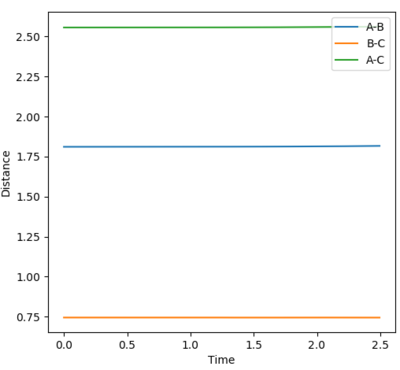
This analysis aided in the determination of the transition state as once the approximate structure of the transition state was established (i.e. whether it was reactant/product-like) one could deduce the approximate position of the transition state. This was done by trial and error. The contour map and the internuclear distance vs time plots are provided below.
The fact that the internuclear distance vs time plot is linear and not oscillating highlights that a minimum point has been reached.
The value of the F-H bond was established to be 1.811 Å and that of the H-H bond 0.745 Å.
Activation energy
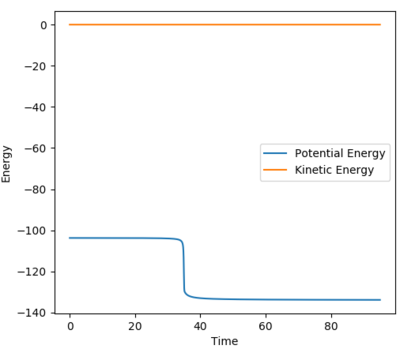
The activation energy was calculated by analysis of the energy vs time graphs. An MEP calculation analysis with 19,000 steps was employed to determine the activation energy. A structure neighbouring the transition state was used.
F + H2
A bond length of 1.92 Å was used for the F-H bond as well as a H-H bond length of 0.745 Å. This resulted in an activation energy of -103.311--103.609 = + 0.298 kJ/mol.
The energy vs time plot is provided below.
Ng611 (talk) 23:06, 7 June 2018 (BST) Your number seems reasonable, but it's hard to tell from the figure -- consider zooming in!
H + HF
For this reaction an F-H bond length of 1.78 Å was used as well as a H-H bond length of 0.745 Å. This resulted in an activation energy of-103.615--133.953 = + 30.338 kJ/mol.
The energy vs time plot is provided below.
Ng611 (talk) 23:06, 7 June 2018 (BST) Good!
Reaction dynamics
The internuclear momenta vs time plot was used to explain the release of energy during the reaction. A set of conditions was devised to analyse this, these are provided below:
AB distance: 3.4 Å
BC distance: 0.745 Å
AB momentum: -2.8
BC momentum: -2.0
From this graph it can be seen that the A-B bond (F-H) has a much larger oscillation than the B-C and the A-C and is more periodic. The F + H2 reaction is exothermic in which the excess energy released in the reaction is stored in the bonds which is seen as oscillations in the plot above i.e. vibrations of the bond. The most logical method of experimentally confirming this is to use IR spectroscopy which relies on a change of dipole. The H-F bond would be observed as it has a permanent dipole and would absorb at the IR wavelength range.
Ng611 (talk) 23:07, 7 June 2018 (BST) IR is a good choice, what would you expect to see though?
Polanyi's empirical rules
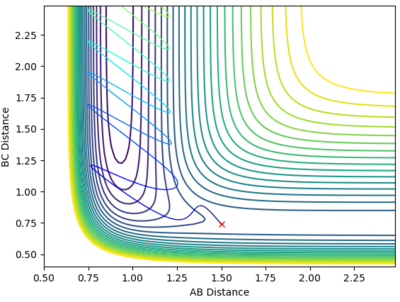
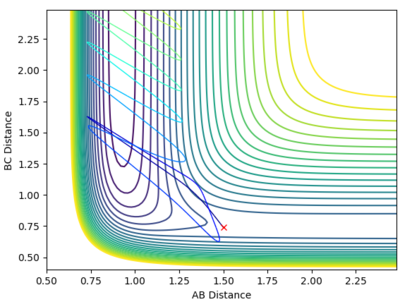
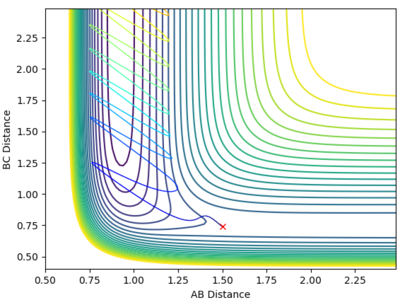
A new calculation was set up on the side of the reactants of F + H2. The set of parameters used are provided below along with their respective contour plots:
First conditions
rHH = 0.74 Å
pFH = -0.5
pHH = -3
Second conditions
rHH = 0.74 Å
pFH = -0.5
pHH = -3
Third conditions
rHH = 0.74 Å
pFH = -0.5
pHH = -3
The system was then adjusted such that the momentum was changed:
pFH = -0.8 (momentum was increased slightly)
pHH = 0.1 (momentum was reduced slightly)
Ng611 (talk) 23:09, 7 June 2018 (BST) These seem like sensible examples, but some text explanation is needed to guide the reader through this section.
Ng611 (talk) 23:09, 7 June 2018 (BST) Besides the final section on Polanyi's rules, this is a very good report, well done!
References
1. E. Lewars, Computational Chemistry, 2016, 9-49.
2. V. Gupta, Principles and Applications of Quantum Chemistry, 2016, 291-337.
3. Wired Chemist. Common Bond Energies. [ONLINE] Available at: http://www.wiredchemist.com/chemistry/data/bond_energies_lengths.html. [Accessed 24 May 2018].
4. 3.Z. Zhang, Y. Zhou, D. Zhang, G. Czakó and J. Bowman, The Journal of Physical Chemistry Letters, 2012, 3, 3416-3419.

