MRD:mx4417
Molecular reaction Dynamics
The objectives of this wiki report is to provide a study on triatomic system reactivities, which involves the collision between one atom and a diatomic molecule.
EXERCISE 1: H + H2 system
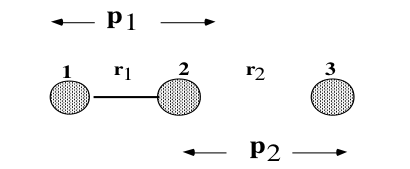
Q1:On a potential energy surface diagram, how is the transition state mathematically defined? How can the transition state be identified, and how can it be distinguished from a local minimum of the potential energy surface?
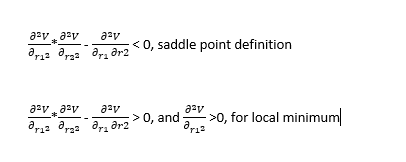
The transition state of the potential energy surface diagram is the Saddle Point of the diagram, which is local maximum on the lowest energy pathway.
The Mathmetical definition of saddle point: =0
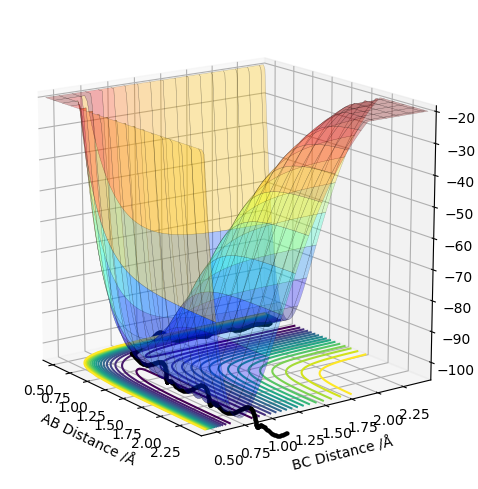
(I think you can state more for this.) Cq3417 (talk) 22:58, 6 June 2019 (BST)
Q2:Report your best estimate of the transition state position (rts) and explain your reasoning illustrating it with a “Internuclear Distances vs Time” plot for a relevant trajectory.
With initial condition r1 = r2, and p1 = p2 = 0.0. It was found that: r(ts)= 0.9077 Å.
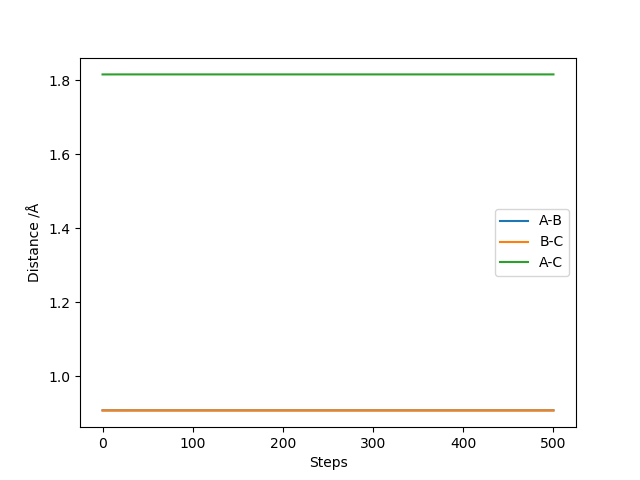
As the gradient of both lines in the graph are zero and the distance was kept constant, so it is a saddle point and thus the transition state of the model.
(Ok, but why?) Cq3417 (talk) 22:58, 6 June 2019 (BST)
Q3:Comment on how the mep and the trajectory you just calculated differ.
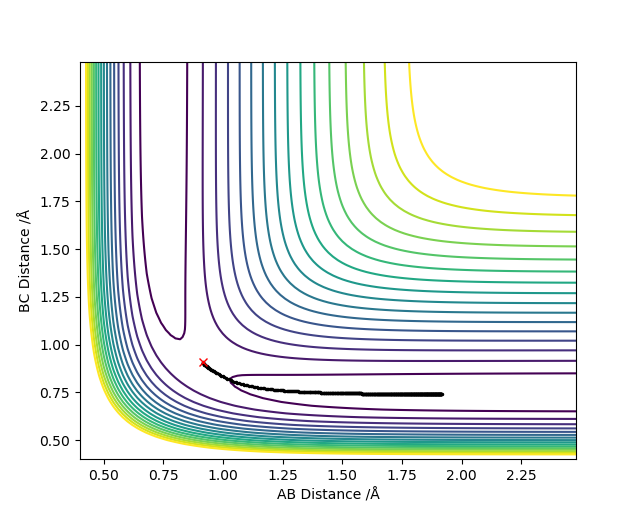
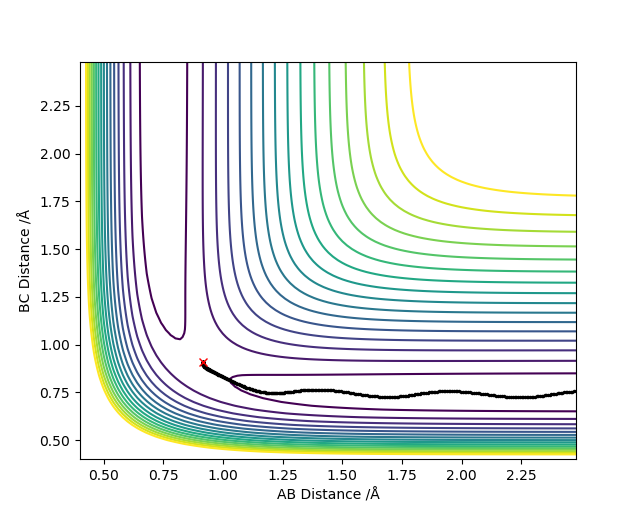
Trajectories from r1 = 0.9077 Å + 0.01, r2 = 0.9077 Å, p1= p2 = 0
 |
 |
|---|
 |
 |
|---|
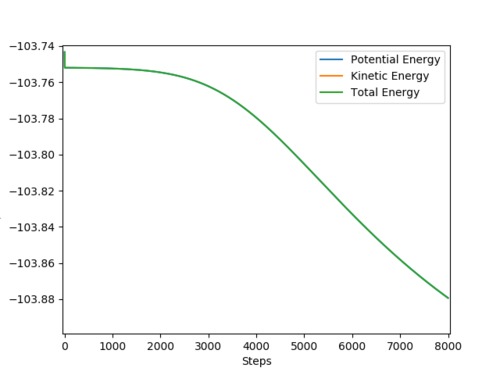
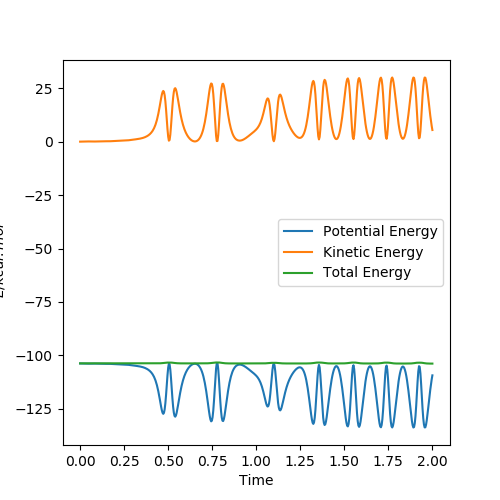
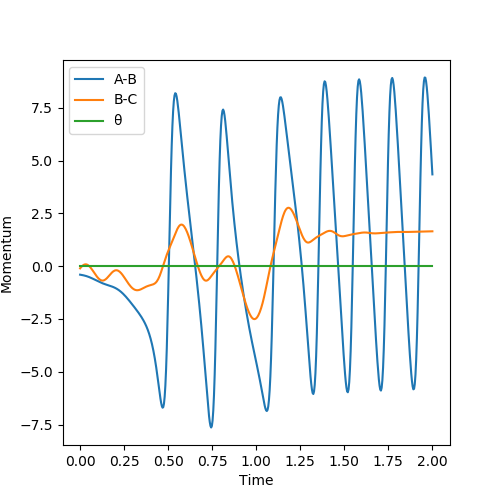
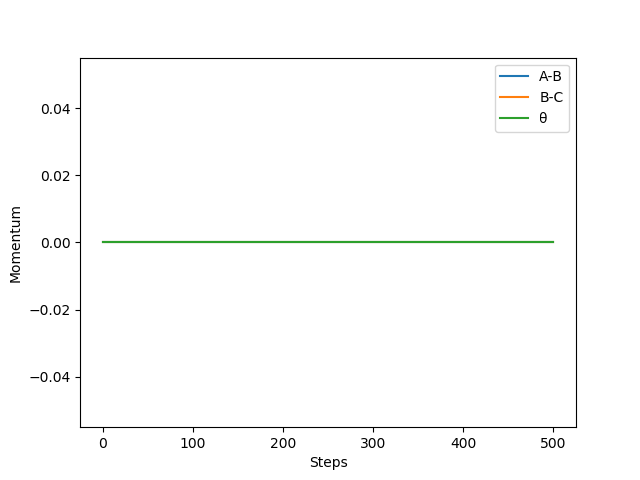
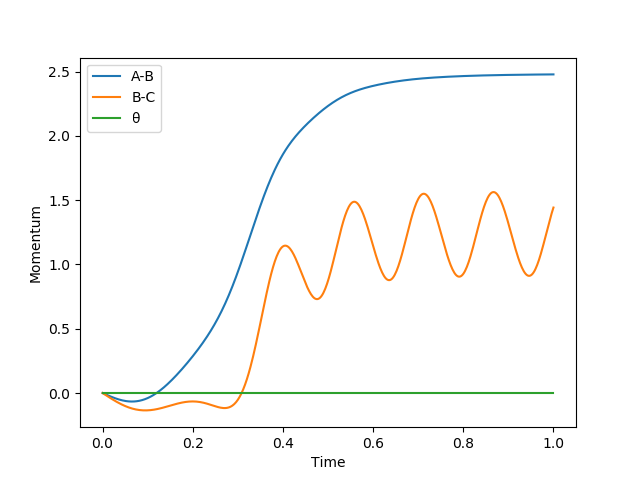
For dynamics method, the vibration motion can be seen as the trajectory is oscillating. For MEP methods, the kinetic energy is set to be zero (see figure 3), thus no oscillation.
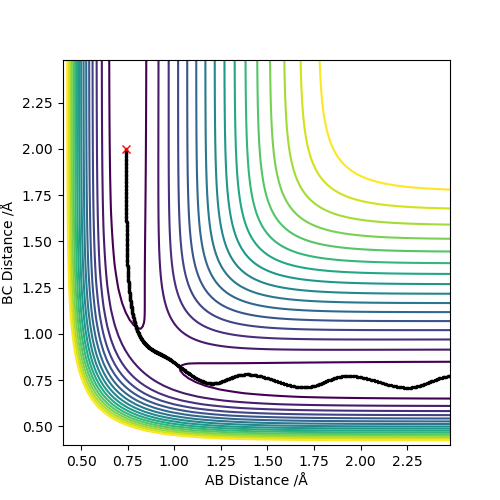
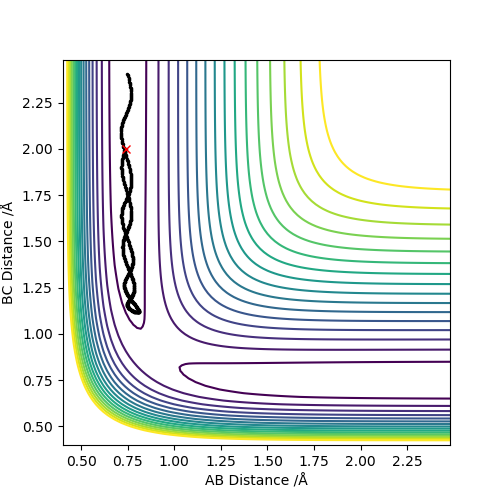
Q4:Complete the table above by adding the total energy, whether the trajectory is reactive or unreactive, and provide a plot of the trajectory and a small description for what happens along the trajectory. What can you conclude from the table?
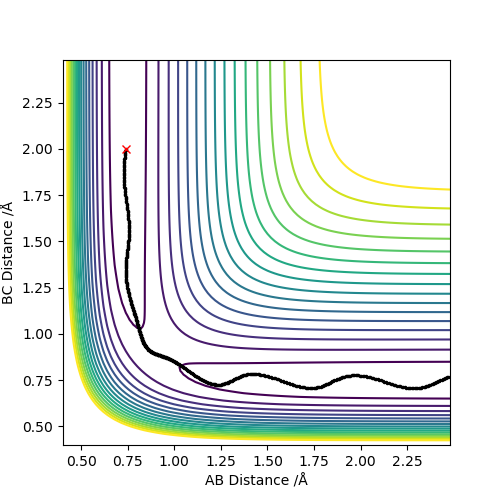
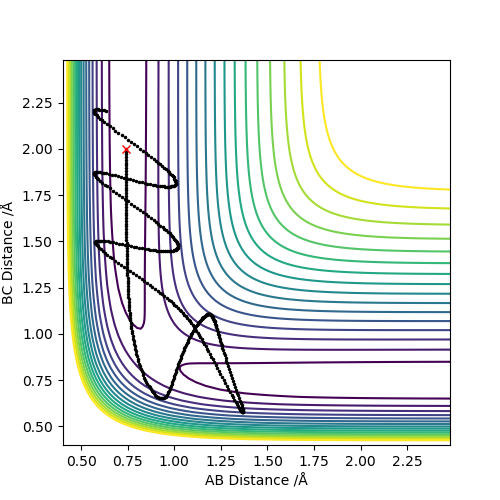
For the initial positions r1 = 0.74 and r2 = 2.0
Conclusion: For the reactants start with same potential energy, but with different momentum (kinetic energy), increases kinetic energy not always make the reaction reactive. As high kinetic energy may cause the re-formation of the vibrating excited reactant.
(Good illustration.) Cq3417 (talk) 23:28, 6 June 2019 (BST)
Q5:State what are the main assumptions of Transition State Theory. Given the results you have obtained, how will Transition State Theory predictions for reaction rate values compare with experimental values?
Transition state theory (TST): 1. A molecular system that has crossed the transition state in the direction of a product cannot turn around and reform reactant.
2. In the transition state, motion along the reaction coordinate may be separated from the other motion and treated classically as translation.
3. Even in the absence of equilibrium between reactant and product molecules, the transition states that are becoming products are distributed among their states according to the Maxwell-Boltzmann laws.
4. Electronic and nuclear motions are separated due to the large difference in mass.(using the Born-Oppenheimer approximation)
The first theory is not correct as the table shows the reactant could be reformed under certain circumstances, and the reformation of the reactants decreases the rate of the reaction. The second one is also not as correct as it predicted, in the calculations (contour plot), there is some vibration close to the transition state. The other cannot be verified due to insufficient data.
Exercise 2: F-H-H system
Q6:By inspecting the potential energy surfaces, classify the F + H2 and H + HF reactions according to their energetics (endothermic or exothermic). How does this relate to the bond strength of the chemical species involved?Locate the approximate position of the transition state.
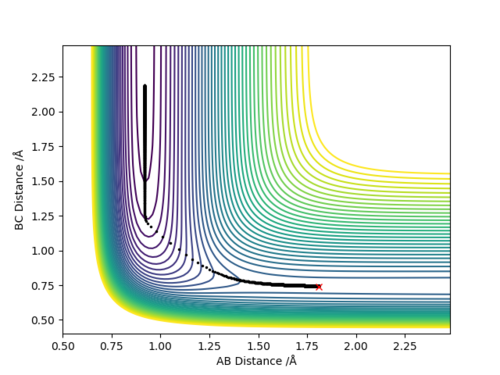
Type of reaction: F + H2 → HF + H ( r1=1.81, r2=0.74), which is an exothermic reaction, as formation of the HF Bond is -565 KJ/mol and bond breaking H2 = +436KJ/mol.
 |
 |
[[ |
|---|
Type of reaction: H + HF→ H2 + F ( r2=1.82, r1=0.74 ), which is an exothermic reaction, as breaking of the HF Bond is +565 KJ/mol and bond formation H2 = -436KJ/mol.
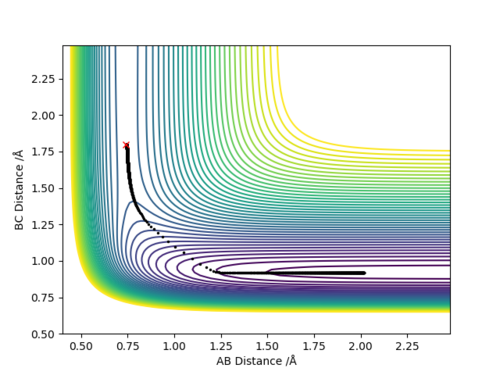 |
 |
|---|
Q7:Report the activation energy for both reactions.
Q8: In light of the fact that energy is conserved, discuss the mechanism of release of the reaction energy. Explain how this could be confirmed experimentally.
Q9: Discuss how the distribution of energy between different modes (translation and vibration) affect the efficiency of the reaction, and how this is influenced by the position of the transition state.
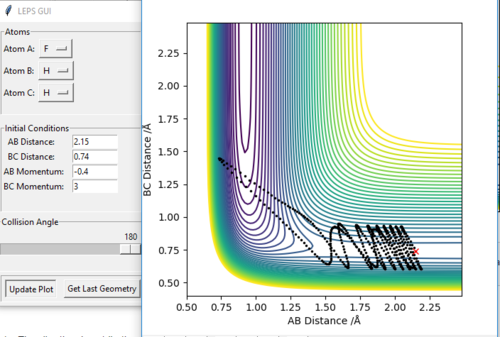
For reaction pathway of F + H2 → HF + H, it has an early transition state. As the reaction is exothermic, according to Hammond's postulate: the transition state resembles the reactant.
 |
 |
|---|
In conculsion, for early transiton state, the translation energy is more dominant for passing over the barrier and let the reaction to occur.
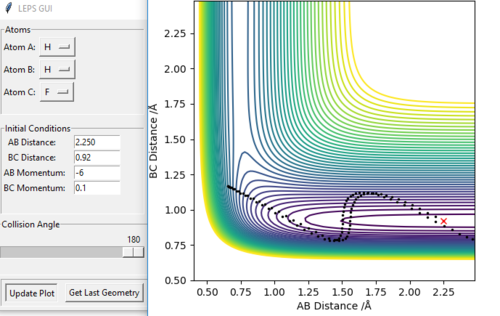
For reaction pathway of H + HF→ H2 + F, it has a late transition state. As the reaction is endothermic, according to Hammond's postulate: the transition state resembles the products.
 |
 |
|---|
In conculsion, for late transiton state, the vibration energy is more dominant for passing over the barrier and let the reaction to occur.
(Good illustration and explanation.) Cq3417 (talk) 23:28, 6 June 2019 (BST)
- ↑ https://bb.imperial.ac.uk/bbcswebdav/pid-1216108-dt-content-rid-3932941_1/courses/DSS-CH1_MPC1-17_18/MPC1-CourseNotes%281%29.pdf
- ↑ J. I. Steinfeld, J. S. Francisco, W. L. Hase, Chemical Kinetic and Dynamics, Prentice-Hall, New Jersey, 1998

