MRD:ms4516
Wiki by Michelle Simon
Exercise 1
Q: What value do the different components of the gradient of the potential energy surface have at a minimum and at a transition structure? Briefly explain how minima and transition structures can be distinguished using the curvature of the potential energy surface.
A: The gradient at both minima and transition structures will be 0 in both r1 and r2 directions.
The second partial derivative test can be used to deduce whether a point is a minimum or transition state (saddle point).
If the value of H<0, then the point is a saddle point If the value of H>0, then the point can be either a minimum or a maximum. A minimum point would have , as any distance away from the minimum would have a gradient >0 (in both r1 and r2 directions).
Q: Report your best estimate of the transition state position (rts) and explain your reasoning illustrating it with a “Internuclear Distances vs Time” plot for a relevant trajectory.
A: Initial conditions set as: p1= p2 = 0 and r1 = r2 = 0.9079
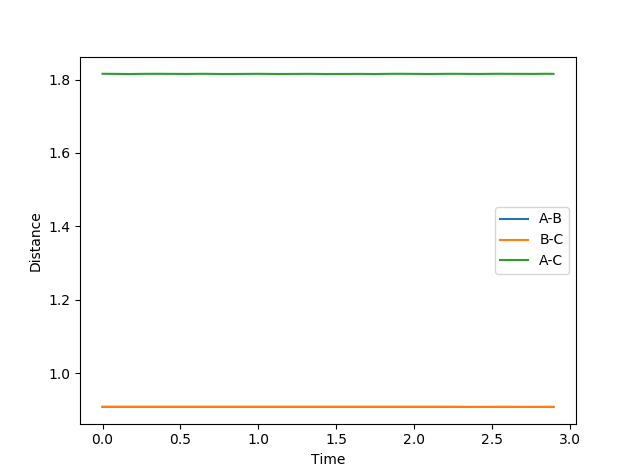
Fig. 1 Distance vs. time in the transition state
Therefore it is found that rts = 0.9079 (approximately). This is where the distances A-B (r1) is equal to B-C (r2). This is taken to be the distance at which the transition state forms due to the symmetrical nature of the energy surface. When momentum is set to 0, there would be no movement or distance changes from the transition state. This can be seen from the straight horizontal lines on fig. 1 depicting no distance change as time passes. This occurs because the transition state is at a stationary point. If the starting point was not exactly at the transition state distance, oscillations would be seen as time passes, as the potential energy decreases to a minimum.
Q: Comment on how the mep and the trajectory you just calculated differ.
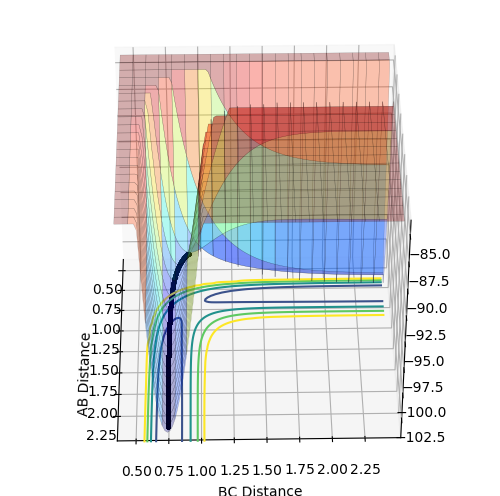
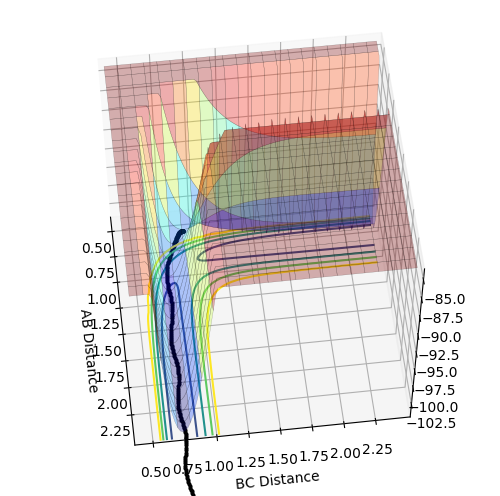
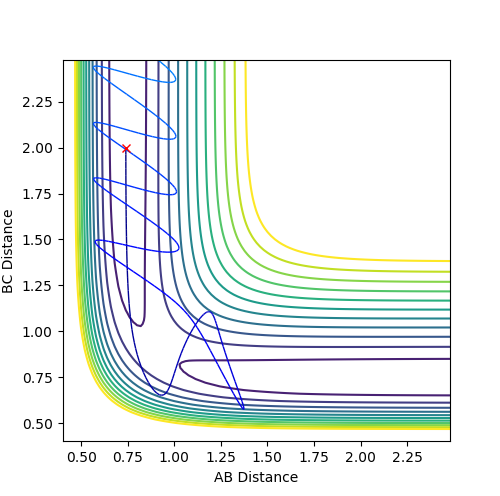
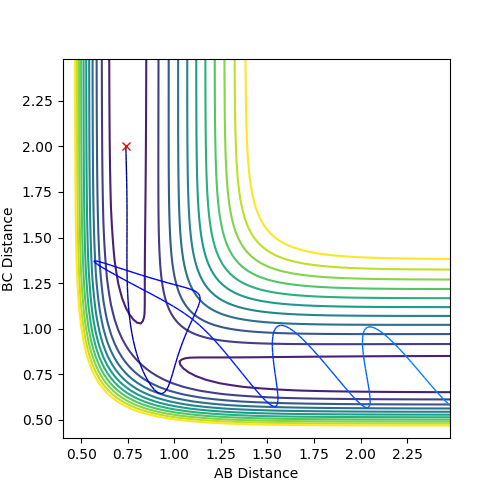
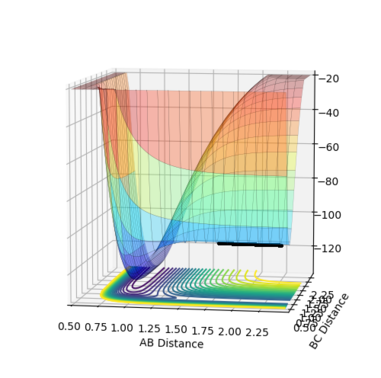
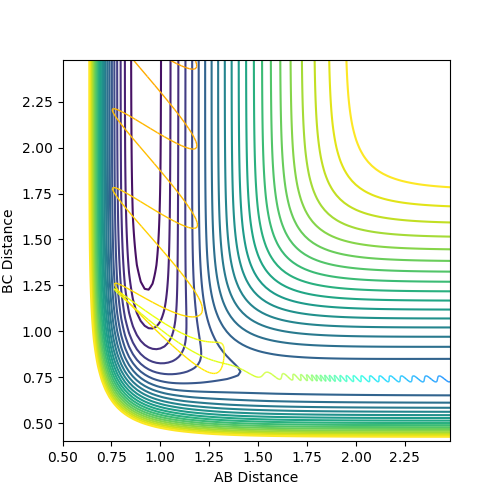
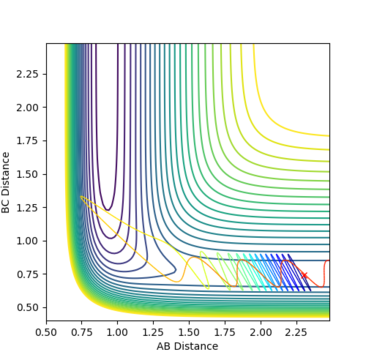
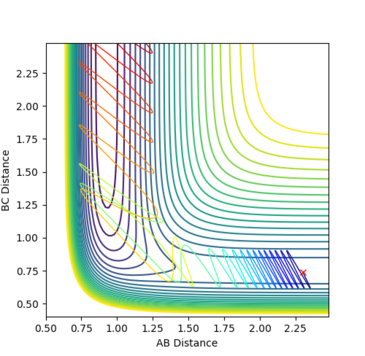
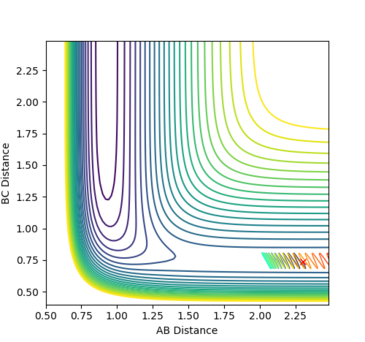
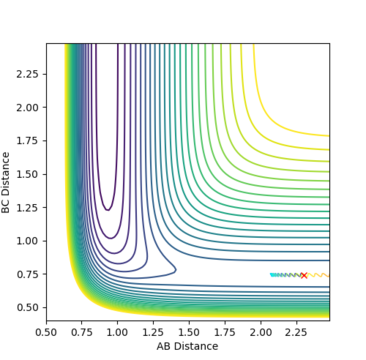
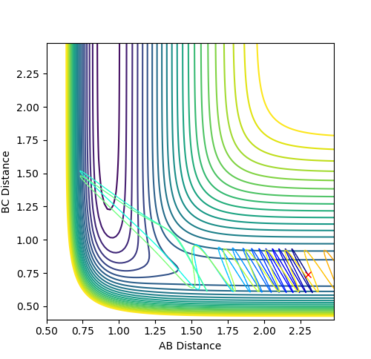
A: The mep trajectory (fig. 2) does not undergo B-C bond oscillations; only the A-B bond distance increases. The mep follows the exact pathway of the bottom of the PE 'valley' with distance after the transition state. After each small movement of the atoms A and B, the momentum and velocity are reset so that the path continues to follow the bottom of the 'valley' only. Whereas the dynamic calculation (fig. 3) takes into account the changes in momentum and oscillations of the bond itself (B-C bond distance also changes).
Fig. 2 - mep pathway
Fig. 3 - Dynamic pathway
Look at the “Internuclear Distances vs Time” and “Internuclear Momenta vs Time”. Take note of the final values of the positions r1(t) r2(t) and the average momenta p1(t) p2(t) at large t.
r1 = 9.96 distance units at t= 2.76 time units (constant)
r2 = 0.75 distance units at t= 2.76 time units (oscillating)
p1 = 2.48 momentum units at t= 2.76 time units (constant)
p2 = 1.37 momentum units at t = 2.76 time units (oscillating)
When changing to r1 = rts and r2 = rts+0.01 initial conditions, the energy trajectory would follow the valley to the reactant minimum instead of the product minimum as the bond distances were set up such that there was a larger potential energy between A-B than B-C at the starting state. Therefore this small change in geometry led the reaction backwards towards the reactants.
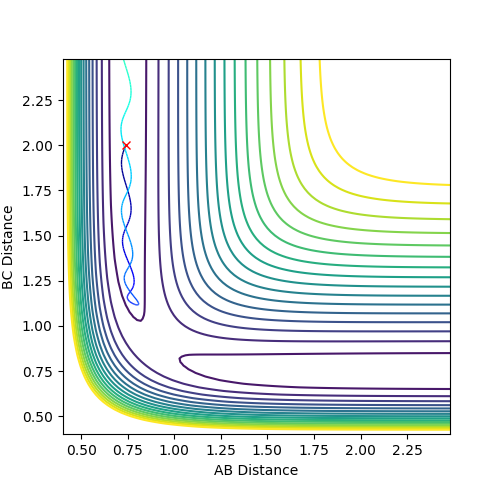
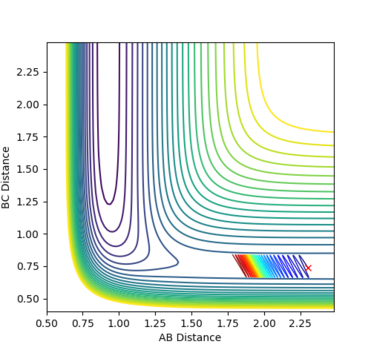
The internuclear distances under these conditions were found to be A-B (0.739) and B-C (9.00). The internuclear momenta were found to be A-B (0.91) and B-C (2.48). These values were found by using the internuclear distance and momenta vs. time plots. When these distances and the negative momenta were set as the initial conditions, the trajectory began near the transition state distance and followed through to the reactants; ie. the reaction was unsuccessful (see fig. 4). Since the momenta were set to be negative, the internuclear distances should decrease.
Fig. 4 - Distance vs. time
Q: Complete the table by adding a column with the total energy, and another column reporting if the trajectory is reactive or unreactive. For each set of initial conditions, provide a plot of the trajectory and a small description for what happens along the trajectory.
A:
| Run | p1 | p2 | Total energy | Outcome |
|---|---|---|---|---|
| 1 | -1.25 | -2.5 | -99.018 | Success |
| 2 | -1.5 | -2.0 | -100.456 | Failure |
| 3 | -1.5 | -2.5 | -98.956 | Success |
| 4 | -2.5 | -5.0 | -84.956 | Failure |
| 5 | -2.5 | -5.2 | -83.416 | Success |
Fig. 5 - Run 1: The path begins on the reactant end, passes the transition state and ends with the products. Both p1 and p2 are sufficient for reaction.
Fig. 6 - Run 2: The path starts going from the reactant, towards the transition state, but gets deflected as it is unable to pass through. The distance between the unreacted molecule and atom then continue to increase. p2 is not negative enough for the reaction to take place.
Fig. 7 - Run 3: The path beings on the reactant end, passes the transition state and ends with the products. It is similar to run 1, except that the bond vibrations are more pronounced. Both p1 and p2 are sufficient for reaction.
Fig. 8 - Run 4: The trajectory proceeds towards the transition state position without much oscillation and passes the 0.9079 AB/BC distance(as determined earlier). The 'rolling ball' goes fairly high up a ridge and falls back down, having transferred momentum into kinetic energy. Both the AB and BC distances change quite significantly (the trajectory goes both forward and side to side) - it seems to have gone through to the products. However, it changes direction, bypassing the transition state once again. Molecule AB undergoes large vibrations after this, due to the high momentum.
Fig. 9 - Run 5: The path followed is along the minimum energy pathway at first, then near the transition state the BC distance decreases to approximately 0.60 due to the high momentum and the molecule appears to be repelled so much that the BC distance increases once again into the reactant region. However, a repulsion off a ridge leads the path back to the product; the reaction proves to be successful.
Q: State what are the main assumptions of Transition State Theory. Given the results you have obtained, how will Transition State Theory predictions for reaction rate values compare with experimental values?
A: The basis of the theory is that the rate constant for an elementary reaction can be accurately known if the structure of the transition state is known. It is also located on a saddle point on a potential energy diagram.
Assumptions: [1]
- The reactant is in thermal equilibrium with the activated complex
- The electronic and nuclear components are separated, alike to the Born-Oppenheimer approximation in quantum mechanics
- The distribution of states of the reactant molecules follow the Maxwell-Boltzmann distribution
- Reactants that cross the transition state toward the products cannot revert back
- Any motion along the reaction coordinate, during the transition state, is considered only as translational motion (all other types can be separated)
- In molecular systems that are not in equilibrium between reactants and products, the number of transition states that lead to the product are still obey the Maxwell-Boltzmann distribution. It is also called the "quasi-equilibrium hypothesis".
The 4th run in the previous section, however, contradicts with the fourth assumption listed above. It actually passes through the transition state to the product region and changes direction back towards the reactants. Therefore since the results obtained experimentally so not agree with the theoretical predictions, it can be determined that the assumptions are not applicable to every situation.
Exercise 2
Q: Classify the F + H2 and H + HF reactions according to their energetics (endothermic or exothermic). How does this relate to the bond strength of the chemical species involved?
A: Table of bond strengths and bond lengths [2]
| Bond strength (kJ/mol) | Bond length (Å) | |
|---|---|---|
| H-H | 436 | 0.74 |
| H-F | 565 | 0.92 |
F + H2 -> H + HF
= (H-H) - (H-F) = 436 - 565 = -129 kJ/mol (Exothermic)
H + HF -> H2 + F
= (H-F) - (H-H) = 565 - 436 = 129 kJ/mol (Endothermic)
Bond strength can be used to determine whether a reaction is exothermic or endothermic. If a species requires more energy to break its bond than the new bond releases, the reaction will be endothermic. Conversely, a bond that does not need as much energy to break, compared to the energy that is released when the new bond is made will result in an exothermic reaction.
Q: Locate the approximate position of the transition state.
Hammond's postulate states that the structure of the transition state most resembles the species that it is closest in energy to. Since the transition state is the highest point on a reaction energy profile, it will resemble the species that is highest in energy. Taking the reaction F + H2 -> H + HF as an example, the H2 bond is approximately 100 kJ/mol less stable (higher in energy) than the HF bond, so in this case the transition state and bond distances should resemble H2 more than HF.
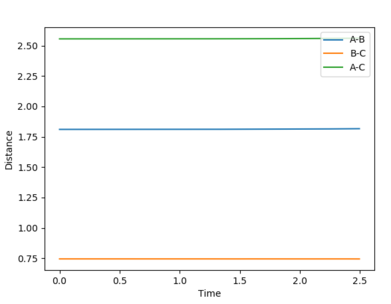
Fig. 10 - Distance vs. time plot at the transition state of F + H2 -> H + HF (A=F, B=H, C=H)
At the transition state, r1=1.811 and r2=0.745. This can be confirmed by looking at the internuclear distances against time plot. Again, since the gradient at the transition state is equal to 0 (stationary point), the atoms shouldn't move as long as there is no momentum change (ie. p1=p2=0). The distances here do not change with time, so the system should have reached a transition state.
Q: Report the activation energy for both reactions.
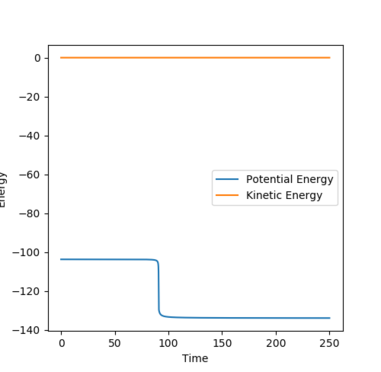
A: The activation energy can be found by displacing the distances from the transition state slightly, setting the initial momenta to 0 and allowing the reaction to proceed via the mep pathway towards the reactants of each reaction. The initial and final energies can be compared (by plotting energy vs. time) to find the minimum amount of energy required to bring the reactants over the transition state.
H + HF -> H2 + F
Fig. 11 - mep pathway
Fig. 12 - Energy vs. time plot
Activation energy: -103.752 - (-133.974) = 30.222 kJ/mol
H2 + F -> H + HF
Fig. 13 - mep pathway
Fig. 14 - Energy vs. time plot
Activation energy: -103.752 - (-103.974)= 0.222 kJ/mol
Q: Identify a set of initial conditions that results in a reactive trajectory for the F + H2, and look at the “Animation” and “Internuclear Momenta vs Time”.
When setting the initial momenta to 0, r1=1.8 and r2=0.745 (dynamic calculation):
Final momentum (A-B) = 0.984 (starting from transition state)
Final momentum (B-C) = 0.495
So the initial momenta should be set slightly more negative than -0.984 and -0.495 (as the initial trajectory was set slightly below the transition state).
Final distance (A-B) = 10.02 (F.. H)
Final distance (B-C) = 0.757 (H-H)
Conditions set:
| A-B | B-C | |
|---|---|---|
| Initial distance | 3.8 | 0.757 |
| Initial momentum | -1 | -0.5 |
Fig. 15 - Contour plot of a reactive F + H2 trajectory
Q: In light of the fact that energy is conserved, discuss the mechanism of release of the reaction energy. How could this be confirmed experimentally?
A: If energy is conserved, this means that the energy that is put in must come out. If -1 unit of momentum was put into A-B and -0.5 units into B-C, the total momentum that comes out would be 1.5 units. This includes what is used during the reaction and any excess. The excess momentum would be converted into different modes of energy after the reaction, which allows additional energy to be dissipated. These different mechanisms include translational motion of the atom (and molecule) away from the transition state and vibrational motion of the new bond formed (HF). The former can be determined experimentally by keeping a closed system during the reaction and comparing the pressure before and after the reaction. Since the number of species is the same on both sides of the reaction, if there is additional translational energy afterwards, this would lead to an increased pressure on the walls of the container. The vibration of the formed bond can be analysed by using spectroscopy (if the molecule produced is IR/Raman active). If there is reaction energy that is released by vibrational means, the wavenumber's standard value and the wavenumber of the bond after the reaction would be different.
Q: Setup a calculation starting on the side of the reactants of F + H2, at the bottom of the well rHH = 0.74, with a momentum pFH = -0.5, and explore several values of pHH in the range -3 to 3 (explore values also close to these limits). What do you observe?
Q: Discuss how the distribution of energy between different modes (translation and vibration) affect the efficiency of the reaction, and how this is influenced by the position of the transition state.
A potential energy surface doesn't show the chemical reaction itself, but rather what happens to the energy and distance of the bonds and atoms involved over the course of the reaction. The predefined momenta and distance values determine whether or not the reaction is successful, and it can also be attributed to the modes of energy that the initial momentum is converted into. The relative distances (position) at which the transition state occurs can also be found (see sections 1.2 and 2.2) on the PES. This is important in determining which of the two modes, translational or vibrational energy, would lead to a more efficient reaction. [3]
There are two 'types' of transition states; early or late. The former is closer to the reactants whereas the latter is closer to the products. Considering that each system has the same amount of energy at the start, having different distributions of vibrational and translational energy can change whether the reaction proceeds or not. The following set of empirical rules were proposed by Polanyi.
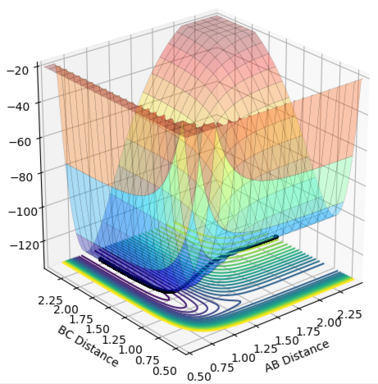
Reactants with more translational energy are more likely to proceed through an early transition state than those with more vibrational energy. For example, in Fig. 16, the transition state is early and so it would be beneficial to have more translational motion at the start in order to cross the activation barrier. For example, the transition state in fig. 18 is early (the same as that in fig. 23) and the molecule's main mode of energy is vibrational. It does not have enough translational energy to cross the barrier and is repelled backwards.
On the other hand, reactants with higher proportions of vibrational energy are increasingly likely to pass through a late transition barrier. The PES is curved (the relative curvature/angle is dependent on the molecules and atoms involved) and the wall to wall vibration allows the system to reach the curved area, cross the transition state and enter the product region without bouncing off the wall back into the reactant region.
Combining the above idea with Hammond's postulate, it can be concluded that it would be more efficient to have more translational energy to cross the activation barrier for an exothermic reaction, whereas vibrational energy would be more effective in surpassing the barrier for an endothermic reaction. This is because an exothermic reaction has an earlier transition state and an endothermic reaction has a late transition state.
Fig. 23 - The position of the transition state for F + H2 -> H + HF

