MRD:mn915
H + H2 system
Dynamics from the transition state region
The transition state (TS) is defined as the maximum point in the minimum energy path of a reaction. In the reaction pathway, there are some local minimums corresponding to the energy state of both reactants and products. Also, there is a maximum point energy where, in this particular system, the reaction is in its half way through completion. This point corresponds to the transition state. However, calculating this point is not as straightforward as observing that. In the potential energy against the H-H distance in the surface plot, the answers to the following equation determines the local minima and maxima, but it does not give us enough information to decide whether a point is maximum, minimum, or a saddle point.
Once the answers of the equation above are found, they should be put into the second derivative of the potential energy with respect to internuclear distsance to obtain the exact type of those points. The below table shows the corresponding answers for each point.
| Type | Sign of |
|---|---|
| Maximum | Negative |
| Minimum | Positive |
| Saddle point | Negative and Positive |
Trajectories from r1 = r2: locating the transition state
To find the transition state, the dynamic method must be utilised in order to find the maximum point by following the pathway and without choosing the minimum possible energy at each instance. The internuclear distances should be the same at the transition state as the reactants and products are indentical and the only involving atom in the reaction is hydrogen. When the distances are equal, and the initial momenta are zero, the estimation for the location of the TS can be started. Several values should be tested and the success in determining the exact coordinate of the TS could be obtained by reducing the length of the pathway shown in either contour or surface plots of the reaction.
The graph below, acknowledges that the input values correspond to the transition state. In this system, rAB = rBC were set at 0.90775 Å.
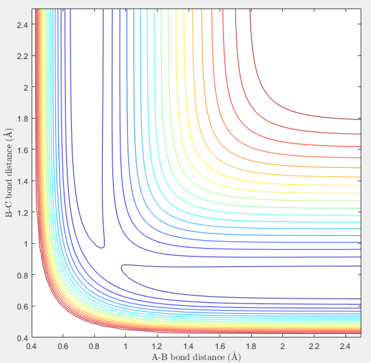
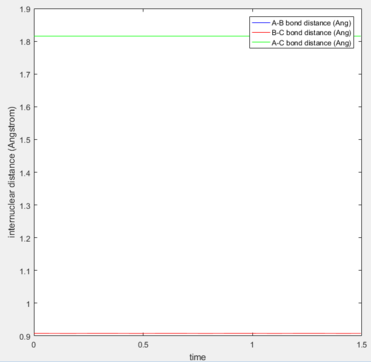
In addition, further tests can be accomplished to ensure that the estimated values are correct and the values do correspond to a point in the graph (and the entries are not outside the graph). To do so, the plot of internuclear distance against time can be analysed, and if the vibrations between the nuclei are at the lowest possible states (straight line), it can be verily deduced that the point is consistent with the TS conditions. In the graph shown below, no vibrations in the bonds can be seen, and the change in distance against time is equal to zero at each point. Furthermore, as the A-B and B-C distances are the same in the TS of this system, their lines lie on each other in the plot, so only one of them can be observed below.
Trajectories from r1 = rts+δ, r2 = rts
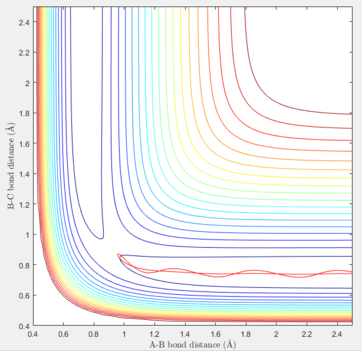
If one of the internuclear distances are set to a value differing slightly with the value of the TS, the reaction proceeds to either the reactants state or the products state. If we change one of the rH-H values to 0.91 Å, and keep the second one unchanged, we can observe that the pathway would be half-completed, while the other half of the reaction is not done because the starting point was adjusted at the TS and it could go down only in one of the two ways.
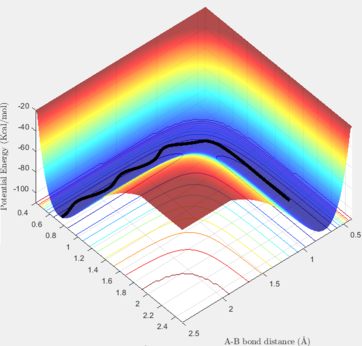
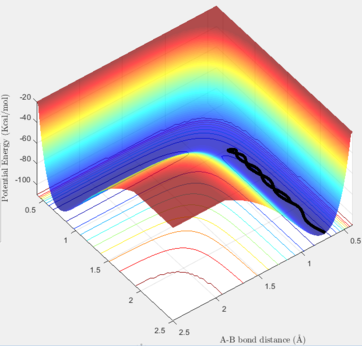
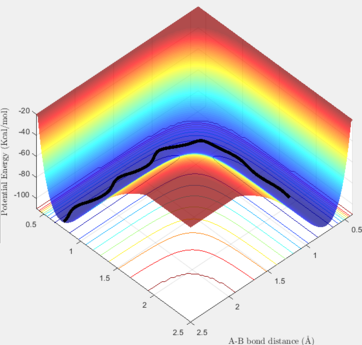
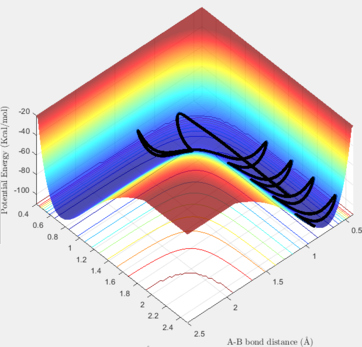
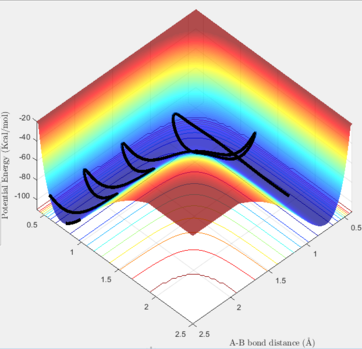
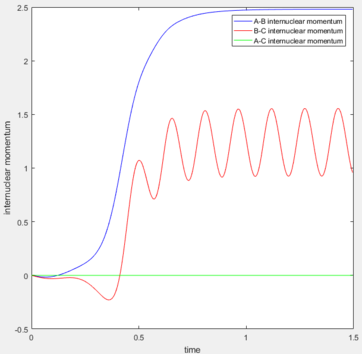
In the Dynamic method, if we slightly displace one of the hydrogen atoms, the proceeded half way is shown including the vibrations of the H-H bond in the given time period. Thus, as it can be seem below, the pathway from the TS to the reactants is not a straight line and it has some considerable variations in its energy. On the contrary, if the calculation method is set at MEP (Minimum Energy Pathway), those vibrations are not observable anymore, and a straight line is shown instead. The MEP method takes the minimum potential energy at every time step by setting the instant velocity to zero. The MEP analysis is also illustrated below. In the Dynamic and MEP methods, the plots of momenta against time are totally different. The momenta of all species in the MEP method is zero because at every time step, the velocity is set to be zero, so the momentum will be set to zero consequently. In the Dynamic method, the momentum of H-H follows a sinusoidal pattern which corresponds to the vibrations of this bond and the resulting kinetic energy variations.
| Method\Plots | Surface | Momenta vs. Time |
|---|---|---|
| Dynamic |  |
 |
| MEP | 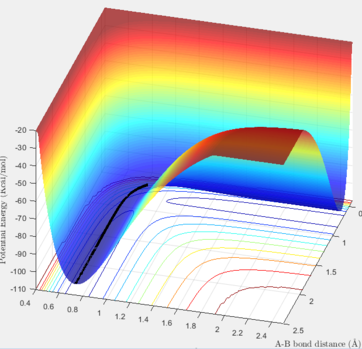 |
 |
Also, if we setup a calculation in the Dynamic method where the initial positions of the above situation is replaced with its final positions, the trajectory starts from the reactants but as soon as it reaches the TS point, it
reverses and comes back to the reactants state. The final positions of the trajectories listed in the above table could be found form the plots of momenta and distance against time.
| Distance | Momentum | |
|---|---|---|
| AB | 5.281 | -2.481 |
| BC | 0.7423 | -1.255 |
Reactive and unreactive trajectories
Nf710 (talk) 18:32, 2 June 2017 (BST) You havent talked about energies here. you have just looked at the reaction coordinate
F + H2 and H + HF systems
The reaction between H and HF can be energetically classified by looking at its potential energy surface. As it can be seen in the below graph, this reaction is endothermic because the energy state of the products is higher than the energy state of the reactants. From this point, it we can also conclude that the bond strength of F-H is larger than of H-H. For F and H2, contrarily, it can be seen that the reaction is exothermic. In the graph below, we can assume that the right hand side corresponds to the energy level of the reactants (F and H2) and the left hand side is where the products (HF and H) are present.

Approximate position of transition state
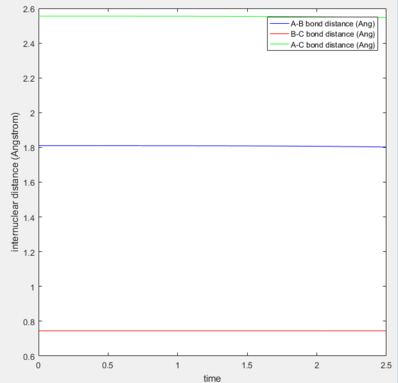
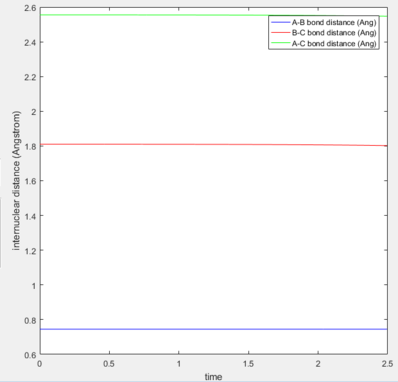
The same method of finding the TS was applied to find the coordinates corresponding to the TS of these two reactions. In thses two systems, the TS position is not located in the middle of the pathway due to energy difference between the reactants and the products. In the estimations, the values were found according to the the Hammond's postulate stating that the TS is closer to the products in endothermic reactions and closer to the reactants in exothermic reactions. In the table exhibited below, the surface, contour and distance vs. time plots are included to justify the accuracy of the TS coordinates.
| Surface / Contour plot | Internuclear distance vs. Time | A-B distance | B-C distance | |
|---|---|---|---|---|
| F + H-H | 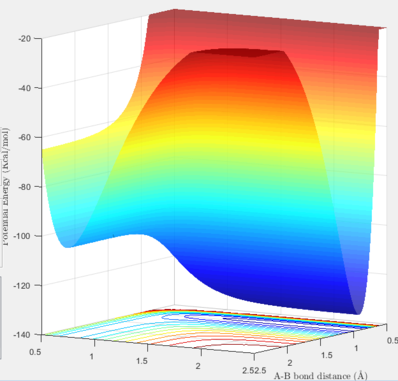
|
|
1.8103 | 0.7449 |
| H + H-F | 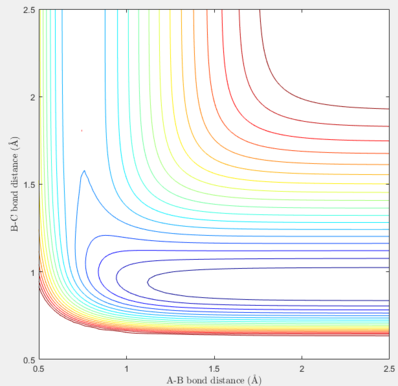
|
|
0.7449 | 1.8103 |
Activation energy of the reactions
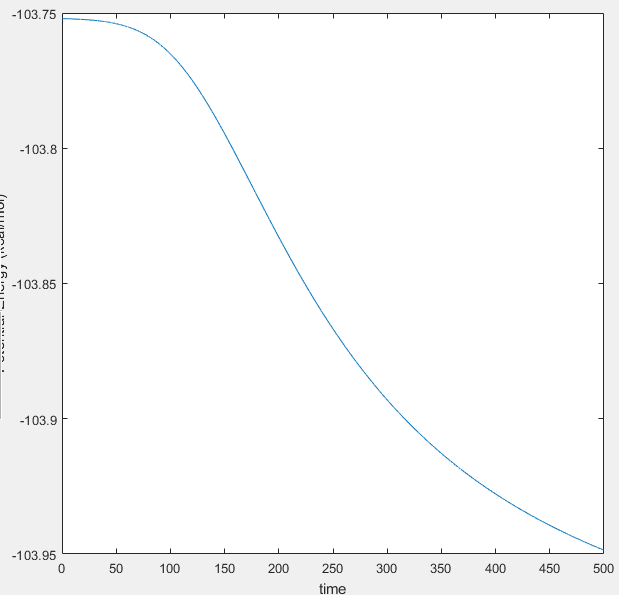
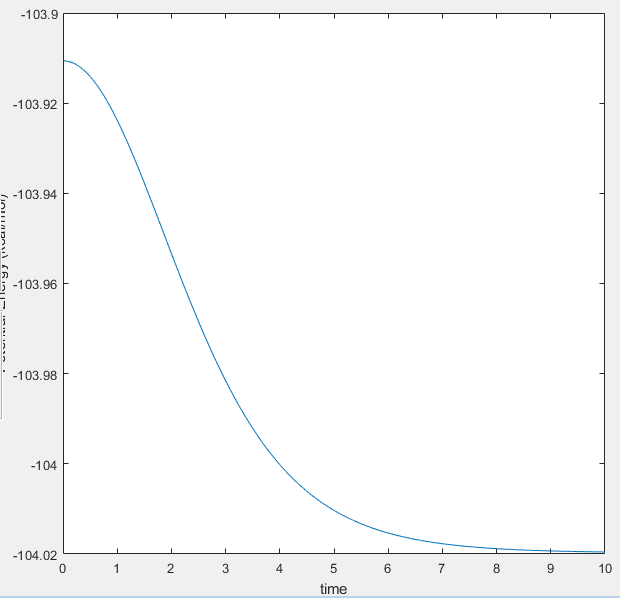
The activation energy of these reactions can be found using slight alteration of the TS coordinates resulting in a trajectory starting from the TS to the nearest energy state (either products or reactants). From this point, the MEP calculation should be utilised to minimise the vibrations which affect the potential energy. However, the MEP method fails to show the very low potential energies of either states. MEP works with the changes of gradient in the potential energy vs. time, and where the changes in potential energy against time decrease to zero, it does not show the rest of the PE vs. t graph. To complete the calculations, the Dynmaic method must be used with the initial conditions equal to the final conditions of the MEP method. The two relevant graphs and a table containing the activation energies are indicated below.
| MEP method | Dynamic method |
|---|---|
|
|
| Activation Energy (Ea)/Kcal.mole -1 | |
|---|---|
| F + H-H | 0.2675 |
| H + H-F | 30.81 |
Nf710 (talk) 18:39, 2 June 2017 (BST) Well done dynamics gives a better answer
Reaction Dynamics
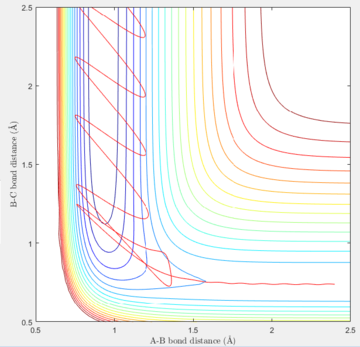
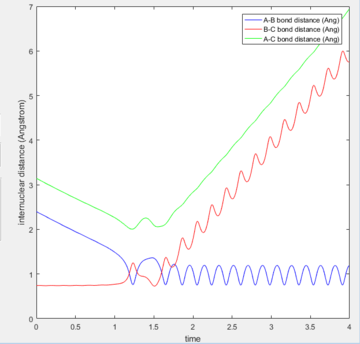
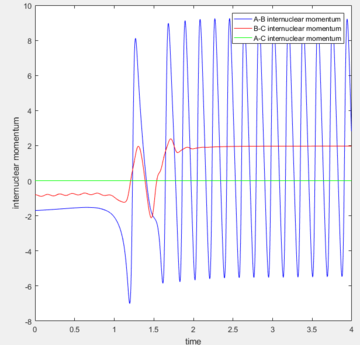
Reactive Trajectories for F + H-H system
| Internuclear distance | Momentum | |
|---|---|---|
| F-H | 2.4000 | -1.7 |
| H-H | 0.7401 | -0.8 |
| Contour plot | Internuclear distance vs. Time | Momenta vs. Time |
|---|---|---|
|
|
|
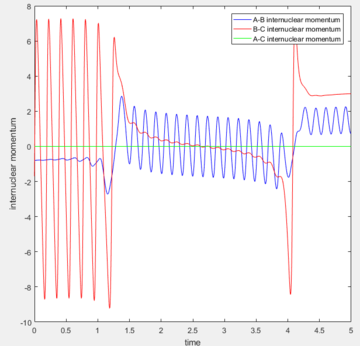
The energy is conserved, so the vibrational energies of the products are obtained from the initial kinetic energy of the reactants as well as their initial vibrational energies. In the F and H2 reaction, the mechanism of the energy release can be confirmed experimentally by IR spectra of the reactants and products. As H-H is totally symmetric, there is no IR band for it, but there is a vibrational band for the H-F stretch which can be taken into account for the mechanism discussions.
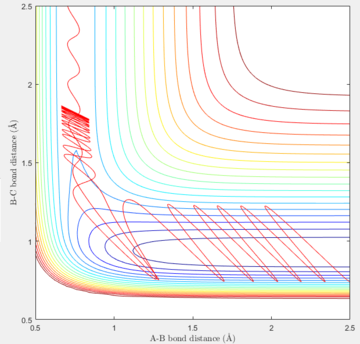
Reactive Trajectories for H + H-F system
| Internuclear distance | Momentum | |
|---|---|---|
| H-H | 2.50 | -0.8 |
| H-F | 0.741 | -1.7 |
| Contour plot | Momenta vs. Time |
|---|---|
|
|
Nf710 (talk) 18:41, 2 June 2017 (BST) You obviously ran out of time here as you havent fully completed this section

