MRD:mmo116
Exercise 1: H + H2 system




What value do the different components of the gradient of the potential energy surface have at a minimum and at a transition structure? Briefly explain how minima and transition structures can be distinguished using the curvature of the potential energy surface.
A potential energy surface shows how the potential energy of a system changes with changing interatomic distances. It can be used to follow a chemical reaction and to identify minimum energy states and transition states. The gradient of the potential energy surface (i.e. its first derivative) is 0 at both minima and transition states. The second derivatives are able to identify whether the stationary point is a saddle point, and hence a transition state, or a minima. If it has a positive value in both the x and y directions then the point is a minimum potential energy state and if it is positive in one direction and negative in the other, it is a transition structure. These can be sometimes be seen by eye where the transition state is the top of a peak in the trough and a minimum would be the very bottom of a trough.
Report your best estimate of the transition state position (rts) and explain your reasoning illustrating it with a “Internuclear Distances vs Time” plot for a relevant trajectory.
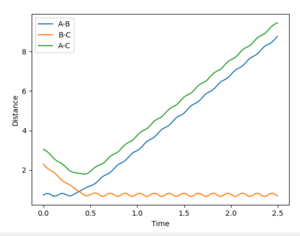
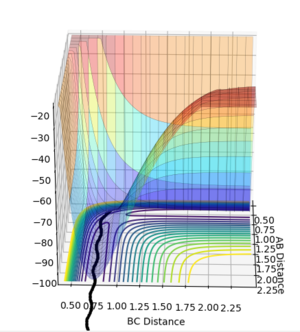
We're looking at H + H2 so all the atoms in the system are the same and it's symmetric. This means at the transition state r1=r2=rts. Both momenta will be 0 kgm/s because it's a stationary point. Using a trial and error method, with an initial guess of rts where A-B and B-C cross in Figure 1 (0.915 Å), the value of rts was estimated to be 0.910075 Å. The condition given was that if the internuclear distances differed then it was not the transition state.
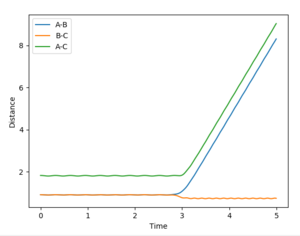
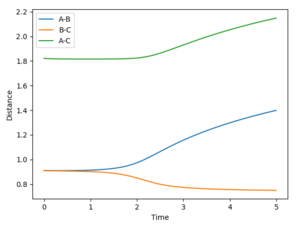
In order to get the best estimate, a graph with A-B and B-C with the exact same line is ideal. This is when you can only see one line at the bottom of the graph. The longer the lines stay the same, the better the estimate for the interatomic distance at the transition state. A result for this was when rts = 0.915 Å but when this was extended to 1000 steps from 500, it was showed that the they did not stay the same after about 2.8 seconds, so the estimate could be improved (Figure 2). The final value, which showed A-B and B-C being equal at 1000 steps was 0.910075 Å (Figure 3).
Mm10114 (talk) 18:09, 25 May 2018 (BST) Very good explanation how you have found transition state and you provide the necessary figures. However, are you sure the unit of time is here a second? Why don't you have a look in the literature what length current state-of-the-art molecular dynamics calculations have. I can give you a hint it is order of magnitudes lower than a second.
Comment on how the minimum energy path (mep) and the trajectory differ.
The starting positions were set as:
A-B distance: 0.920075 Å
B-C distance: 0.910075 Å
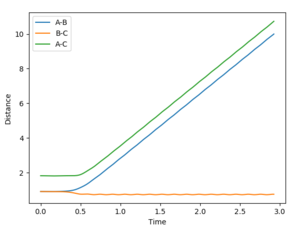
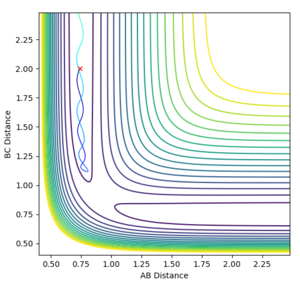
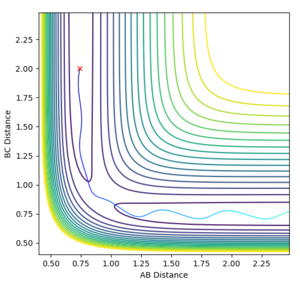
So slightly away from the transition state. The mep then shows the lowest energy pathway of the molecule B-C forming - so the distance between the two atoms gets smaller - and the distance between B and C gets larger (Figure 4). It is a straight line with no oscillations (Figure 6).
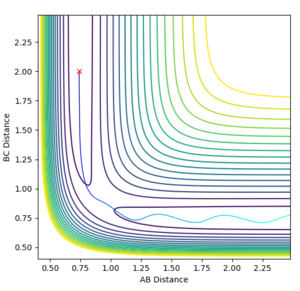
The trajectory is the actual path the atoms take. It's an oscillating line showing the same trends, just with vibrations in the bond (Figure 5) so in actuality they do not follow the minimum exactly It looks to the atoms rolling up and down the surface plot (Figure 7).
Other differences between the mep and the trajectory is that the trajectory has much less smooth transitions. The distance between A and B increases much more quickly - the gradient is steeper in Figure 5 - and thus, it ends with much larger distances between the two atoms. It also is a straight line rather than a curved line like in the mep. This makes sense because after a certain distance the atom and the molecule stop interacting and so move off at a constant speed. The mep shows the rate of change of distance between the atom and molecule tailing off which is unrealistic as they will have gained momentum going in opposite directions and the mass does not change so they'll keep moving at a constant speed with out other forces acting on them.
For both the mep and the trajectory, the distance between B and C remains pretty much constant after the atom and the molecule split off from eachother - disregarding the slight oscillations in the trajectory. This is to be expected as there is a bond between the two so the distance will not change much and also explains why the gradient of the trajectory is greater than the mep - an actual bond has been formed.
The final values of distance at 2.5 seconds are:
r1= 9.0278 Å
r2= 0.7680 Å (Figure 5)
The average momenta at large t is:
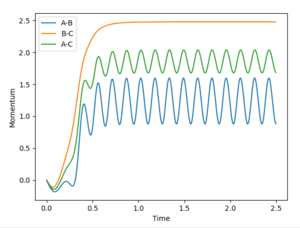
p1=2.4868 kgm/s
p2=1.2465 kgm/s (Figure 8)
Changed initial conditions so r1 = rts and r2 = rts+0.01 Å instead?
The same pattern can be seen - just with A-B and B-C switched on the graph (Figures 9 and 10). This makes sense because of the symmetry in the system. The trajectory follows a path in the y-direction instead of the x but it is an equivalent path just with A and B as the molecule and C as the atom instead of B and C being bonded like before. The starting position was switched to the other side but by the same quantity so the direction is all that has changed.
When initial positions are set to the final positions of the trajectory and the initial momenta values are the same as the final momenta values, with reversed signs.
r1= 9.0278 Å
r2= 0.7680 Å
p1=-2.4868 kgm/s
p2=-1.2465 kgm/s
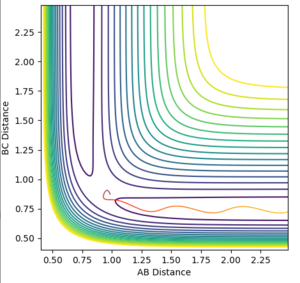
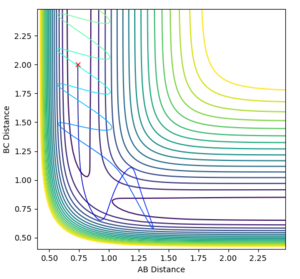
The contour plot (Figure 11) shows the trajectory with these switched conditions.
We've placed the atoms at their final positions from before and given them enough momentum in the right direction to get back to the transition state. What you actually see is when they get to the close to the transition state, they don't have enough energy to overcome the energy hill and move over to the other side and they look like they're starting to roll back down the hill again. As they've been given the same momenta (in the opposite direction) and position, you'd expect the system to have the exact right conditions to get the the transition state and stay at the stationary point. This would need the EXACT values of all parameters to be the case and we have only a good estimate for the actual transition state structure and the final positions from before.
Reactive and unreactive trajectories
| p1 / kgm/s | p2 / kgm/s | Total Energy / kcal/mol | Reactive/Unreactive Trajectory |
|---|---|---|---|
| -1.25 | -2.5 | -99.018 | Reactive |
| -1.5 | -2.0 | -100.456 | Unreactive |
| -1.5 | -2.5 | -98.956 | Reactive |
| -2.5 | -5.0 | -84.965 | Unreactive |
| -2.5 | -5.2 | -83.416 | Reactive |
All paths start with A and B bonded to each other and C as a separate atom.
Figure 12: 1) There is no oscillation between A and B. They're the same molecule and have been set at a certain distance apart with zero momentum relative to each other. As the atoms get to the transition state, they begin to interact with each other and oscillation begins. They all have enough momentum to overcome the energy barrier at the transition state and so B and C are bonded, leaving A as a single atom. The reaction has occurred. This oscillates - the two atoms in the molecule have different momenta.
Figure 13: 2) Here molecule A-B has a slightly higher momentum but BC is less. The molecule AB does oscillate. There is not enough energy to get to the transition structure, never mind over it. This means that although the molecule and the atom get close, they just repel each other when they do and so no reaction occurs.
Figure 14: 3) Here the molecule A-B is oscillating. It's a similar set up as in number 2 but this time the system has enough energy to get over the transition state energy barrier. So the reaction occurs and A becomes a single atom repelled by the molecule B-C.
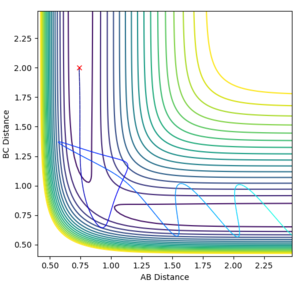
Figure 15: 4) Initially molecule A-B isn't oscillating for the same reason as number 1. Both momenta have been increased and the system is able to get over the transition state but as it rolls up the energy surface on the other side, it then rolls back over the transition state - as it has enough energy to get back over the barrier - and so molecule A-B is reformed and C remains a single atom at the end.
Figure 16: 5) Here's an example like number 4 but BC is an even larger momentum. There's enough energy to get over the transition barrier to form molecule B-C, it rolls back over the transition state to form A-B again but still has enough energy to go again over the transition state so the final system has molecule B-C and atom A. The reaction has occurred.
State what are the main assumptions of Transition State Theory. Given the results you have obtained, how will Transition State Theory predictions for reaction rate values compare with experimental values?
The main assumptions of Transition State Theory are as follows:
1) Nuclear and electronic motions are separate - like the Born-Oppenheimer approximation.
2) The Maxwell-Boltzmann distribution is how the molecules are distributed.
3) Once the system has crossed the transition state, it will not go back to form the products.
4) When at the transition state, the motion in the direction of the reaction coordinate is translational motion and is separate from all other forms of motion. [1]
Previous calculations show that these assumption are not accurate to reality. In particular number 3 is incorrect as can be seen in the fourth and fifth tests in the previous question - the system does revert back to products after crossing the transition state.
Due to this, Transition State Theory is likely to overestimate the rate of reaction compared to experimental rates because in actuality systems can go back and fourth between products and reactants before finally completing the interaction (as in number 5 in the previous question) which will take longer than the system only overcoming the activation energy barrier once and then going straight to the products. However, transition State Theory treats the particles according to classical mechanics so some rates would be underestimated if quantum tunneling were to occur.
Exercise 2: F - H - H system



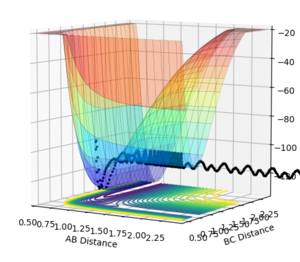
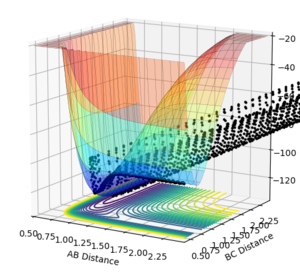


PES inspection
Classify the F + H2 and H + HF reactions according to their energetics (endothermic or exothermic). How does this relate to the bond strength of the chemical species involved?
Figure 17: A-B corresponds to HF and B-C corresponds to H2.
When A-B is small - the energy is lower than when B-C is small. This means that the F + H2 reaction is exothermic and H + HF reaction is endothermic, as it has to be due to it being the reverse reaction.
Bond breaking needs energy and bond energy releases energy. Because the H+HF reaction overall takes in energy and the F + H2 reaction releases energy overall, the HF bond is stronger than the H2 bond.
Locate the approximate position of the transition state
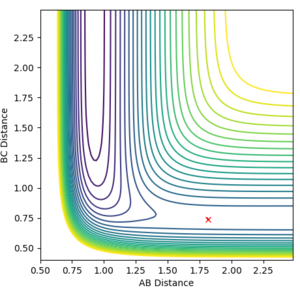
Hammond's postulate says the transition state structure will be closer to the products' structure in an endothermic reaction. Because AB is the bond that's broken and corresponds to the H-F bond length and it's the bond being broken, you'd expect the transition state to resemble H2 more closely, hence the BC distance will be smaller. The initial guess for the transition state was r1(AB)= 1.5 Å and r2(BC)= 0.5 Å. The outcome of this can be seen in Figure 18. The best estimate would have no path line and just a cross so a much better guess was needed.
After a series of trial and error the best estimate was r1(AB)= 1.81412 Å and r2(BC)= 0.73915 Å (Figure 19)
Report the activation energy for both reactions.
The energy of the transition state = -103.739 kcal/mol.
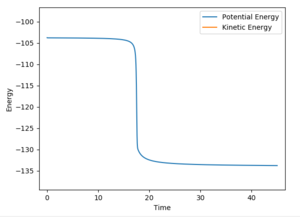
An MEP with 9000 steps of the following conditions was calculated and an energy vs time plot was made: (Figure 20)
AB = 1.7 Å
BC = 0.73915 Å
The final energy was -133.443 kcal/mol meaning the activation energy of the HF + H was -103.739-(-133.443)=29.704 kcal/mol.
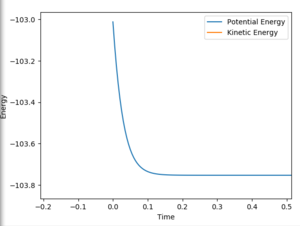
The second activation energy was calculated using the following conditions using the same method (Figure 21):
AB=1.81412 Å
BC=0.79 Å
The final energy was -103.009 kcal/mol meaning the activation energy of the H2 + F was -103.009-(-103.739)=0.73 kcal/mol. This was the bets estimate however, the further the BC distance was from the transition state, the larger the activation energy became so it is hard to know which is right.
Reaction Dynamics
In light of the fact that energy is conserved, discuss the mechanism of release of the reaction energy. How could this be confirmed experimentally?
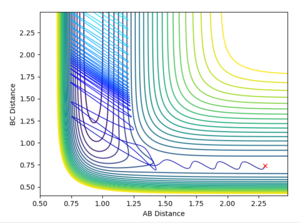
The reactive trajectory I've plotted (Figure 22) is as follows:
AB=2.3 Å
BC=0.74 Å
AB Momentum = -2.3 kgm/s
BC Momentum = -2 kgm/s.
There are smaller oscillations between the H2 molecule than the HF molecule when it has been formed. This could clearly be seen in the animation also. Figure 23 shows both the kinetic and potential energies of the trajectory. You can see that the potential energy and the kinetic energy are mirror images of one another so when the kinetic energy increases the potential energy decreases - the energy is conserved. As the potential energy overall decreases and the kinetic energy increases, the mechanism for the release of reaction energy is from potential to kinetic energy. The kinetic energy increasing is to do with the release of heat by the exothermic reaction (we have calculated the H2 + F reaction).
This could be determined experimentally using calorimetry.
Mm10114 (talk) 22:36, 28 May 2018 (BST) Why calorimetry? That needs explaining.
Discuss how the distribution of energy between different modes (translation and vibration) affect the efficiency of the reaction, and how this is influenced by the position of the transition state.
Polanyi's empirical rules say that having more vibrational energy means a late transition state is better to overcome and therefore, with more translational energy the system is better able to overcome an early transition state.[2]
This is illustrated in Figures 24 to 27.
The H2 + F reaction has an early transition state. In these calculations, r1 (AB) momentum corresponds to translational energy and r2 (BC) momentum corresponds to vibrational energy.
Figure 24 shows a system with high vibrational energy and low translational energy - it doesn't react. However Figure 25 shows a system with the opposite - a low vibrational energy and high translational energy and the reaction does happen so it's an efficient reaction.
On the other hand, the reverse reaction (HF + H) has a late transition state. In these calculations, r1 (AB) momentum corresponds to vibrational energy and r2 (BC) momentum corresponds to translational energy.
Figure 26 shows a system with high vibrational energy and low translational energy and it does react. It's an efficient reaction. Figure 27 is the opposite case with low vibrational energy and high translational energy and the reaction doesn't happen.
These cases follow Polanyi's empirical rules.
