
MRD:mmn115 Transition Structures
Introduction
Transition state, minimum and the potential energy surface
A potential energy surface illustrates a way in which the energy of a molecular system varies in response to small changes in the structure. It shows the relationship between the structure of a molecule and the resulting energy[1].
A transition state is a stationary point in a potential energy surface (PES). It is a first order saddle point, the highest energy point on the reaction coordinate. The reaction coordinate is the lowest energy pathway linking the reactants and the products[2].
A minimum in the PES is also a stationary point, but at which the molecule has the lowest potential energy. Hence, the molecule is relatively stable at the minimum, so at minima you can find reactants, products, intermediates, etc., as shown in Figure 1 below.

How do we differentiate between the transition state (TS) and minimum? Since both are stationary points, the gradient will be equal to zero, so the first derivative will be equal to zero for both of them. So in order to differentiate between the two, we must look at the second derivative. For a minimum, the curvature is positive so the second derivative is >0. For the TS, the curvature is negative, as it is a maximum, so the second derivative will now be <0.
In other words, the transition state is a minimum in all directions but one, in which it is a maximum [3]. This implies that the vibrational spectrum of a TS will have one imaginary frequency, and therefore one negative force constant. The order of the saddle point defines how many imaginary frequencies will be present, ie. since the TS is a first order saddle point, it will have one negative frequency [4]. This information can be used to verify if the stationary point is a transition state by performing a frequency calculation on the optimised structure.
Nf710 (talk) This is a really good explaination. You could have added how in Gaussian the PES is in 3N-6 degrees of freedom dimensions. which are then linearly combined to form the normal modes
The Diels-Alder and Cheletropic reaction
The Diels-Alder reaction is a [4+2] cycloaddition of a diene and a dienophile. It is an electrocylic reaction that involves 2π-electrons of the dienophile and 4π-electrons of the diene. Three pi-bonds are broken and two new σ-bonds and one π-bond are formed. As sigma bonds are stronger than the π bonds, the reaction is thermodynamically favourable [5]. As the mechanism is concerted, the reaction is stereospecific with respect to both the diene and the dienophile. The product can be either endo or exo. When the diene and dienophile are placed directly above each other, the endo product is formed. When one of the reactants is 'staggered', not overlapping with the other reactant, the exo product is formed (Figure 2).

A cheletropic reaction is a pericyclic reaction in which two sigma bonds terminating at a single atom are made, or broken, in a concerted fashion[6]. There is an increase in coordination number at the single atom. An example of a Cheletropic reaction is showed in Figure 3 below.

.
Gaussian
In the calculations in this report, we are going to use two of the many modelling methods available in Gaussian 09: semi-empirical and Density Functional Methods (DFT). The major difference between those two methods is the accuracy with which they perform the calculations. As semi-empirical methods are faster, they are usually used for larger molecules (Figure 4)[7].

Semi-empirical methods iare the fastest electronic structure method. They compute models using severe approximations in order to increase the speed of the calculations. They also use parametrised integrals in order to improve the accuracy of the results [8]. The way in which these integrals are parametrised defines the particular semi-empirical method: PM6, PM3, AM1, etc. Semi-empirical methods are simplified versions of the Hartree-Fock theory and use empirical, ie. derived from experimental data, corrections in order to improve the accuracy [9].
21:45, 30 November 2017 (UTC) Completey correct well done.
DFT methods are based on the Hohenberg-Kohn theorem, which states that all ground state calculations can be made as a functional of the electron density [10]. The functional is unknown, so DFT methods add another major step to the Hartree-Fock calculation: the numerical integration of the functional. The larger the number of points used in the integration, the more accurate the result[11]. This step increases the accuracy of the model but also slows down the calculation. Therefore, when optimising molecules, the semi-empirical method is usually used first, followed by a DFT method, in order to increase the speed of the calculation.
Nf710 (talk) 21:45, 30 November 2017 (UTC) OK good but not quite right. In DFT he Hamiltonian are calculated wrt. the electron density. the Kohn Sham theorem calculates all the orbitals as if they are not interacting and then leaves a mystery term called the exchange correlation to account for the interaction. Which different functional treat differently. B3LYP is a hybrid functional as it treats the XC with the use of an addition Hartree Fock calculation.
Another useful function of Gaussian is the Intrinsic Reaction Coordinate (IRC). It is related to the minimum reaction pathway, which is the "steepest descent pathstarting from the transition state and going in the direction of the negative curvature" . The path goes from the transition state to both the reactants and the products (both ways). The IRC shows you whether you have really found a transition structure that connects the products and reactants of the reaction, ie. the two minima. It is defined in terms of the mass-weighed Cartesian coordinates and has a specific number of steps[12] . By default, the number of steps (N) is set to 10, however, in these calculations, N=100.
Exercises
Exercise 1. Reaction of butadiene with ethylene
Files used
butadiene optimisation, PM6 Media:EXERCISE1_BUTADIENE_OPT_TRIAL1_PM6_MOS.LOG
ethylene optimisation, PM6 Media:EXERCISE1_ETHYLENE_OPT_TRIAL1_PM6_MOS.LOG
reactants optimisation, PM6 Media:EXERCISE1_REACTANTS_MIN_OPT_TRIAL1_PM6.LOG
TS optimisation to minimum, PM6 Media:EXERCISE1 TS OPT TRIAL3 PM6.LOG
TS optimisation, TS Berny, PM6 Media:EXERCISE1 TS OPT PM6 MOS TRIAL1.LOG
IRC, PM6 Media:Exercise1 ts IRC trial4 pm6 opt.LOG
products optimisation, PM6 Media:EXERCISE1 PRODUCT OPT PM6 TRIAL1.LOG
Method
The reactants and the TS were optimised at the PM6 level (minimum followed by TS Berny for the TS, keyword for TS Berny optimisation: opt=noeigen). The correct TS was confirmed by performing a frequency analysis and an IRC (PM6, force constants set to always calculate, N=100, calculate in both directions). One negative vibration at -948.02 was obtained, which verifies the TS. Furthermore, the IRC confirms the formation of the product. Next, the product (final step of the IRC) path was optimised to a minimum at the PM6 level.
Reaction
In this exercise, the reaction between butadiene and ethylene was studied. It is a [1,4]-cycloaddition of a diene and a dienophile, called the Diels-Alder reaction. The diene is butadiene and the dienophile is the ethylene. The reaction scheme is shown in Figure 5 below.

The reactants, the TS and the products were optimised using the PM6 semi-empirical method. The TS was confirmed by an IRC and a frequency analysis. The imaginary frequency for the TS is -948.02.
MO diagram
If we have a look at the HOMO and LUMO TS visualisation, we see that both the HOMO and the LUMO are symmetric (Figures 13 and 14). This means that the two orbitals of diene and dienophile that overlapped to give the HOMO and the LUMO of the TS must be symmetric as well. This implies that the symmetric (s) LUMO of butadiene interacts with the symmetric (s) HOMO of ethylene, which is shown in the MO diagram below. Furthermore, MO16 (HOMO-1) and MO 17 (LUMO+1) of the TS are antisymmetric. This implies that the antisymmetric (a) HOMO of butadiene interacts with the antisymmetric (a) LUMO of ethylene.

(Fv611 (talk) Your MO energy levels are wrong. As you haven't included the JMols, I cannot tell whether you have calculated them wrong or simply not adjusted the MO diagram according to the energies you calculated. The HOMOs of both the reactants are lower in energy than the TS HOMO-1, and the Ethene LUMO is higher in energy than the TS LUMO+1. Additionally, the linear combination of Fragment MO that are in phase lead to a more stable TS orbital than the combination of FMOs that are out of phase, whereas you have drawn the HOMO-1/LUMO+1 and HOMO/LUMO couples the wrong way around. You would have avoided this if you had paid closer attention to your orbital drawings and their respective pictures in the gallery below, where you can see which MOs are a result of in-phase interactions.)
Hence, we can see that orbitals of the same symmetry will react with each other, ie. symmetric with symmetric and antisymmetric with antisymmetric. As there is no significant interaction between orbitals of different symmetry (antisymmetric-symmetric) the overlap integral will be zero for this pair. When the overlap integral is zero, that means that the orbitals are too far apart to interact (Figure 7). If the orbitals or of the same symmetry (symmetric-symmetric or antisymmetric-antisymmetric), there are significant interactions and the overlap integral will be non-zero.

The visualisations of the relevant orbitals are shown below, together with the diagrams of the MOs from the MO diagram above:
- MO visualisations
-
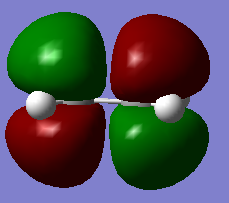 Figure 8a. LUMO of ethylene. visualisation
 -
 Figure 8b. LUMO of ethylene, diagram
 -
 Figure 9a. HOMO of ethylene, visualisation
 -
 Figure 9b. HOMO of ethylene, diagram
 -
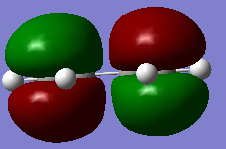 Figure 10a. HOMO of butadiene, visualisation
 -
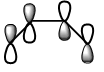 Figure 10b. HOMO of butadiene, diagram
 -
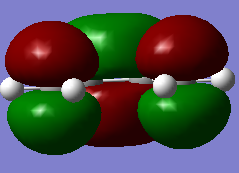 Figure 11a. LUMO of butadiene, visualisation
 -
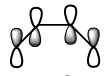 Figure 11b. LUMO of butadiene, diagram
 -
 Figure 12a. MO16 of the TS, HOMO-1, visualisation
 -
 Figure 12b. MO16 of the TS, HOMO-1, diagram
 -
 Figure 13a. HOMO of the TS, MO17, first visualisation
 -
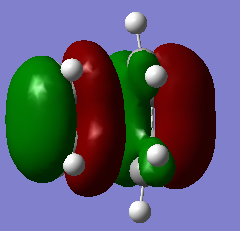 Figure 13b. HOMO of the TS, MO17, visualisation from another angle
 -
 Figure 13c. HOMO of the TS, diagram
 -
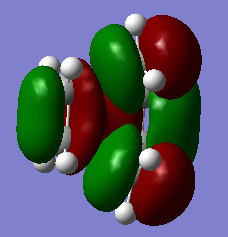 Figure 14a. LUMO of the TS, MO18, first visualisation
 -
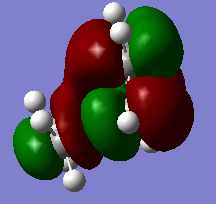 Figure 14b. LUMO of the TS, MO18, visualisation from another angle
 -
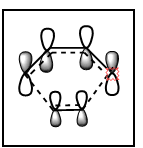 Figure 14c. LUMO of the TS, diagram
 -
 Figure 15a. MO19 of the TS, LUMO+1, first visualisation
 -
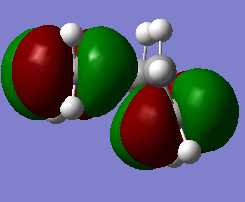 Figure 15b. MO19 of the TS, LUMO+1, visualisation from another angle
 -
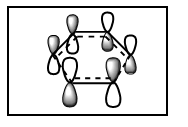 Figure 15c. MO19 of the TS, LUMO+1, diagram


Bond length measurements
Bond lengths were measured in the reactants, TSs and products and the following data was obtained:
Butadiene
C=C bond length: 1.335 Å
C-C bond length: 1.468 Å
Ethylene
C=C bond length: 1.327 Å
TS
C=C bond length (from ethylene): 1.382 Å
C=C bond length (from butadiene): 1.380 Å
C-C bond length (between ethylene and butadiene, where the bonds will form): 2.114 Å
C---C bond length (where the double bond is forming in the cyclohexene): 1.411 Å
Cyclohexene
C=C bond length: 1.337 Å
C-C bond length: 1.500 Å
As the reaction proceeds, the C=C ethylene and C=C butadiene bond lengths increase. As a typical sp2 carbon-sp2 carbon bond length is 1.34 Å, whereas for the sp3 carbon-sp3 carbon it is 1.54 Å [13], it is clear that the carbons change from sp2 to sp3, ie. single bonds are formed in the place of double bonds. The C=C bond length increases from 1.335 Å to 1.380 Å for butadiene, and from 1.327 Å to 1.382 Å for ethylene.
The butadiene C-C bond length decreases from 1.468 Å to 1.411 Å, so the carbons change from sp3 to sp2, ie. a single bond becomes a double bond. The carbons from ethylene and terminal carbons from butadiene approach each other and are located at a 2.114 separation. This is still significantly larger than a typical sp3 carbon-sp3 carbon bond.
In general, as the reaction proceeds, the carbon-carbon bond lengths become more similar to each other in the molecule. This makes sense because 5 out of 6 carbon-carbon bonds in cyclohexadiene are single bonds and will all have the same length.
The van der Waal's radius of a C atom is 1.70 Å [14]. When a new C-C bond is forming, as between the terminal butadiene carbons and ethylene carbons, we would expect the bond length to be 1.70 Å + 1.70 Å = 3.40 Å. However, we can see in the TS that the carbon-carbon bonds forming are significantly shorter than 3.40 Å. This is because the interaction between the carbons is not purely ionic and there is a strong covalent component to the bonding. As a result, the bond length is lower than that predicted by sum of the van der Waals radii. Furthermore, it has been suggested that any attractive force stronger than the van der Waals attraction leads to a shorter internuclear distance [15].
Reaction path at the TS
The vibration corresponding to the reaction path at the transition state has a frequency of -948. This proves that the correct TS has been formed. Transition states will have one negative, imaginary frequency of vibration, which means that in one direction the energy has a maximum, while in all other orthogonal directions the energy is a minimum. The imaginary frequency corresponds in the change in geometry on going from reactnats to products [16]. Hence, we perform a frequency analysis on the TS, and if we get a negative frequency, we have verified that it is indeed the stationary point in the reaction energy profile. The illustration of the vibration mode at the negative frequency for this TS is shown in Figure 16.

Looking at the forward direction of the Intrinsic Reaction Coordinate (IRC), it can be seen that the formation of the two bonds is synchronous. In Figures 17 and 18, two consecutive steps of the IRC are shown. In Figure 17, there are no bonds formed between the reactants. In the following step, Figure 18, both bonds are present. From this it is clear that the two bonds form at the same time.


Exercise 2. Reaction of cyclohexadiene with 1,3-dioxole
Files used
cyclohexadiene optimisation, PM6 Media:EXERCISE2 CYCLOHEXADIENE OPT MIN PM6 TRIAL1.LOG
cycohexadiene optimisation, B3LYP Media:EXERCISE2 CYCLOHEXADIENE OPT MIN B3LYP TRIAL1.LOG
dioxole optimisation, PM6 Media:EXERCISE2 DIOXOLE OPT MIN PM6 TRIAL1.LOG
dioxole optimisation, B3LYP Media:EXERCISE2_DIOXOLE_OPT_MIN_STRAIGHTTOB3LYP_NOPM6_TRIAL1.LOG
reactants optimisation Media:EX 2 REACTANTS OPT PM6.LOG
ENDO
endo product optimisation, PM6 Media:EX2 ENDO PRODUCT OPT PM6.LOG
endo product optimisation, B3LYP Media:EX2 ENDO PRODUCT OPT B3LYP.LOG
endo TS optimisation to minimum, PM6 Media:EXERCISE2 TS ENDO OPT MIN PM6 TRIAL1.LOG
endo TS optimisation, TS Berny, PM6 Media:EXERCISE2 TRANSITIONSTATE BERRY ENDO OPT TRIAL1 PM6.LOG
endo TS optimisation, TS Berny, B3LYP Media:EXCERSIE2 TRANSITIONSTATE ENDO BERRY OPT TRIAL1 B3LYP.LOG
endo, IRC, PM6 Media:EXERCISE2 TSPM6 ENDO OPT IRC PM6 TRIAL2.LOG
EXO
exo product optimisation, PM6 Media:EXERCISE2 EXOPRODUCT OPT MIN PM6 TRIAL1.LOG
exo product optimisation, B3LYP Media:EXERCISE2 EXOPRODUCT OPT MIN B3LYP TRIAL1.LOG
exo TS optimisation to minimum, PM6 Media:EXCERSISE2 TS MINIMUM EXO OPT PM6 TRIAL1.LOG
exo TS optimisation, TS Berny, PM6 Media:EXCERSISE2 TS BERNYTS EXO OPT PM6 TRIAL1.LOG
exo TS optimisation, TS Berny, B3LYP Media:EXCERSISE2 TS BERNYTS EXO OPT B3LYP TRIAL1.LOG
exo, IRC forward, PM6 Media:EXERCISE2 EXO BERNYTS IRC FORWARD TRIAL1 PM6.LOG
exo, IRC reverse, PM6 Media:EXERCISE2 EXO BERNYTS IRC REVERSE TRIAL1 PM6.LOG
Method
The endo and exo products were drawn and optimised to a minimum at PM6 level and then at B3LYP level in order to find the TS. The bonds of the products were broken in a way that resembled what was happening in the reaction. After the bonds have been broken, the resulting structure was optimised to a minimum at the PM6 level. Next, the TS was found by performing a TS Berny (PM6 followed by B3LYP, keyword for TS Berny optimisation: opt=noeigen) calculation on the molecule. The TS was verified by a frequency analysis and one negative frequency was obtained for each of the TS. An IRC has been done on both the endo and exo TS (PM6, force constants set to always calculate, N=100, calculate in both directions). Furthermore, the reactants were optimised to a minimum at the PM6 and B3LYP levels.
Reaction
In this exercise, the reaction between cyclohexadiene and 1,3-dioxole was studied.

Because the diene and dienophile are substituted, the reactants can approach each other from two different sides. This gives rise to stereoselectivity, which can give either the endo or the exo product. If the substituent on the dienophile is directed away from the diene, the product is the exo adduct. If it's directed towards the diene, the product is the endo adduct. It has been observed that the endo product is the prefferred kinetic one. This selectivity can be explained by looking at the transition states. The TSs can be represented using a number of resonance structures (Figure 20), one of which is a zwitterion. The two charges are close to each other in the endo TS which results in an overall stablisation of the TS, and as a result the endo product is kinetically favoured [17].

The TS for both endo and exo were located using the B3LYP/6-31G(d) method (first PM6, then B3LYP). The following imaginary frequencies have been found for the TSs, which confirms that the TS has been formed: exo TS -528.96, endo TS -520.97.
MO diagram
An MO diagram for the reaction has been constructed (Figure 22 below). 1,3-dioxole is an ether, with two electron-donating ether groups. This has two consequences for the MO diagram of this reaction. Firstly, the orbitals of the dienophile have been shifted to higher energies, as the dienophile is now less electronegative than the dienophile in exercise 1. Secondly, when a dienophile has electron-donating groups, like dioxole, we expect inverse electron demand, ie. the HOMO of dienophile interacts with the LUMO of the diene [5].
To confirm that inverse electron demand is taking place, let's have a look at the MO diagram and relevant MO visualisations.

If we have a look at the visualisation of the HOMO and LUMO of the TS, we see that they are both symmetric. Hence, they must be a result of an interaction between two symmetric orbitals in the diene and dienophile. The main interaction that fulfills this symmetry requirement is the interaction of the symmetric HOMO of the dienophile with the symmetric LUMO of the diene. This implies an inverse electron demand.
Furthermore, there is also interaction between the antisymmetric LUMO of the dienophile and the antisymmetric HOMO of the diene to give LUMO+1 and HOMO-1. However, the illustrations of these MOs of the TS have not been included in the MO diagram, as that would make the diagram too messy and these are not the key MOs for the TS. Another point to make about this MO diagram is that the MOs of the endo TS are slightly lower in energy than the MOs of the exo TS. The energies have been computed from the optimised TS and the following values were obtained: -500.332149 and -500.329168 Hartrees for the endo and exo TS, respectively. This is why the MOs of the endo TS are located slightly below those of the exo TS.

(Fv611 (talk) Your MO diagram is good, but doesn't represent the TS MOs relative energies correctly. Both the bonding TS MOs are higher in energy than the diene's HOMO, and both the antibonding's TS MOs are lower in energy than the dienophile's LUMO. Well done on pointing out the differences between the Exo and Endo case.)
- MO visualisations
-
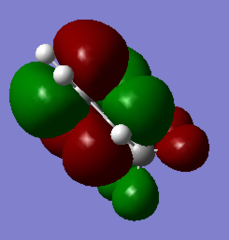 Figure 23a. LUMO of the diene, first visualisation
 -
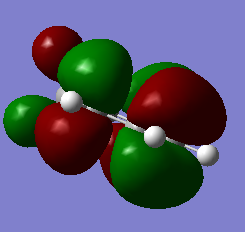 Figure 23b. LUMO of the diene, visualisation from a different angle
 -
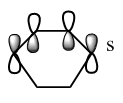 Figure 23c. LUMO of the diene, diagram
 -
 Figure 24a. HOMO of the dienophile, visualisation
 -
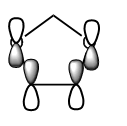 Figure 24b. HOMO of the dienophile, diagram
 -
 Figure 25a. HOMO of the endo TS, first visualisation
 -
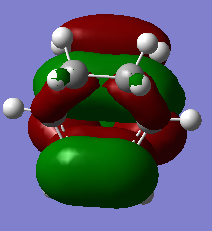 Figure 25b. HOMO of the endo TS, visualisation from a different angle
 -
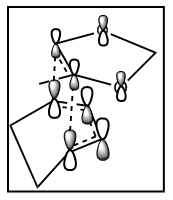 Figure 25c. HOMO of the endo TS, diagram
 -
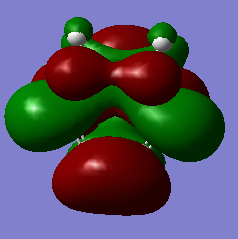 Figure 26a. LUMO of the endo TS, first visualisation
 -
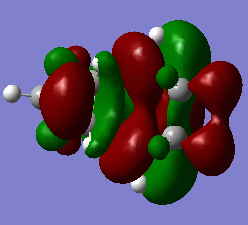 Figure 26b. LUMO of the endo TS, visualisation from a different angle
 -
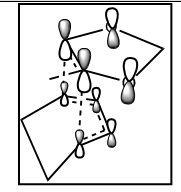 Figure 26c. LUMO of the endo TS, diagram
 -
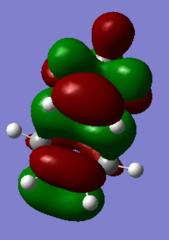 Figure 27a. HOMO of the exo TS, first visualisation
 -
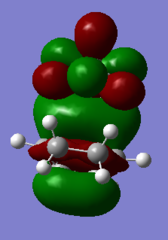 Figure 27b. HOMO of the exo TS, visualisation from a different angle
 -
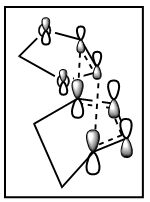 Figure 27c. HOMO of the exo TS, diagram
 -
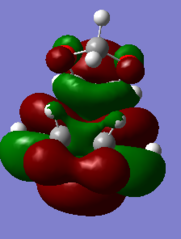 Figure 28a. LUMO of the exo TS, first visualisation
 -
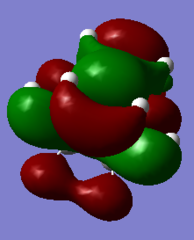 Figure 28b. LUMO of the exo TS, visualisation from a different angle
 -
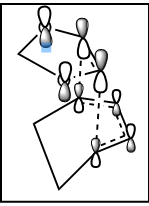 Figure 28c. LUMO of the exo TS, diagram
 -
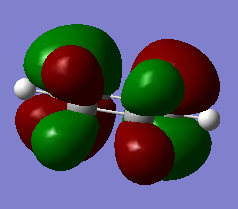 Figure 29a. HOMO of the diene, visualisation
 -
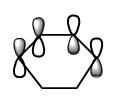 Figure 29b. HOMO of the diene, diagram
 -
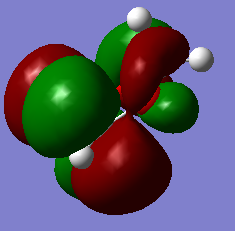 Figure 30a. LUMO of the dienophile, visualisation
 -
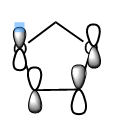 Figure 30b. LUMO of the dienophile, diagram
 -
 Figure 31. HOMO-1 of endo TS, visualisation
 -
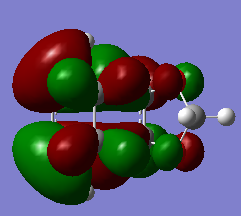 Figure 32. HOMO-1 of exo TS, visualisation
 -
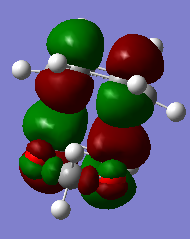 Figure 33. LUMO+1 of endo TS, visualisation
 -
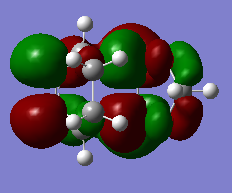 Figure 34. LUMO+1 of exo TS, visualisation


It is confirmed by the visualisation of the HOMO and LUMO of the TS that they are indeed symmetric (Figures 25-28). This confirms that the HOMO of the dienophile is interacting with the LUMO of the diene to give the HOMO and LUMO of the TS, which implies inverse electron demand.
If we look at the HOMO of the endo TS, we can see that there are secondary orbital interactions which are likely to stabilise the endo TS. This is clear in Figure 35 below.

Nf710 (talk) 21:54, 30 November 2017 (UTC) This is not that clear a JMOL would have been better
Thermochemistry
The energies of optimised the reactants, transition states and products were found in order to determine the kinetic and thermodynamic products. The following data was obtained:
| Energy (Hartrees) | Energy (kJ/mol) | |
|---|---|---|
| Cyclohexadiene | -233.321033 | -612584.418806 |
| Dioxole | -267.068642 | -701188.772985 |
| sum of reactants | -500.389675 | -1313773.19179 |
| Endo TS | -500.332149 | -1313622.15727 |
| Exo TS | -500.329168 | -1313614.33065 |
| Endo product | -500.418687 | -1313849.3628 |
| Exo product | -500.417325 | -1313845.78687 |
| Activation energy (Hartrees) | Activation energy (kJ/mol) | Reaction energy(Hartrees) | Reaction energy (kJ/mol | |
|---|---|---|---|---|
| endo DA | 0.057526 | 151.034525 | -0.029012 | -76.1710118 |
| exo DA | 0.060507 | 158.84276 | -0.02765 | -72.5950805 |
It can be seen that the energy of the endo TS is 7826.62 kJ/mol (2.981 Hartrees) higher than the energy of the exo TS, and that the activation energy of the endo TS is 7.808235 kJ/mol lower than that of the exo TS . This means that the endo product is the kinetic product. This was expected as, like mentioned above, the HOMO of the endo TS is stablised by secondary orbital interactions and the charges in the TS discussed in the "Reaction" section above.
If we then look at the product energies, the energy of the endo product is lower than the energy of the exo product, and the reaction energy for the endo pathway is 3.5759313 kJ/mol lower than for the exo pathway. This suggests that the endo product is also the thermodynamic product. Therefore, the endo product is both kinetically and thermodynamically more stable than the exo product.
Nf710 (talk) 21:58, 30 November 2017 (UTC) Yo energies are slightly off, but you have come to the correct conclusions and made come arguments about why each is the kinetic or thermo. You could have gone into a bit more detail however and possibly used some JMOLs the pictures can be difficult to see the MOS.
Exercise 3. Diels Alder vs Cheletropic
Files used
DIELS ALDER
ENDO
DA endo product optimisation, PM6 Media:EX3 DA ENDO PRODUCT PM6 OPT.LOG
DA endo TS optimisation to minimum, PM6 Media:EXERCISE3 DIELSALDER ENDO TS OPT MINIMUM PM6 TRIAL2.LOG
DA endo TS optimisation, TS Berny, PM6 Media:EXERCISE3 DIELSALDER ENDO TS OPT TSBERNY PM6 TRIAL1.LOG
DA endo IRC. PM6 Media:EXERCISE3 DIELSALDER ENDO TS OPT IRC PM6 TRIAL1.LOG
EXO
DA exo product optimisation, PM6 Media:EXERCISE3 DIELSALDER PRODUCT OPT MINIMUM PM6 TRIAL3.LOG
DA exo TS optimisation to minimum, PM6 Media:EXERCISE3 DIELSALDER EXO TS OPT MINIMUM PM6 TRIAL2.LOG
DA exo TS optimisation, TS Berny, PM6 Media:EXERCISE3 DIELSALDER EXO TS OPT TSBARNY PM6 TRIAL1.LOG
DA exo IRC. PM6 Media:EXERCISE3 DIELSALDER EXO TS OPT IRC PM6 TRIAL1.LOG
CHELETROPIC
cheletropic product optimisation, PM6 Media:EX3 CHELOTROPIC PRODUCT OPT PM6.LOG
cheletropic TS optimisation to minimum, PM6 Media:EXERCISE3 CHELETROPIC EXO TS MINIMUM PM6 TRIAL1.LOG
cheletropic optimisation, TS Berny, PM6 Media:EXERCISE3 CHELETROPIC EXO TS TSBARNY PM6 TRIAL1.LOG
cheletropic IRC, PM6 Media:EXERCISE3 CHELETROPIC EXO TS IRC PM6 TRIAL1.LOG
Method
The products were drawn and optimised to a minimum at PM6 level in order to find the TS. The bonds of the products were broken in a way that resembled what was happening in the reaction. After the bonds have been broken, the resulting structure was optimised to a minimum at the PM6 level. Next, the TS was found by performing a TS Berny (PM6 , keyword for TS Berny optimisation: opt=noeigen) calculation on the molecule. The TS was verified by a frequency analysis and one negative frequency was obtained for each of the TS. An IRC has been done on both the endo and exo TS (PM6, force constants set to always calculate, N=100, calculate in both directions). Furthermore, the reactants were optimised to a minimum at the PM6 level.
Reaction
Xylylyne and SO2 can either undergo Diels-Alder reaction to give the exo and endo products or a Chelotropic reaction.

Intrinsic Reaction Coordinates (IRCs)
- The IRCs for the DA endo and exo and Cheletropic pathways
-
 Figure 37. IRC of the DA endo reaction
 -
 Figure 38. IRC of the DA exo reaction
 -
 Figure 39. IRC of the Cheletropic reaction


As the reaction proceeds, the bonding in xylenene becomes delocalized. Delocalisation results in a lower energy state, making the molecule more stable. Hence, in the starting material, xylenene is unstable, and as the reaction proceeds, xylenene becomes increasingly stable, due to increasing delocalization of the pi bonds in the ring.
Activation and reaction energies
In order to determine the activation and reaction energy of every reaction pathway, the energies of the reactants, the TS and the product must first be found. The following data was obtained:
DIELS ALDER EXO PATH
| Energy (Hartrees) | Energy (kJ/mol) | |
|---|---|---|
| sulfur dioxide | -0.118614 | -311.4210807 |
| xylylene | 0.177414 | 465.800492 |
| sum of reactants | 0.058800 | 154.379412 |
| exo TS | 0.092077 | 241.748182 |
| exo product | 0.021452 | 56.3222303 |
Using the data in the table above, the activation energy can be calculated in the following way:
activation energy=energy of TS-energy of reactants
activation energy=241.748182-154.379412=87.36877 kJ/mol
The reaction energy is then:
reaction energy=energy of products-energy of reactants
reaction energy=56.3222303-154.379412=-98.0571817 kJ/mol
| Activation energy (kJ/mol) | Reaction energy (kJ/mol) |
|---|---|
| 87.36877 | -98.0571817 |
DIELS ALDER ENDO PATH
Following the method above:
| Energy (Hartrees) | Energy (kJ/mol) | |
|---|---|---|
| sulfur dioxide | -0.118614 | -311.4210807 |
| xylylene | 0.177414 | 465.800492 |
| sum of reactants | 0.058800 | 154.379412 |
| endo TS | 0.090560 | 237.765298 |
| endo product | 0.021705 | 56.9864818 |
The activation and reaction energies are then obtained in the same fashion as above.
activation energy=237.765298-154.379412=83.385886 kJ/mol
reaction energy=56.9864818-154.379412=-97.3929302 kJ/mol
| Activation energy (kJ/mol) | Reaction energy (kJ/mol) |
|---|---|
| 83.385886 | -97.3929302 |
CHELETROPIC
| Energy (Hartrees) | Energy (kJ/mol) | |
|---|---|---|
| sulfur dioxide | -0.118614 | -311.4210807 |
| xylylene | 0.177414 | 465.800492 |
| sum of reactants | 0.058800 | 154.379412 |
| TS | 0.099062 | 260.087301 |
| product | 0.063320 | 166.246673 |
activation energy=260.087301-154.379412=105.707889 kJ/mol
reaction energy=166.246673-154.379412=11.867261 kJ/mol
| Activation energy (kJ/mol) | Reaction energy (kJ/mol) |
|---|---|
| 105.707889 | 11.867261 |
The Diels-Alder reaction is exothermic (reaction energy is negative), while the Chelotropic pathway is endothermic (reaction energy is positive). Furthermore, the activation energy for the Cheletropic pathway is higher than for the Diels Alder. Therefore, the Diels Alder pathway is preferred.
(It looks like you wrote down the wrong number for the cheletropic product. It is in fact the most thermodynamically favoured product Tam10 (talk) 12:32, 24 November 2017 (UTC))
In the Diels Alder reaction, the endo TS has a lower energy and therefore the endo product is more kinetically stable. The exo product is, however, lower in energy than the endo product, so it is the thermodynamically more stable product.
Using this analysis and the data obtained above, an energy reaction profile can be made for both reactions (Figures 40 and 41). Please note that the TS curves and energy differences between exo and endo products have been slightly exaggerated in order to make the diagram more clear. Furthermore, the TS for each reaction has been shifted a bit to the right in order for the arrows indicating the energy gap between reactants and TSs not to overlap.


(Don't use curves for these diagrams. Straight lines are fine Tam10 (talk) 12:32, 24 November 2017 (UTC))
Extension
The second cis-butadiene fragment in xylylene can undergo a Diels-Alder (DA) reaction (which will sometimes be referred to as an 'alternative DA reaction'). . The same calculations were performed for this reaction and the following data was obtained:
| Energy (Hartrees) | Energy (kJ/mol) | |
|---|---|---|
| sulfur dioxide | -0.118614 | -311.4210807 |
| xylylene | 0.177414 | 465.800492 |
| sum of reactants | 0.058800 | 154.379412 |
| TS | 0.105055 | 275.821924 |
| product | 0.067304 | 176.706665 |
activation energy=275.821924-154.379412=121.442512 kJ/mol
reaction energy=176.706665-154.379412=22.327253 kJ/mol
Comparing the activation energies of the other pathways (endo DA, exo DA and Cheletropic), the activation energy is the highest of all for this alternative DA reaction, which makes it kinetically unfavourable.
Furthermore, looking at the reaction energy, it can be seen that it is positive here, the reaction is endothermic, which makes it thermodynamically unfavourable. When comparing the energy of this reaction with the energies of the reactions above, its is significantly higher, hence this reaction is not favoured relative to the ones above.
A summary of all the activation and reaction energies of the reaction pathways is given below.
| Activation energy (kJ/mol) | Reaction energy (kJ/mol) | |
|---|---|---|
| DA endo | 83.385886 | -97.3929302 |
| DA exo | 87.36877 | -98.0571817 |
| Cheletropic | 105.707889 | 11.867261 |
| DA alternative | 121.442512 | 22.327253 |
Conclusion
In conclusion, Gaussian calculations allow us to, among others, build MO diagrams from MO visualisations, determine the thermodynamic and kinetic products, build energy profiles for the reaction, determine which is the preferred reaction pathway when there are more than one available routes and using IRCs look at what is happening with the bonds when the reaction proceeds. Specifically, in exercise 1 (reaction between butadiene and ethylene), it was determined that the symmetric HOMO of the diene reacts with the symmetric LUMO of the dienophile to give the symmetric HOMO and LUMO MOs of the TS. Furthermore, as the reaction proceeds, the carbon-carbon bonds become of similar lengths. By looking at the IRCs, it can be concluded that bond formation is synchronous.
In exercise 2 (reaction between cyclohexadiene and 1,3-dioxole), it was calculated that the energy of the endo TS is lower than the energy of the corresponding exo TS, as the endo TS is stablised by secondary orbital interactions. The HOMO and LUMO of the TS are formed by the interaction of the LUMO of the diene and the HOMO of the dienophile, which implies inverse electron demand. In terms of thermochemistry of the reaction, using computed energy values, it was found that endo TS is lower in energy than the exo TS, which means that the endo product is kinetically more stable. Furthermore, the endo product has lower energy than the exo product so it is also the thermodynamic product in this reaction.
In exercise 3 (xylylene and SO2 unrgoing either Diels-Alder reaction to give the exo and endo products or a Chelotropic reaction), using IRCs it was determined that as the reaction proceeds xylenene becomes more stable due to the increased delocalization of the pi bonds in the ring. Moreover, thermochemistry data was used to predict that the DA reaction is exothermic while the Cheletropic pathway is endothermic. Also, DA reaction has a lower activation energy than the Cheletropic one. Taking this two results allows us to conclude that the DA reaction is favoured over the Cheletropic one. In the Diels Alder reaction, the endo TS has a lower energy and therefore the endo product is more kinetically stable. The exo product is, however, lower in energy than the endo product, so it is the thermodynamically more stable product. There is also a second butadiene fragment in xylenene that could react, however, the relatively high activation and reaction energies make it both kinetically and thermodynamically unfavourable.
- ↑ Hofmann, M. (2008). When Is a Minimum Not a Minimum?. [ebook] Heidelberg: Universität Heidelberg. Available at: http://www.uni-heidelberg.de/institute/fak12/AC/hofmann/acf_theo/MinNoMin.pdf [Accessed 20 Nov. 2017].
- ↑ Chemistry LibreTexts. (2017). Potential Energy Surface. [online] Available at: https://chem.libretexts.org/Core/Physical_and_Theoretical_Chemistry/Quantum_Mechanics/11%3A_Molecules/Potential_Energy_Surface [Accessed 20 Nov. 2017].
- ↑ Sherrill, C. (2017). Potential Energy Surfaces. [ebook] Atlanta: Georgia Institute of Technology. Available at: http://vergil.chemistry.gatech.edu/courses/chem6485/pdf/pes-lecture.pdf [Accessed 20 Nov. 2017].
- ↑ Rossi, A. (2017). Potential Energy Surface (PES), Transition State, Saddle Point, Reaction Pathway. [ebook] Storrs: Department of Chemistry, The University of Connecticut. Available at: http://rossi.chemistry.uconn.edu/workshop/files/pes_ts_mep_exercises.pdf [Accessed 20 Nov. 2017].
- ↑ 5.0 5.1 Organic-chemistry.org. (2017). Diels-Alder Reaction. [online] Available at: http://www.organic-chemistry.org/namedreactions/diels-alder-reaction.shtm [Accessed 20 Nov. 2017]. Cite error: Invalid
<ref>tag; name "organic" defined multiple times with different content - ↑ Martinez, R. (2017). Cheletropic Reactions. [ebook] The Scripps Research Institute. Available at: https://www.scripps.edu/baran/images/grpmtgpdf/Martinez_13.pdf [Accessed 21 Nov. 2017].
- ↑ Früchtl, H. (2017). Molecular Quantum Chemistry. [ebook] St Andrews: University of St Andrews. Available at: https://www.st-andrews.ac.uk/media/school-of-chemistry/documents/Gaussian.pdf [Accessed 21 Nov. 2017].
- ↑ Früchtl, H. (2017). Molecular Quantum Chemistry. [ebook] St Andrews: University of St Andrews. Available at: https://www.st-andrews.ac.uk/media/school-of-chemistry/documents/Gaussian.pdf [Accessed 21 Nov. 2017].
- ↑ Cup.uni-muenchen.de. (2017). Semiempirical Methods. [online] Available at: http://www.cup.uni-muenchen.de/ch/compchem/energy/semi1.html [Accessed 21 Nov. 2017].
- ↑ Früchtl, H. (2017). Molecular Quantum Chemistry. [ebook] St Andrews: University of St Andrews. Available at: https://www.st-andrews.ac.uk/media/school-of-chemistry/documents/Gaussian.pdf [Accessed 21 Nov. 2017].
- ↑ Gaussian.com. (2017). Density Functional (DFT) Methods | Gaussian.com. [online] Available at: http://gaussian.com/dft/ [Accessed 21 Nov. 2017].
- ↑ Rossi, A. (2017). Potential Energy Surface (PES), Transition State, Saddle Point, Reaction Pathway. [ebook] Storrs: Department of Chemistry, The University of Connecticut. Available at: http://rossi.chemistry.uconn.edu/workshop/files/pes_ts_mep_exercises.pdf [Accessed 20 Nov. 2017].
- ↑ Physical Properties: Bond Length, Bond Strength & Acidity. (2017). [ebook] Boston: Massachusetts Institute of Technology. Available at: https://ocw.mit.edu/courses/chemistry/5-12-organic-chemistry-i-spring-2003/lecture-handouts/04.pdf [Accessed 19 Nov. 2017].
- ↑ Batsanov, S. (1995). Van der Waals radii of elements from the data of structural inorganic chemistry. Russian Chemical Bulletin, 44(1), pp.18-23.
- ↑ Schiemenz, G. (2007). The Sum of van der Waals Radii – A Pitfall in the Search for Bonding. Zeitschrift für Naturforschung B, 62(2).
- ↑ Scienide2.uwaterloo.ca. (2017). Transition states. [online] Available at: http://scienide2.uwaterloo.ca/~nooijen/Chem-440-computational/Lab_Gaussian_transition_states.pdf [Accessed 19 Nov. 2017].
- ↑ Ch.ic.ac.uk. (2017). Diels-Alder Reaction. [online] Available at: http://www.ch.ic.ac.uk/motm/porphyrins/introDA.html [Accessed 19 Nov. 2017].