MRD:mmn115
Molecular Reaction Dynamics
Exercise 1: H1+H2 system
Question 1
What value does the total gradient of the potential energy surface have at a minimum and at a transition structure? Briefly explain how minima and transition structures can be distinguished using the curvature of the potential energy surface.
The value for the gradient of the potential energy surface is equal to zero at both the minimum and at the transition structure. According to the definition in the script, "The transition state is defined as the maximum on the minimum energy path linking reactants and the products". Hence, since it is a maximum, the first derivative at this point will be equal to zero and the second derivative will be <0. At the minimum point in the potential energy surface, the first derivative will be equal to zero whereas the second derivative will be >0.
Question 2
Report your best estimate of the transition state position (rts) and explain your reasoning illustrating it with a “Internuclear Distances vs Time” screenshot for a relevant trajectory.
The rts should be constant, no matter what initial values you use for r1 and r2. Hence, let us plot the surface plot for three different values of r1 and r2, such that r1=r2. Then we should be able to see at which bond distance the transition state occurs (rts).
1. plot for r1=r2=2 Å gives rts at around 0.9 Å
2. plot for r1=r2=1 Å gives rts at around 0.9 Å
3. plot for r1=r2=0.5 Å gives rts at around 0.9 Å
This is shown in the surface plot for r1=r2=2 Å below, where the X value for what we assume is the transition state, is 0.9 Å. Please note that we are looking at the transition state in the minimum energy pathway.
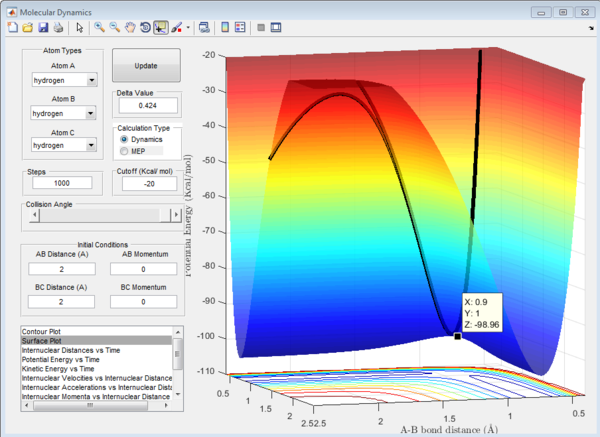
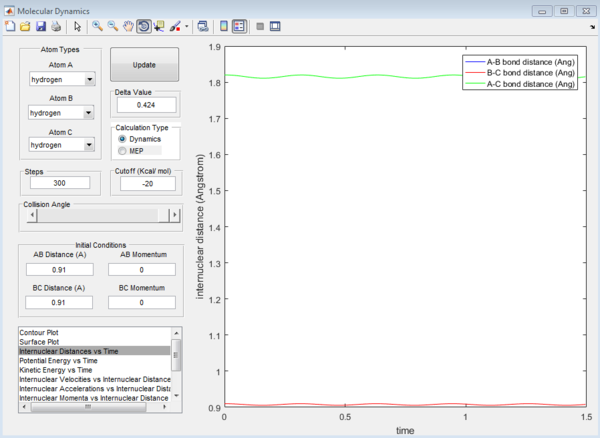
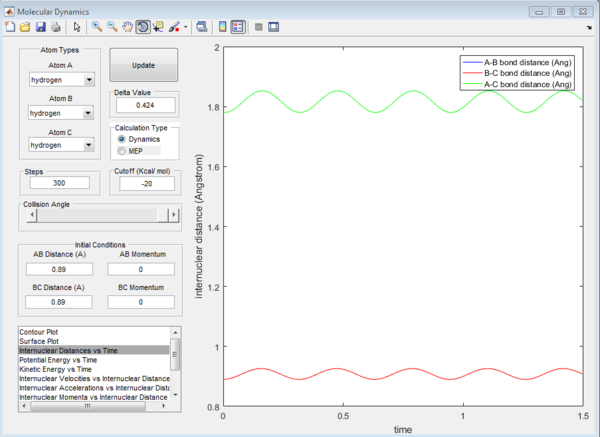
We now have a rough idea of where the rts is located. To get a more accurate value for the rts we have to use the internuclear distance vs time plot. The graphs for rts=0.9 Å, 0.89 Å and 0.91 Å are shown below. We want the curves for bond distance to oscillate as little as possible.
We see in Figures 2, 3 and 4 below that for a decreased rts value, the graph oscillates more. So instead of going down from 0.90 Å, let us go up and see what happens.
For the value of rts 0.91 Å, the graph does not oscillate much, hence 0.91 Å is a good estimate for the rts.

Question 3
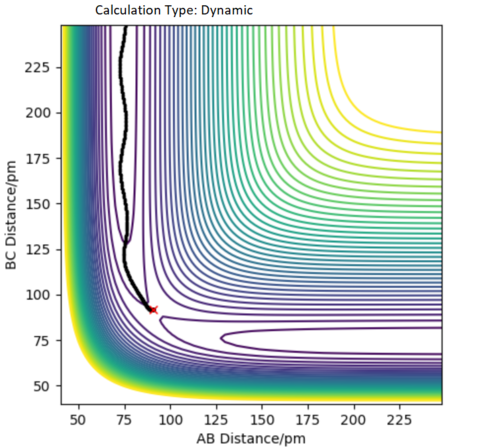
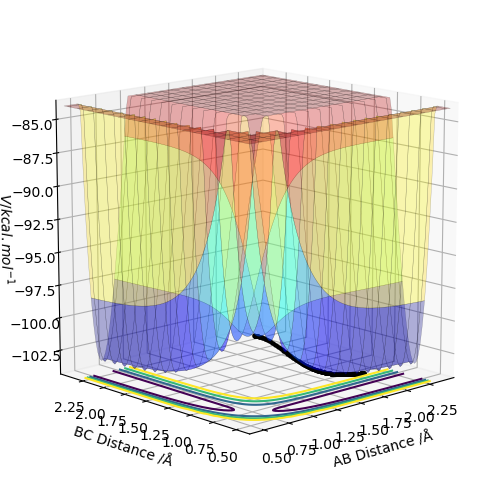
Comment on how the mep and the trajectory you just calculated differ.
There are two main differences between the mep and the dynamic graph:
- in mep the trajectory is located mostly on the transition state maximum, whereas the dynamic trajectory goes from the transition state maximum and futher down the "valley"
- in mep the trajectory is straight, wheras in the dynamic graph the trajectory oscillates. This is because in the dynamic graph the mass of the atoms is taken into account, and hence so is the fact that the molecule vibrates, oscillates
Question 4
Complete the table by adding a column reporting if the trajectory is reactive or unreactive. For each set of initial conditions, provide a screenshot of the trajectory and a small description for what happens along the trajectory.
| p1 | p2 | reactive/unreactive? | |
|---|---|---|---|
| conditions 1 | -1.25 | -2.5 | reactive |
| conditions 2 | -1.5 | -2.0 | unreactive |
| conditions 3 | -1.5 | -2.5 | reactive |
| conditions 4 | -2.5 | -5.0 | unreactive |
| conditions 5 | -2.5 | -5.2 | reactive |
Conditions 1 graph:
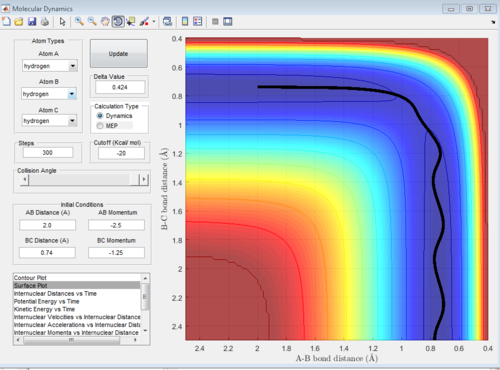
We can see from the graph that the trajectory starts at the reactants, when A is and atom and BC is a molecule. As A comes closer to B and C moves apart, the trajectory keeps shifting until the distance between A and B and B and C is equal, the transition point. The trajectory passes through the transition state and goes to the products. Hence the reaction takes place.
Conditions 2 graph:
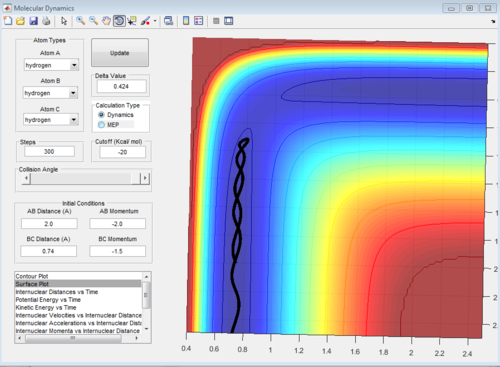
We can see from the graph that the trajectory starts at the reactants. As A moves closer to B and C moves away, the trajectory keeps going. However, when it reaches the maximum, the transition state, it bounces back to the reactants. Hence the transition point is not reached as the activation energy was not reached (due to the momentum being too small) and the reaction does not proceed.
Conditions 3 graph:
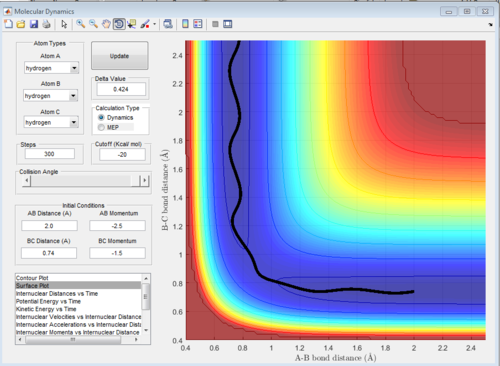
Like with conditions 1, the trajectory starts at the reactants, goes through the transition point and next to the products, resulting in the formation of the product. Increasing p1 momentum, resulted in a reactive pathway. From this we can deduce that the reason why condition 2 was unreactive is that p2 was not sufficient to overcome the activation barrier.
Conditions 4 graph:
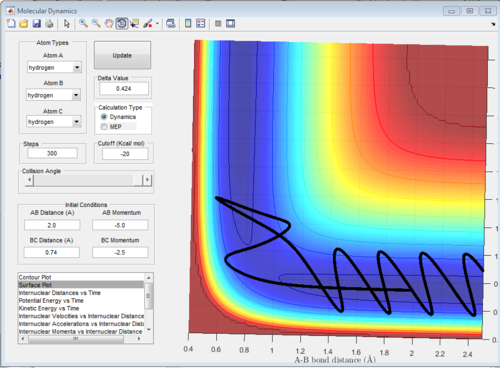
In this graph, the trajectory starts at the reactants and proceeds via the transition state. Because it does have enough energy to overcome the transition state, it does so and proceeds to the products. The bonds between A and B form.
However, it doesn't have enough energy to overcome the pathway to the products. It then bounces off and returns to the reactants. The reaction does not take place.
Conditions 5 graph:
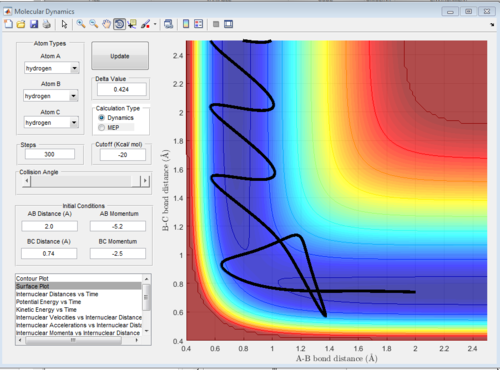
In the graph the trajectory starts at the reactants, proceeding to the transition state. The molecules have enough energy to overcome the transition state. However, after the transition state, the reaction is driven back to the reactants, from where it bounces off and proceeds to the products. Hence, the reaction takes place. In condition 4 p2 momentum was too small to allow the formation of products. In condition 5, p2 was increased only by 0.2, which is not a huge increase but it allows the formation of products. The reason why the reaction pathway is driven back to the reactants might be that the p2 momentum is just above the minimal value, hence the barrier is eventually overcome
Question 5
State what are the main assumptions of Transition State Theory. Given the results you have obtained, how will Transition State Theory predictions for reaction rate values compare with experimental values?
Firstly, the transition state theory (tst) assumes that atoms and nuclei behave according to classical theory. Atoms must approach each other with sufficient energy and collide with sufficient energy, in order for the reaction to take place. However, quantum mechanics says that for any finite energy, there is a possibility that the reaction will still take place. This is known as quantum mechanical tunneling. As a result, the experimental values for the reaction rate will be larger, because more collisions (even the ones with less energy) can lead to the formation of the product due to tunneling taking place. Secondly, tst assumes that when the reaction proceeds, it will proceed via the transition state which is located on the saddle point of the potential energy vs internuclear distance curve. However, in reality, the reactants can take a different trajectory, around the saddle point. This way, even molecules which don't have enough energy to overcome the activation barrier can react to form a product, as they can take an alternative pathway. This results in a larger experimental value than the one predicted by tst. [1]
Exercise 2: F-H-H system
Question 1
Classify the F + H2 and H + HF reactions according to their energetics (endothermic or exothermic). How does this relate to the bond strength of the chemical species involved?
F+H2 is exothermic The H-F bond created is very strong (average bond energy is 565 kJ/mol)[2]. Less energy is needed to break the H-H bond (average bond energy is 432 kJ/mol)[3]. So when the H-F bond is made, energy is released. The enthalpy change for the reaction is -133 kJ/mol. It is negative which confirms that it is exothermic.
H+HF is endothermic. The H-F bond has a larger average bond energy than the H-H bond, so more energy is needed to break the H-F bond than is released upon making the H-H bond. The enthalpy change for the reaction is 133 kJ/mol. It is positive which confirms that it is endothermic.
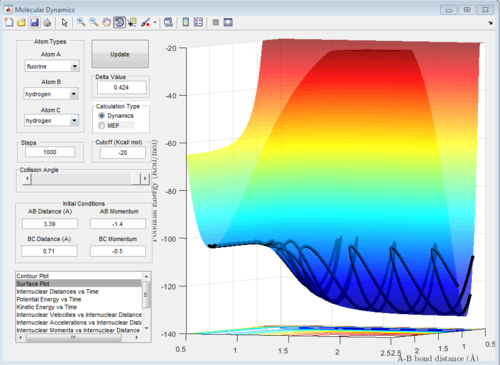
It can be seen in the figure below that the reactants for the forward reaction (F+H2) have a higher energy than the products. This proves that it is exothermic. The reverse reaction will hence be opposite: endothermic.
Question 2
Locate the approximate position of the transition state.
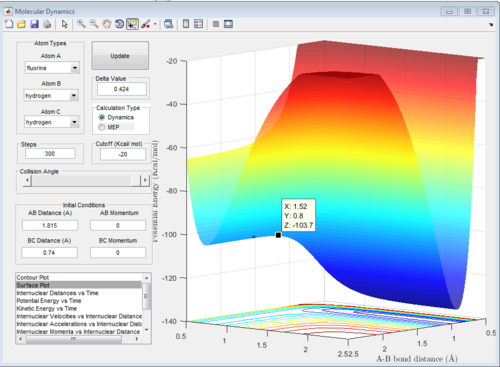
H-H distance (BC) = 0.74 Å
H-F distance (AB) = 1.815 Å
The distances were found using the trial and error method on the surface plot below with steps set to 100. The graph was then zoomed in to more accurately determine the position of the transition state. The values for the distances were then used to plot an internuclear distance vs time graph and confirm their accuracy.
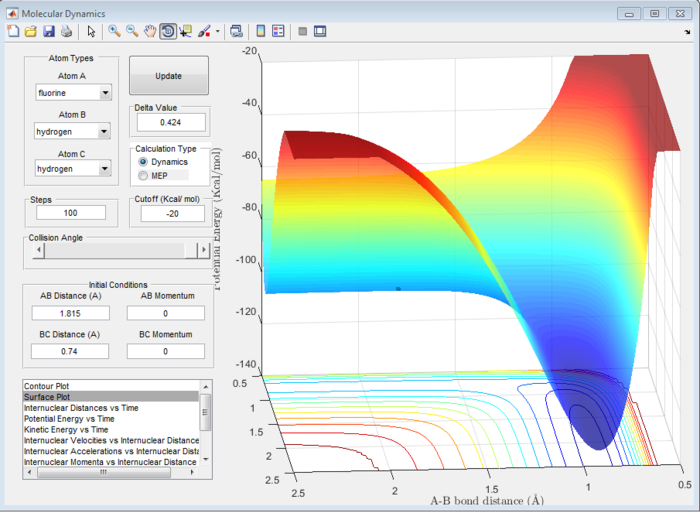
In the graph below, we can see that the internuclear distance vs time curves are approximately constant for these values of r, hence the position of the transition state is quite accurate.

Question 3
Report the activation energy for both reactions.
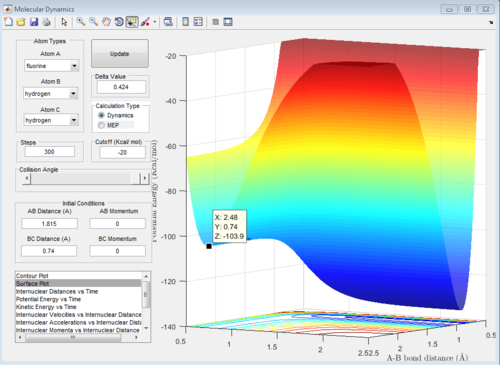
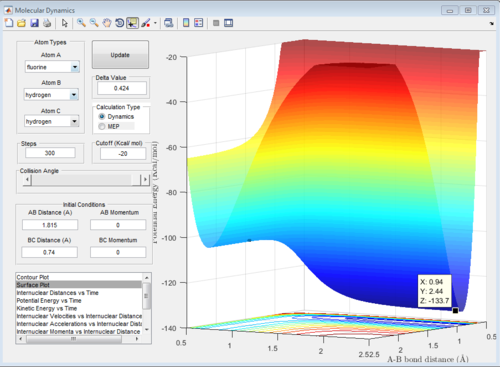
The transition state energy and reactant energies were found by generating the surface plot and estimating the values.
transition state energy: -103.7 kcal/mol
F+H2 exothermic reaction energy of reactants: -103.3 kcal/mol
H+HF endothermic reaction energy of reactants: -133.7 kcal/mol
activation energy=transition state energy-energy of reactants
F+H2 activation energy =(-103.7)-(-103.9)= 0.2 kcal/mol
H+HF activation energy =(-103.7)-(-133.7)= 30 kcal/mol
Question 4
In light of the fact that energy is conserved, discuss the mechanism of release of the reaction energy. How could this be confirmed experimentally?
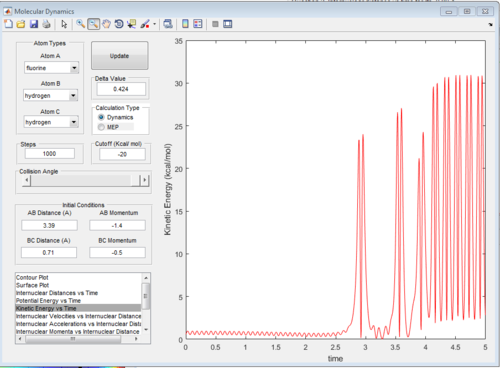
We know that F+H2 is an exothermic reaction so the product energy will be lower then the reactants energy. We also know that the product potential energy is lower than the reactant potential energy. Because the sum of the kinetic and potential energies has to be constant (law of conservation of energy), we can deduce that the kinetic energy of the products will be higher than that of the reactants. This is confirmed by the graph of kinetic energy vs time shown below. We see that at the beginning the kinetic energy is low and close to zero, but as the reaction proceeds, at around t=2.5 it peaks sharply, oscillating between around 0 and 30 kcal/mol. This hypothesis can be confirmed by an IR spectrum. If a moelcule has more kinetic energy, it will vibrate more, and these vibrations will be seen in the IR spectrum.
Question 5
Discuss how the distribution of energy between different modes (translation and vibration) affect the efficiency of the reaction, and how this is influenced by the position of the transition state.
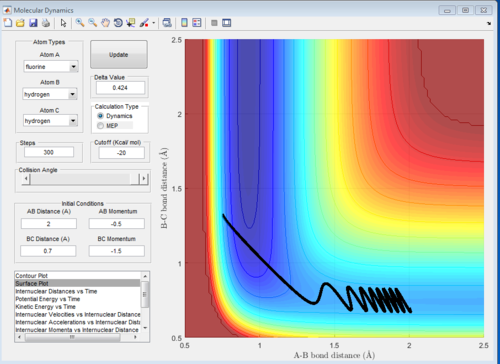
When you increase the momentum you increase the translation energy of the molecule. According to Polanyi's empirical rules, increasing the translational energy promotes the early transition state. In an exothermic reaction (F+H2), the transition state is closer in energy to the reactants, so you get an early transition state. This is proven in the figures below. In the first figure, AB momentum=-0.5 and BC momentum=-1.5. The reaction takes place, and proceeds fairly smoothly (straight line) through the transition state, and then goes to the products. This is just an example of one of the successful trajectories from a set of trajectories.
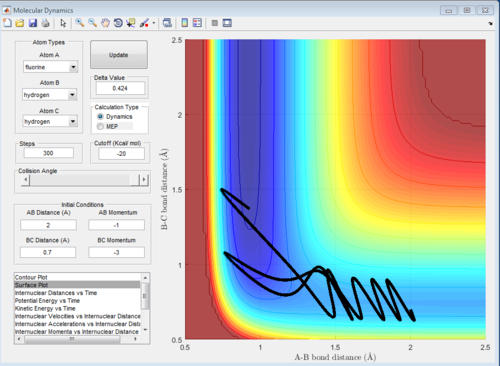
When we double the momenta, hence increase the translational energy, the reaction still takes place, but we can see that at the early transition state the reaction path starts going to the products, then it returns slightly to the early ts, then it goes again to the products, and again to the reactants. This happens multiple times before the products are formed. This reduces the efficiency of the reaction. Again, this is just an example of one of the successful trajectories from a set of trajectories.
If we look at the reverse reaction, H+HF, it is endothermic. In an endothermic reaction, the transition state is closer to the products, so a late transition state takes place. Increasing the vibrational energy promotes the late transition state. The classical vibrational frequency increases as bond strength, k, increases. In order to increase bond strength, we decrease bond length. Favouring the late transition state will make the reaction more efficient, as the reactants will be pushed towards the products and the late transition state. [4]
However, increasing the momenta in the reverse reaction would result in an excess of translational energy, making the reaction less efficient. The efficiency of the set of trajectories depends on the amount of vibrational and translational energies.
References
- ↑ Eyring, Henry. "The Activated Complex In Chemical Reactions". The Journal of Chemical Physics 3.2 (1935): 107-115. Web.
- ↑ "Bond Energies - Chemistry Libretexts". Chem.libretexts.org. N.p., 2017. Web. 9 May 2017.
- ↑ "Bond Energies - Chemistry Libretexts". Chem.libretexts.org. N.p., 2017. Web. 9 May 2017.
- ↑ Yan, S., Y.-T. Wu, and K. Liu. "Tracking The Energy Flow Along The Reaction Path". Proceedings of the National Academy of Sciences 105.35 (2008): 12667-12672. Web.
