MRD:mlw115RXNDy
Reaction Dynamics
Exercise 1: H2 + H system
Dynamics from the transition state region
Question 1. What value do the different components of the gradient of the potential energy surface have at a minimum and at a transition structure? Briefly explain how minima and transition structures can be distinguished using the curvature of the potential energy surface.
Where a reaction is modeled on a potential energy surface the lowest energy path between the reactants and products is seen as a "valley floor" of the surface. The transition structure is a saddle point along the minimum energy ridge.
The gradient of the potential energy surface is zero at the minimum, along the direction of the reaction path and so the first derivative with respect to the inter-nuclear distance is zero. For the saddle point the gradient of the potential energy surface is zero orthogonal to the direction of the reaction pathway.
δV(ri)/δri = 0
Second derivatives δV2(ri)/δri2 > 0 Minima δV2(ri)/δri2 < 0 Maxima
where V is the potential energy and r related to the nuclear positions.
The minimum pathway and saddle point can be distinguished using the second derivatives with respect to atom positions. The second derivative of a maximum point is negative, whereas the second derivative of a minimum is positive. As the saddle point is a maxima along the minimum path the second derivative is negative. The second derivative of the minimum energy path in the direction of the reaction will be positive.
Estimating Transition State Position
Question 2. Report your best estimate of the transition state position (rts) and explain your reasoning illustrating it with a “Internuclear Distances vs Time” plot for a relevant trajectory.
| Distance | Momentum | |
|---|---|---|
| AB | 0.908 | 0 |
| BC | 0.908 | 0 |
Jas213 (talk) 20:00, 28 May 2018 (BST) Units missing.
| Surface Plot 1 | Surface Plot 2 | Internuclear distance vs Time |
|---|---|---|
 |
 |
 | |
|
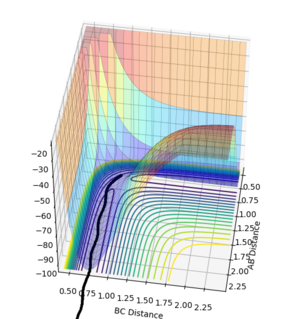
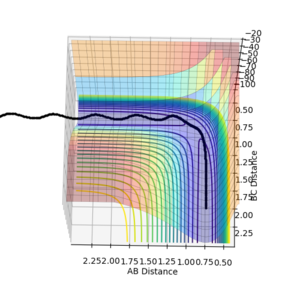
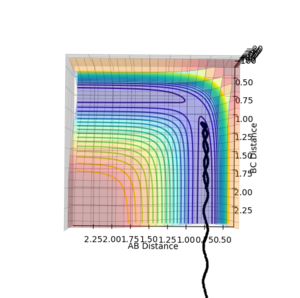
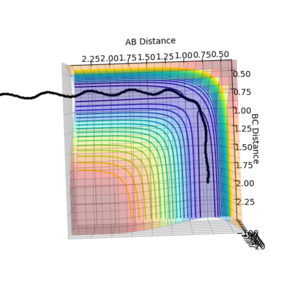
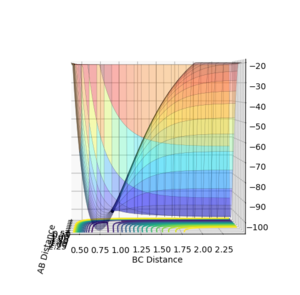
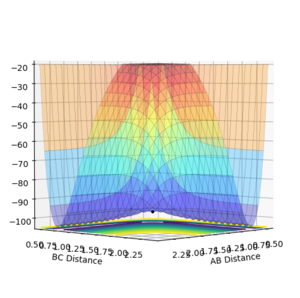
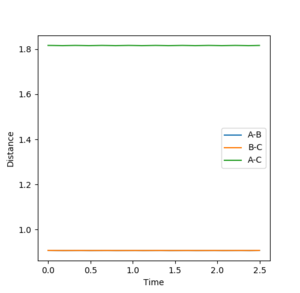
The best guess of inter nuclear distances at the transition state was found using trial and error, to find the positions that would result in the minimum trajectory. As the system is symmetric the distances would be equal. The two surface plots are included to demonstrate the "reaction path". The internuclear distance vs time plot demonstrates no change in any bond lengths at the transition state so the overall momenta is 0 and potential energy is at the maximum. This agrees with that the transition state is a stationary point.
Reaction Path
MEP vs Dynamics
| Distance | Momentum | |
|---|---|---|
| AB | 0.909 | 0 |
| BC | 0.908 | 0 |
| Surface Plot (MEP) | Surface Plot (Dynamics |
|---|---|
 |

|
Question 3. Comment on how the mep and the trajectory you just calculated differ.
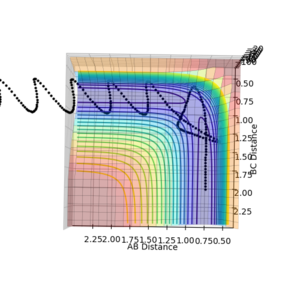
It can be seen in the MEP plot that the trajectory follows the minimum energy valley floor without any obvious deviations or oscillation. This does not account for the inter-molecular vibrations between the molecules,. The MEP trajectory is corresponding to infinitely slow motion, it does not accurately represent the atomic motion of the reaction. The trajectory oscillates in the dynamics plot, also in much less steps the AB bond distance increases considerably more. This plot is more realistic as it accounts for the motion of atoms during the reaction.
| Distance | Momentum | |
|---|---|---|
| AB | 9.993 | 0.754 |
| BC | 2.486 | 1.167 |
Reversed conditions
| Distance | Momentum | |
|---|---|---|
| AB | 9.993 | 0.754 |
| BC | -2.486 | -1.167 |
From taking the previous runs final conditions and setting these as the initial conditions and reversing the momenta values the reaction seems to run in reverse, reaching an end exactly at the transition state.
Determining Reactivity
Question 4. Complete the table by adding a column with the total energy, and another column reporting if the trajectory is reactive or unreactive. For each set of initial conditions, provide a plot of the trajectory and a small description for what happens along the trajectory.
| Atoms | Internuclear distance |
|---|---|
| AB | 0.74 |
| BC | 2.0 |
Jas213 (talk) 20:02, 28 May 2018 (BST) Again units missing everywhere, good that you stated the initial conditions, wouldn't have hurt to have a little introductory phrase instead of just copy pasting the questions.
Jas213 (talk) 20:05, 28 May 2018 (BST) An overall concluding comment would have been expected. You could have also stated the kinetic energies in each case to support your point.
Transition State Theory
Question 5 State what are the main assumptions of Transition State Theory. Given the results you have obtained, how will Transition State Theory predictions for reaction rate values compare with experimental values?
Transition state theory is used to understand how elementary chemical reactions take place assuming a quasi-equilibirum between reactanting complexes and those at the transition state. The rate of reaction can be understood by inspecting the complexes at the maximum saddle point of the minimum energy pathway. The reactants are in equilibrium with the activated transition state complexes and can be converted to the products.
This theory is useful to theoretically understand a chemical reaction however it operates on a series of assumptions which limit the theory. Main Assumptions: Equilibrium is close in the systems Only one reaction pathway occurs There is negligable barrier recrossing
For instance the atoms are assumed to behave classically, ignoring tunelling. Tunneling would be more prominent in reactions with low activation barriers. Also the theory assumes that the saddle point with the lowest energy will be passed over to reach the products, however this is not the case when higher vibrational energies will be populated.
Clearly a key issue seen in the data obtained above is that there is considerable barrier recrossing. Therefore the transition state theory would fail in this case. The TST would assume that all collisions of an energy above the barrier of the transition state would result in a successful reaction. Clearly this is not the case and the experimental rate would be much lower than the TST would predict.
Jas213 (talk) 20:07, 28 May 2018 (BST) Good that you give the references, however you need to state them at the end of the specific sentences you have adapted from the references.
Exercise 2: H-H-F System
PES Inspection
Question 6. Classify the F + H2 and H + HF reactions according to their energetics (endothermic or exothermic). How does this relate to the bond strength of the chemical species involved?
For the forward reaction of H2 + F --> HF + H is exothermic, as shown in the surface plot below the energy of the reactants H2 is higher than the energy of the product HF. As the energy absorbed in breaking the H-H bond in the first case is less than the energy released forming the H-F bond which means that in total energy is released which results in an exothermic reaction.
| Surface Plot H2+F->HF+H | Surface Plot HF+H -> H2+F |
|---|---|
 |
 | |
|
| Bond | Strength (kJ/mol) |
|---|---|
| H-F | 565 |
| H-H | 432 |
Determining Transition State
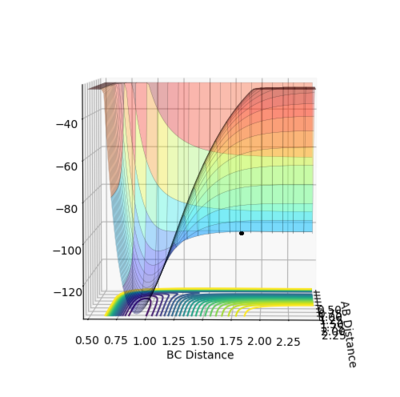
Question 7. Locate the approximate position of the transition state.
A = HA B = HB and C = F
| Atoms | Internuclear distance |
|---|---|
| AB | 0.74 |
| BC | 1.813 |
| Surface Plot | Internuclear distance vs Time |
|---|---|
 |
 | |
|
Jas213 (talk) 20:08, 28 May 2018 (BST) Not a single sentence on how you obtained the TS, no units, just throwing some plots and tables at me. Your distance vs. time plot shows wiggly lines, hence you haven't found the exact TS yet.
Calculating Activation Energy
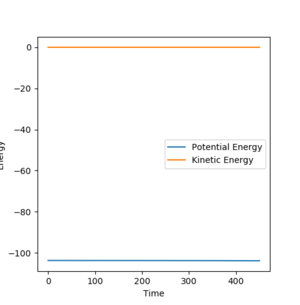
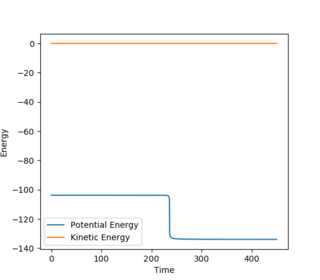
Question 8. Report the activation energy for both reactions.
| Distance | Momentum | |
|---|---|---|
| AB | 0.74 | 0 |
| BC | 1.8130/1.8135 | 0 |
| BC= 1.8135 | BC= 1.8135 Zoomed | BC= 1.8130 |
|---|---|---|
 |
 |
|
| Energy (Kcal/mol) | |
|---|---|
| Initial energy | -103.752 |
| Final energy | -133.89 |
| EA | 30.138 |
| Energy (Kcal/mol) | |
|---|---|
| Initial energy | -103.742 |
| Final energy | -103.752 |
| EA | 0.01 |
Jas213 (talk) 20:11, 28 May 2018 (BST) Again not a single sentence? Did you use MEPs or Dynamic? to obtain these E vs. time plots? You could have provided them. Why do you have two BC distances, but only one AB distance? Some comments/ some discussion would have been nice. If you don't explain anything, how can I tell if you understood what you are doing.
Reaction Dynamics
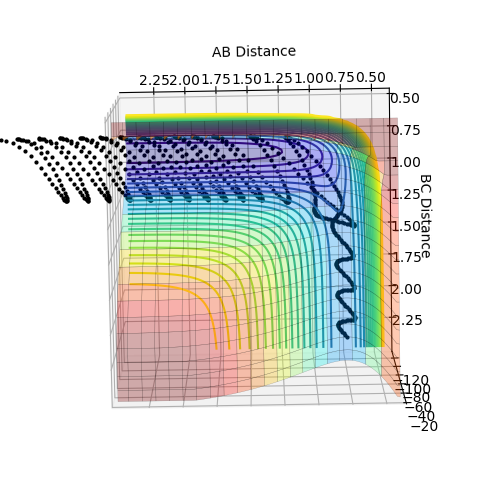
F+ H2
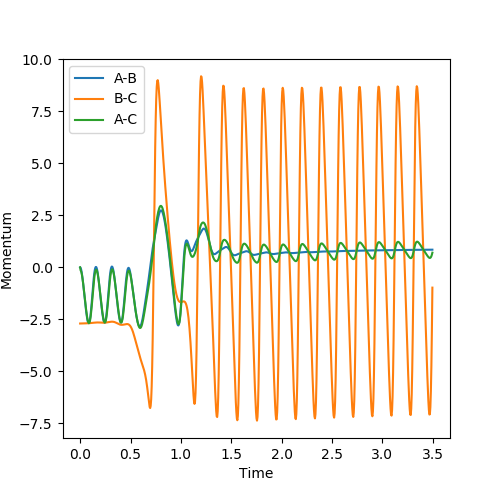
| Distance | Momentum | |
|---|---|---|
| AB | 0.74 | 0 |
| BC | 2.3 | -2.7 |
| Surface Plot | Internuclear momentum vs time |
|---|---|
 |
|
| Energy | |
|---|---|
| Kinetic | 3.837 |
| Potential | -103.886 |
| Total | -100.049 |
Question 9. In light of the fact that energy is conserved, discuss the mechanism of release of the reaction energy. How could this be confirmed experimentally?
As energy is always conserved and can only be transformed from different forms to another. It can be seen from the animation that as the H-H (AB) bond is broken and the H-F (BC) bond is formed the vibrational energy (and so the kinetic energy) considerably increases for H-F. The internuclear momentum vs time graph demonstrates this, as the momentum is much higher for the H-F atom. As the vibrational energy begins to dampen the energy will be released as heat so experimentally an increase in temperature could confirm the reaction had occurred. Spectroscopy can be used to determine the vibrational energy of the bonds formed.
| Atoms | Internuclear distance |
|---|---|
| AB | 0.74 |
| BC | 2 |
Jas213 (talk) 20:17, 28 May 2018 (BST) Good effort showing all these examples, but any comments on what your result indicate?
HF+F
| Atoms | Internuclear distance |
|---|---|
| AB | 2 |
| BC | 0.74 |
| pHH | pHF | Total Energy | Reactive? | Surface Plot | Explanation |
|---|---|---|---|---|---|
| -5 | 0.2 | -103.364 | No |  |
Approaching H rebounds and reaction doesn't complete |
A reactive pathway was found by trial and error around the reversed conditions from the reverse reaction.
| Distance | Momentum | |
|---|---|---|
| AB | 5.0 | -1.5 |
| BC | 1.2 | 1.0 |
Polanyi's Empirical Rules
Question 10. Discuss how the distribution of energy between different modes (translation and vibration) affect the efficiency of the reaction, and how this is influenced by the position of the transition state.
Polanyi's rules state that in reactions with an early transition state (most closely resembling the reactants) translational energy most effectively promotes a successful reaction. Conversely where the transition state is late (resembling products closely) vibrational energy, specifically of the reactants most effectively promotes a successful reaction. [3]
This is demonstrated in the above, where the forward reaction H2+F-> HF+H has an early transition state, as the activation barrier is so low and the transition state closely resembles the reactants. In this case a high translational energy of the incoming atom (fluorine) is more effective in resulting in a successful reaction and increasing the vibrational energy of the H2 molecule has little impact. This is illustrated nicely in the table above.
In the reverse reaction HF + H -> H2+F the transition state is late, as the activated complex much more closely resembles the product. A high vibrational energy of the HF molecule results in a successful reaction whereas increasing the translational energy of the approaching H atom has little impact.
Jas213 (talk) 20:19, 28 May 2018 (BST) Correct, you could have incorporated this discussion into the previous section and defined a reactive range of values, following the polanyi rules.
References
- ↑ https://goldbook.iupac.org/html/T/T06470.html
- ↑ https://pubs.acs.org/doi/pdf/10.1021/j100238a002
- ↑ The Journal of Chemical Physics 138, 234104 (2013); https://doi.org/10.1063/1.4810007

