MRD:mjb216
EXERCISE 1: H + H2 system
What value do the different components of the gradient of the potential energy surface have at a minimum and at a transition structure? Briefly explain how minima and transition structures can be distinguished using the curvature of the potential energy surface.
The surface energy plot can be used to identify the minimum pathway. By taking the first derivative, minimum points on the surface can be calculated, for example the reactant and product channels. ∂V(rAB)/∂rAB=0 and ∂V(rBC)/∂rBC=0 express this mathematically.
The transition state is a saddle point in which it is a maximum in relation to the minimum reaction pathway and a minimum orthogonal to the reaction pathway. This can be obtained by taking the second derivative; upon doing this you will get a maximum and minimum. Maximum points can be identified when the second derivative is less than 0; minimum points have a second derivative greater than 0. A saddle point satisfies both conditions.
Report your best estimate of the transition state position (rts) and explain your reasoning illustrating it with a “Internuclear Distances vs Time” plot for a relevant trajectory.
The transition state position can be located at a bond distance of rAB = rBC. (Since in this case, the PES is symmetric along the diagonal, the TS must be located at equal distances. The TS is unique! Fjs113 (talk) 16:06, 3 June 2018 (BST))
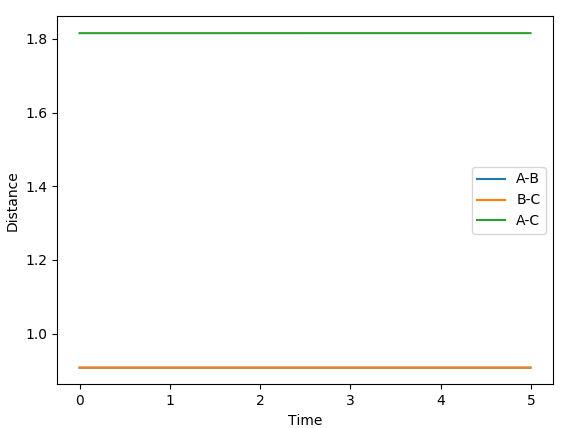
The Internuclear Distances vs. Time graph (displayed below) show that a value of 0.9077 Å has minimised the oscillation, as the line is flat. A minimum value corresponds to the transition state, as there would be no movement between A and C around B. If this was not a minimum, movement would take place and oscillation would be observed.
Comment on how the mep and the trajectory you just calculated differ.
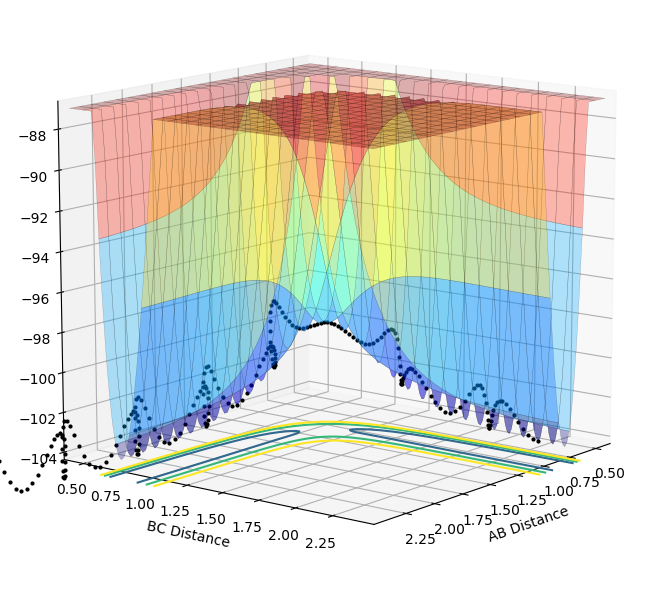
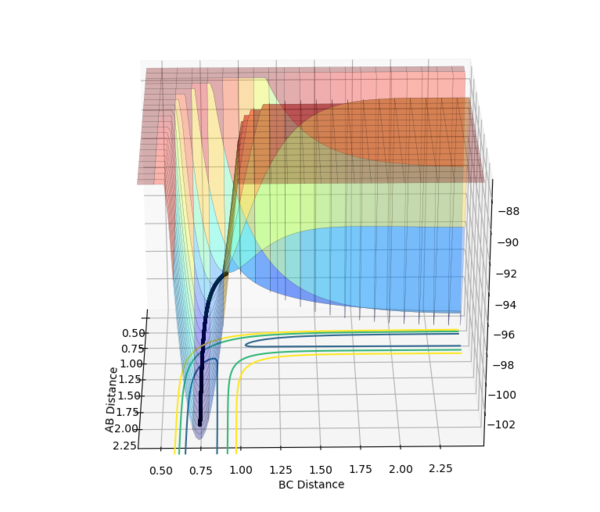
The MEP displays the minimum energy path, in which there is no oscillation due to the trajectory having infinitely slow motion. This means that after each step, the momenta is reset to 0, hence the zero oscillation as there is no accumulation of kinetic energy allowing it to move up the well. This differs from the dynamic plot, in which the motion is not infinitely slow and therefore oscillation can be observed. The plots were obtained by using the parameters rAB = 0.9087 Å | rBC = 0.9077 Å and 0 momenta.
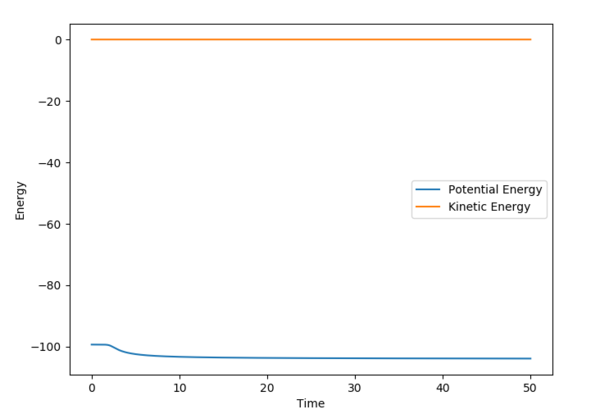
The Energy vs. Time graphs further show this; in the dynamic plot, there is a clear displacement in the potential and kinetic energies which corresponds to oscillations. In the MEP graph, the drop in potential energy is not matched with an increase in kinetic energy, due to the infinitely slow motion.
| Dynamic | MEP | |
|---|---|---|
| Surface Plot | 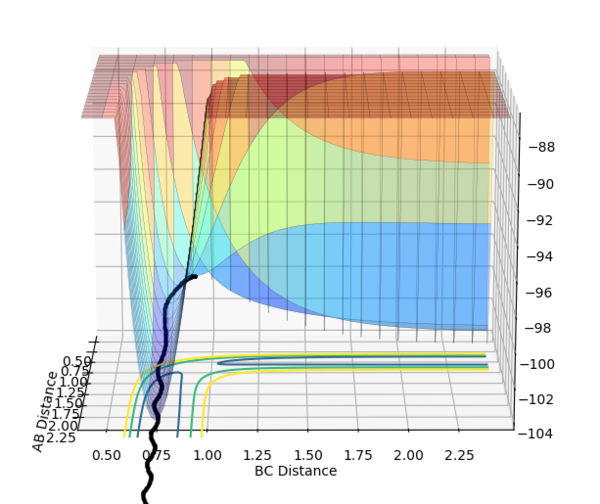 |
|
| Energy vs. Time Plot | 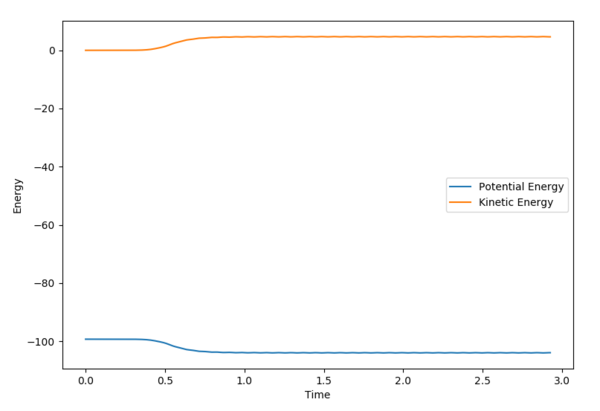 |
|
If the parameters were reversed, i.e. rAB = 0.9077 Å, rBC = 0.9087 Å and 0 momenta, the reaction would proceed back to the reactant states, down the channel perpendicular to the one observed above.
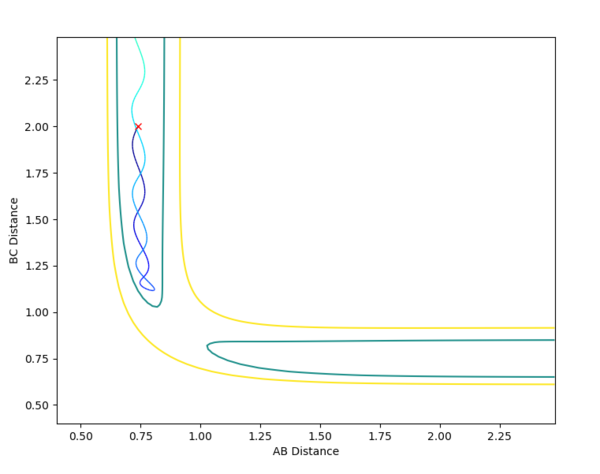
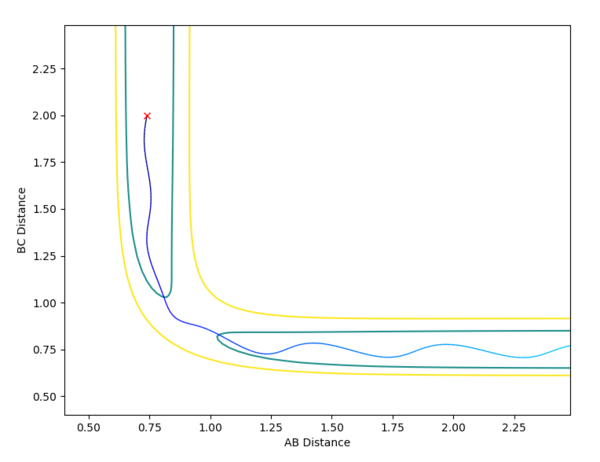
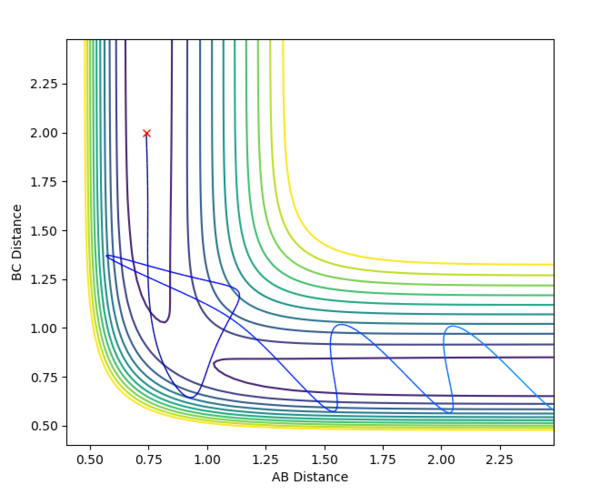
Complete the table by adding a column with the total energy, and another column reporting if the trajectory is reactive or unreactive. For each set of initial conditions, provide a plot of the trajectory and a small description for what happens along the trajectory.
Initial positions r1 = 0.74 and r2 = 2.0
(This is very well done. Fjs113 (talk) 16:06, 3 June 2018 (BST))
Transition state theory
Transition state theory makes the assumption that nuclei behave under classical mechanical conditions. It states that reactants must proceed over an energy barrier, in the form of a saddle point (transition state) to reach the products. In addition, once the reactants have passed over the transition state, they must form products.[1]
Looking at the 5 different calculations from above; it is clear that in the case of 4 crossing of the transition state occurs, however, instead of resulting in product formation the reactants are reformed. This breaks the assumption that once the reactants have passed over the transition state they will convert to products.
Transition state theory is also contradicted by the quantum mechanical process of tunneling. Instead of gaining enough energy to overcome the transition state, the reactants tunnel through the energy barrier quantum mechanically; this clearly breaks the idea that reactants must pass through the transition state to reach products.
Finally, the theory breaks down at high temperatures. The theory assumes that the reactants will pass over the lowest energy point, i.e. the saddle point (transition state). This is clearly not the case, as at higher temperatures higher vibrational energy levels are populated (giving the molecule more vibrational energy). This can be seen by the reaction trajectories of calculation 4 & 5 above.
(This is all very good, but you have not said how these effects will affect predictions of the reaction rate. Fjs113 (talk) 16:06, 3 June 2018 (BST))
EXERCISE 2: F - H - H system
Classify the F + H2 and H + HF reactions according to their energetics (endothermic or exothermic). How does this relate to the bond strength of the chemical species involved?
H - H Bond enthalpy: 435 KJmol-1 H - F Bond enthalpy: 569 kJmol-1[2]
Locate the approximate position of the transition state.
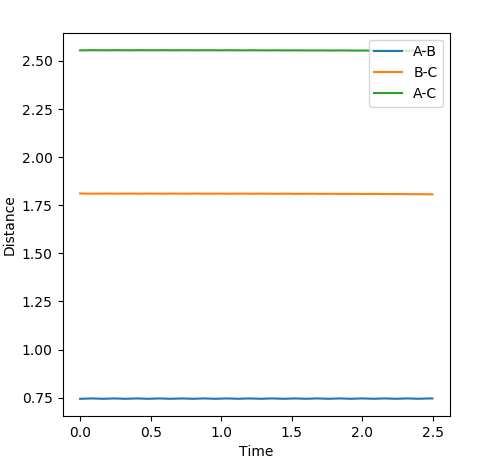
The transition state was located using Hammond's postulate to determine the approximate region of the transition state. In this case, due to the exothermic nature of the H-H + F --> H-F + H reaction the transition state will resemble the reactants. The distances calculated were r1 (AB) = 0.744 Å ; r2 (BC) = 1.811 Å. The graph of distances vs. time shows that the distances obtained correspond to that of the transition state using the same rationale as for the H-H-H system above (no oscillations).
Report the activation energy for both reactions.
Once the transition state is located, the A-B and B-B distances can be distorted slightly and then an MEP calculation can be run to determine values for the activation energy of the two reactions.
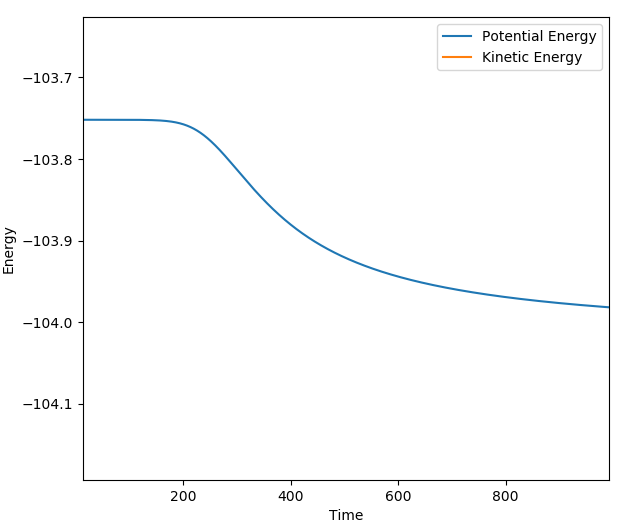
The reaction of H-H + F --> H + H-F has an activation energy of ~0.2 kcalmol-1. The parameters used for the calculation were as followed: r1 (H-H) = 0.744 Å ; r2 (H-F) = 1.8111 Å ; pAB=pBC=0 ; step = 200000. The information to calculate Ea was extracted from the Energy vs. time graph below; (-103.95) - (-103.75) = 0.2 kcalmol-1. The activation is very low as H-F formation is very favorable from H-H.
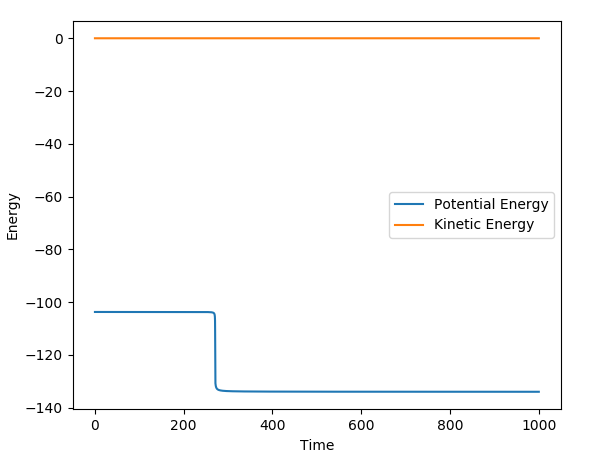
The reaction of H + H-F --> H-H + F has an activation energy of ~30 kcalmol-1. The parameters used for the calculation were as followed: r1 (H-H) = 0.744 Å ; r2 (H-F) = 1.801 Å ; pAB=pBC=0 ; step = 200000. The information to calculate Ea was extracted from the Energy vs. time graph below; (-103.75 - (-134) = 30.25 kcalmol-1. The activation is very much higher for H-H formation from H-F as this is an unfavourable reaction thermodynamically, as shown above using bond enthalpies.
Reaction Dynamics
Identify a set of initial conditions that results in a reactive trajectory for the F + H2
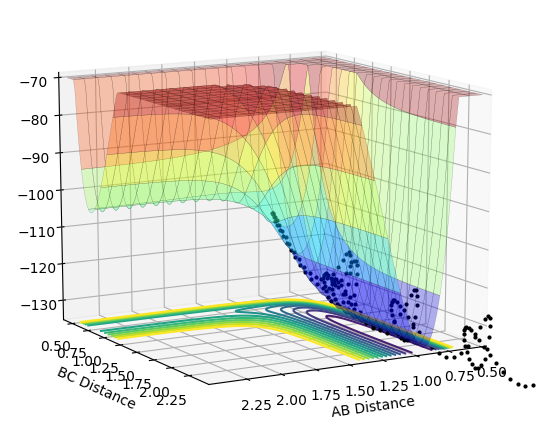
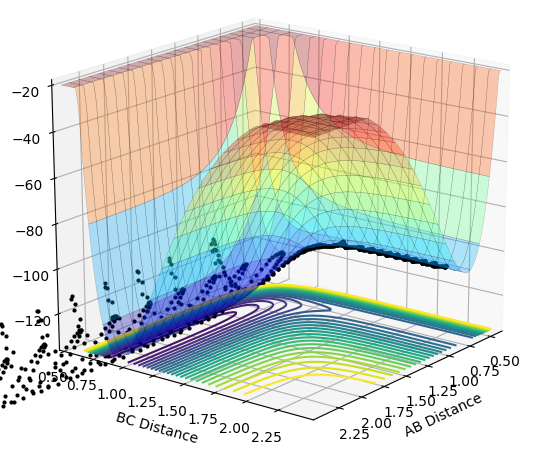
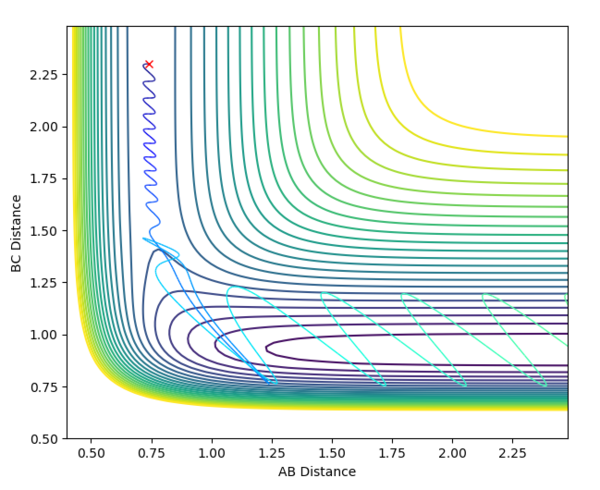
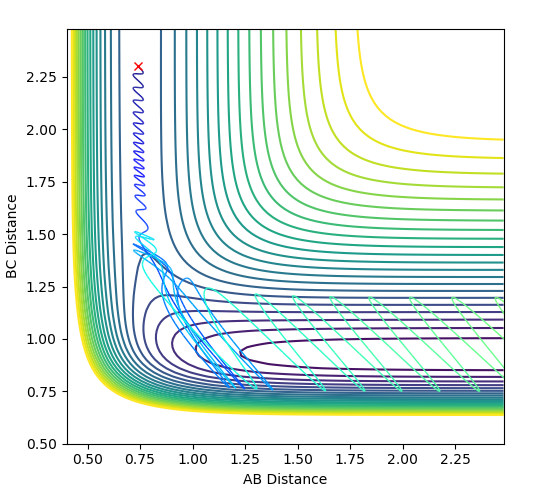
The initial conditions selected for the reaction of H2 + F are as follows: AB distance = 0.74 Å ; BC distance = 2.3 Å ; pAB = -1.0 ; pBC = -1.0 The contour and surface plots displayed below shown that a reactive trajectory has been achieved.
 |
|
|---|---|
| Surface Plot | Contour Plot |
In light of the fact that energy is conserved, discuss the mechanism of release of the reaction energy. How could this be confirmed experimentally?
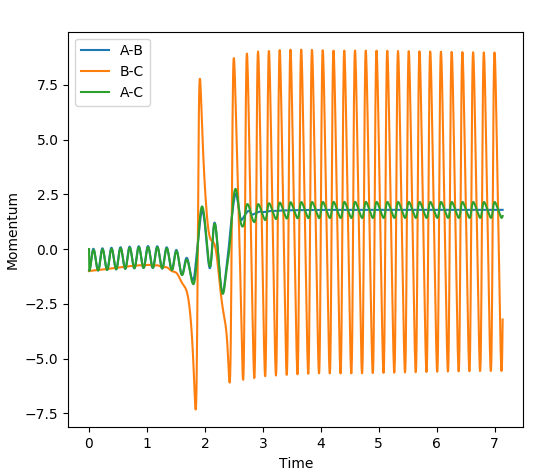
The reaction of F + H2 --> H-F + H is highly exothermic, with a ΔH = -134 kJmol-1. The reason for this large negative enthalpy is because H-F is a more stable molecule than H2, with the H-F bond formation being the driving force of the reaction. The loss of potential energy after the collision of H2 with F is converted into kinetic energy in the form of vibrational energy (satisfying the first law of thermodynaics: energy can neither be created nor destroyed merely converted from one for to another). This large increase in vibrational energy can be seen in the plot of Internuclear momenta vs. time below. At approximately time = 2, after the collapse of the transition state, the amplitude of the oscillations of the H-F bond increase significantly corresponding to the large increase in kinetic energy. The high kinetic energy of the molecule will cause an increase in temperature due to the transfer of energy either to other molecules (via collisions with H-F), or relaxation down to lower vibrational states. This increase in temperature indicates the release of potential energy.
F + H2
Conditions: rHH = 0.74 Å ; rHF = 2.3 Å ; pHF = -0.5
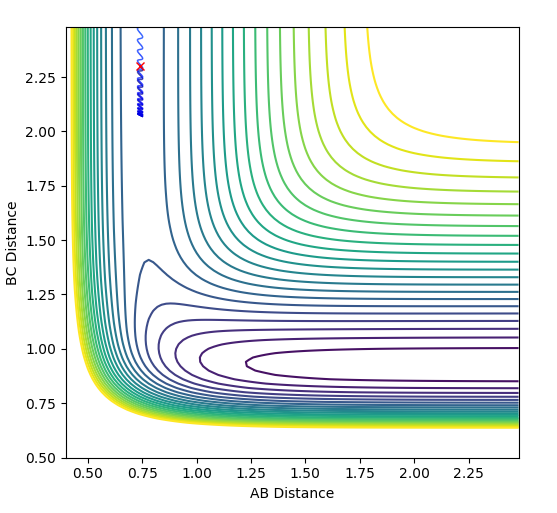
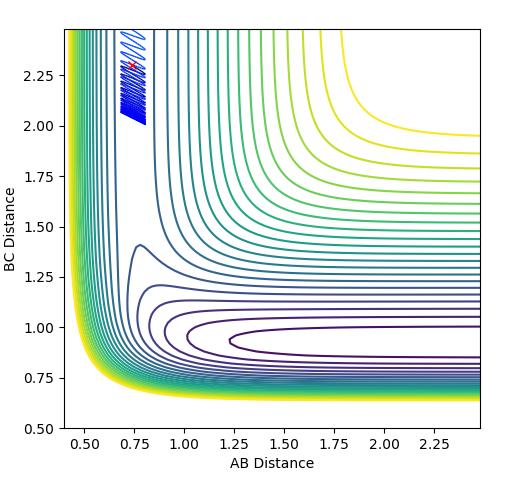
| pHH | Surface Plot | Contour Plot | Reactivity |
|---|---|---|---|
| -3.0 | 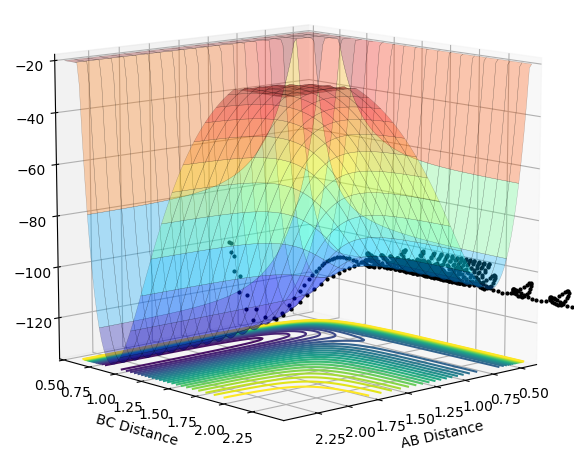 |
 |
Unreactive |
| -2.0 | 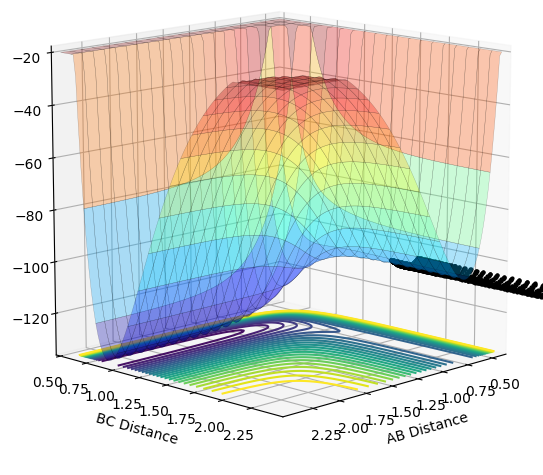 |
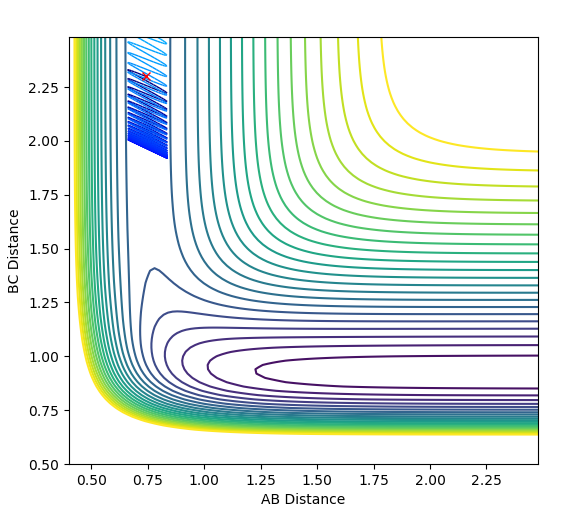 |
Unreactive |
| -1.0 | 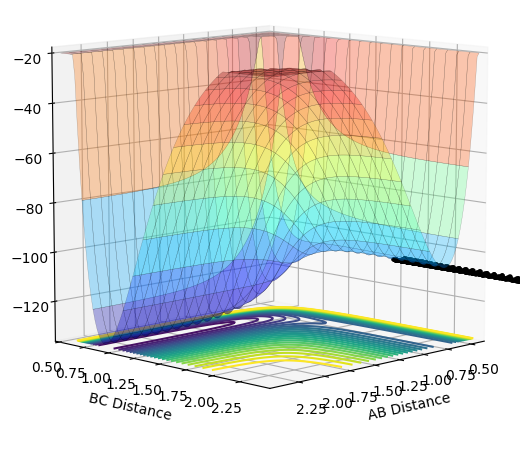 |
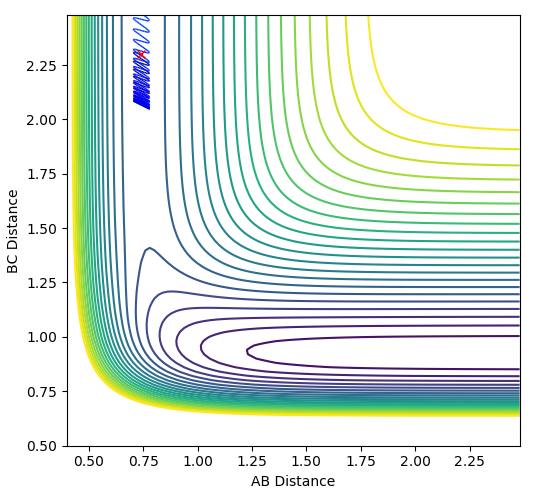 |
Unreactive |
| 0.0 | 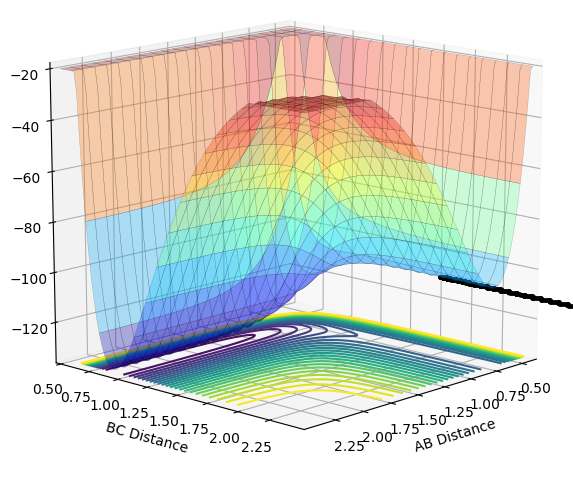 |
 |
Unreactive |
| 1.0 | 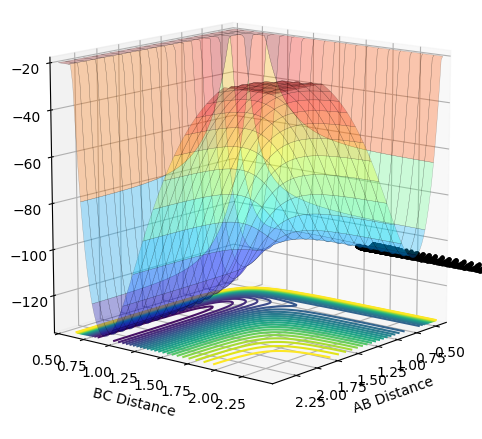 |
 |
Unreactive |
| 2.0 | 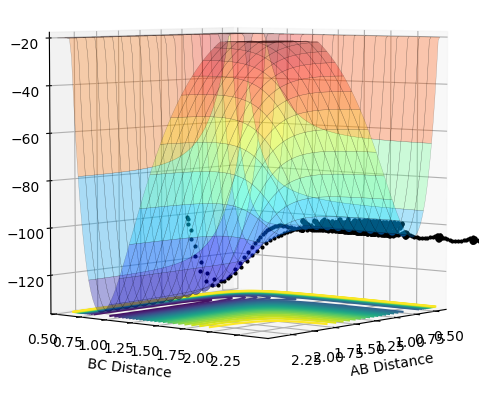 |
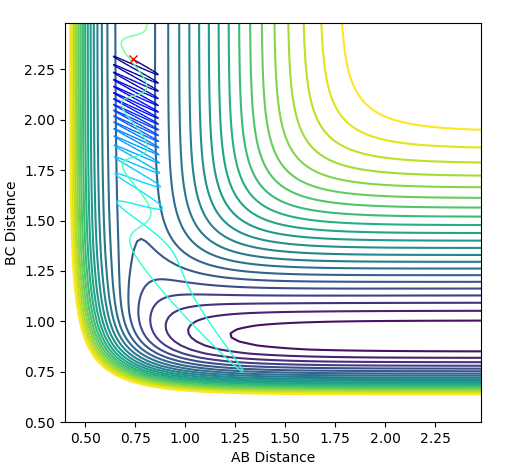 |
Unreactive |
| 2.0 | 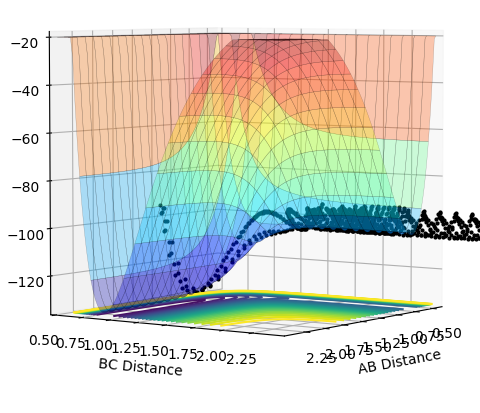 |
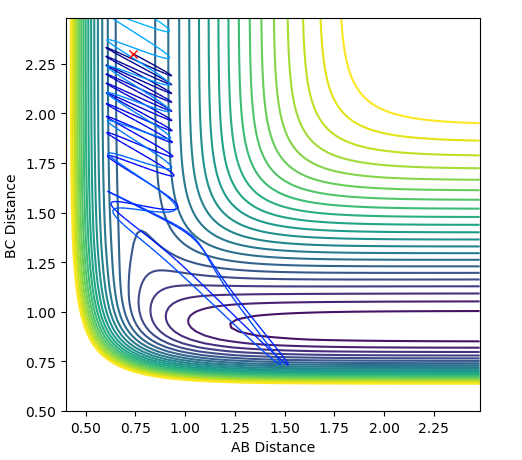 |
Unreactive |
The plots above vary the H-H momentum for the reaction of F + H-H which shows that this does not allow the reaction to proceed to completion.
Comparison of F + H-H and H-F + H reactions
| H-H + F --> H + H-F | H + H-F --> H-H + F |
|---|---|
 |
|
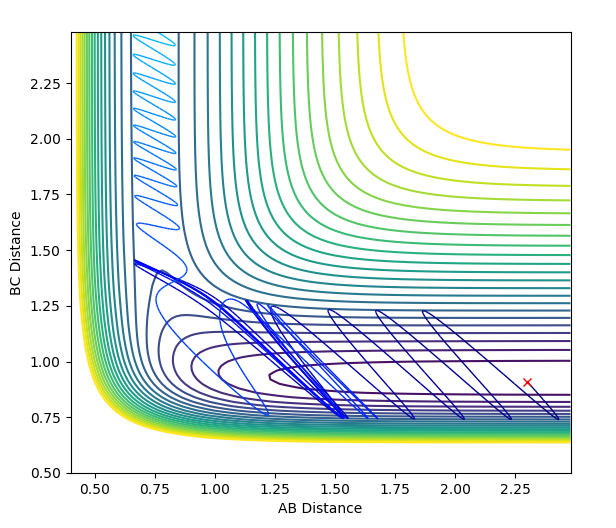
| Conditions: rHH = 0.74 Å ; rHF = 2.3 Å ; pHF = 0.1 ; pHF = -0.8 | Conditions: rHH = 2.3 Å ; rHF = 0.91 Å ; pHF = -1.0 ; pHF = -9.0 |
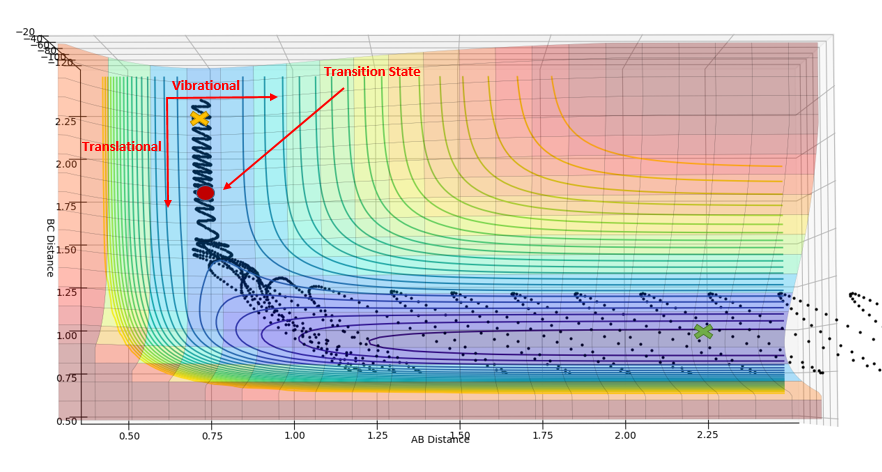
Polyani's empirical rules state that for an early transition state, translational energy is more efficient in facilitating the reaction (overcoming the transition state). On the other hand, a late transition state requires more vibrational energy to overcome the transition state.[3][4]
The reaction of H2 + F --> H + H-F only proceeds to HF formation when pHF is increased as the reaction has an early transition state, which can be concluded using Hammond's postulate as the transition state resembles the reactants; the reaction is exothermic. Using the diagram below, it can be seen that starting from the orange cross, which is the reaction start for H2 + F, translational energy is required to overcome the transition state. This explains why changing the values of pHH does not facilitate the reaction, as vibrational energy is not efficient for facilitating an early transition state as explained by Polyani's rules.
(This is great! Fjs113 (talk) 16:06, 3 June 2018 (BST))
The reaction of H + H-F --> H-H + F only proceeds to H-H formation when pHH is increased, as this increases the vibrational motion of the system. This is important as the transition state for this reaction is late; the reaction is endothermic. The green cross on the diagram above shows the starting point of this reaction; an increase in vibrational energy will allow the reaction trajectory to reach the transition state and proceed to the products, as stated by Polyani's rules.
References
- ↑ M. J. Pilling, P. W. Seakins Reaction Kinetics, 2nd edition, OUP, 1995
- ↑ http://www4.ncsu.edu/~shultz/Common_Bond_enthalpies.pdf
- ↑ J. I. Steinfeld, J. S. Francisco, W. L. Hase Chemical Kinetic and Dynamics Prentice-Hall
- ↑ Atkins and de Paula: Physical Chemistry, 7th Edition

