MRD:mhz15
Introduction
This is the page created by Hafiz Zainal to report the results of his Molecular Reaction Dynamics simulation using MATLAB.
H + H2 System
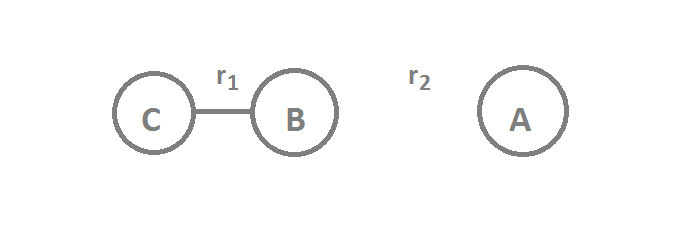
The reaction between an H2 molecule and an H atom is discussed below through the use of plots obtained from MATLAB.
Surface plot
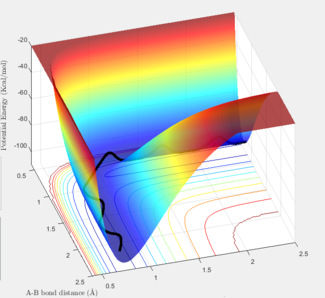
The surface plot shows the variation of potential energy of an H atom in collision with an H2 molecule.
The blue-red spectrum corresponds to the potential energy range with blue being the minimum and red the maximum.
The black wavy line illustrates the path of H2 along the minimum vibrational energy of the diatomic molecule.
Interpreting the distance vs time plot

At the beginning of the sequence, r2, corresponding to the internuclear distance of HA-HB, decreases from ~2.3 Å to a minimum ~0.6 Å where it oscillates relative to the middle HB atom.
r1, corresponding to the internuclear distance of HB-HC, increases as HA approaches HB. Eventually HC breaks away from the attraction of HB and moves away to a maximum r1.
The sequence shown illustrates the transition state where r1 is equal to r2 at about 0.9 Å.
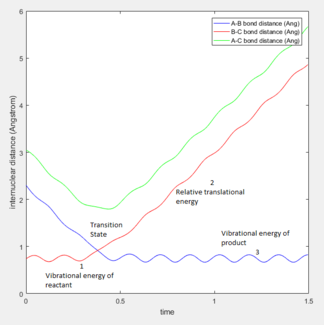
The animation still mentioned above ties in with the discussion of the H - H2 reaction dynamics in terms of internuclear distance.
The H atoms in molecule HC-HB (shown in red) maintain their oscillation while HA moves closer towards HB, illustrated in blue.
The potential energy of HA, relative to the two other H atoms, increases as it approaches HB up to a point - the transition state - where the the internuclear distance of HA and HB equals that of HB and HC.
As has been mentioned above, HA oscillates around HB, shown in blue, past the transition state, and HC gains kinetic energy as it moves away and loses potential energy.

The plot illustrates the trajectory of the transition state at r1 = r2 = rts when rts is approximated to 0.9078 Å and p1 = p2 = 0.
The gradient of the trajectory is zero. The internuclear distance between HA and HB is around 1.8 Å which agrees with the approximated value at which the transition state forms, as shown in the above still of the reaction animation.
Reaction path
 |
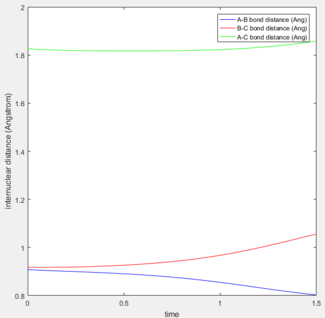 |
The above internuclear distance vs time plots show the path of the reaction starting from the transition state, when r2 = rts = 0.9078 Å and r1 = rts + 0.01 and the momenta p1 and p2 set to 0.
The reaction path in mep refers to the trajectory along the minimum energy pathway.
Reactive and unreactive trajectories
Trajectories with the following momenta combination were run while p1 = p2 = 0:
| p1 | p2 | Reactivity |
|---|---|---|
| -1.25 | -2.5 | Reactive |
| -1.5 | -2.0 | Unreactive |
| -1.5 | -2.5 | Unreactive |
| -2.5 | -5.0 | Unreactive |
| -2.5 | -5.2 | Reactive |
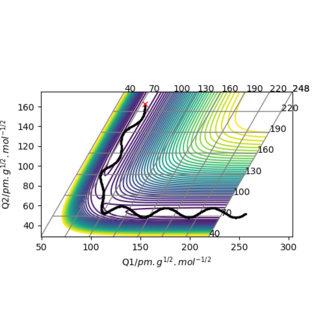
The reaction pathway crosses the route along the floor of the potential valley, which is the path that requires the H2 and H molecules to have relatively small initial kinetic energies.
This pathway takes the reactant molecules to regions of least potential energy, as r1 increases as the HA atom approaches HB.
The trajectory continues its path as HC moves away and the new HA-HB bond forms.

The reaction pathway does not go along the floor of the potential valley - it stops at the point where the H2 molecule possesses equilibrium bond length.
The HA-HB bond does not form.

The reaction pathway moves along the floor of the potential valley.
This pathway takes the reactant molecules to regions of least potential energy, as r1 increases as the HA atom approaches HB.
The trajectory continues its path as HC moves away and the new HA-HB bond forms.

The trajectory moves along a different path that does not cross the saddle point - a path that makes the reaction feasible if the molecules have enough initial kinetic energy.
HA forms a bond with HB as the trajectory crosses past the saddle point but it moves back towards the initial path.
The HA-HB bond breaks again.

The trajectory moves along a different path and does not cross the saddle point.
This path requires higher initial kinetic energy. The trajectory continues along the path down the floor of the other valley, after the formation of the new HA-HB bond.
F - H - H System
Classifying endothermic and exothermic reactions
In the H + HF reaction, the bond breaking is between the hydrogen and fluorine atoms. The H-F bond is relatively stronger due to a large difference of electronegativities between that of hyrodgen and fluorine atoms. Fluorine attracts the hydrogen atom stronger. Thus a large amount of energy is required to break the bond, and this makes the H + HF reaction endothermic.
In the F + H2 reaction, the bond breaking is between the two hydrogen atoms. The H-H bond is relatively weaker due to an approximately zero difference of electronegativities between the two atoms. A smaller amount of energy is required to break the H-H bond, thus the reaction is exothermic.
The transition state
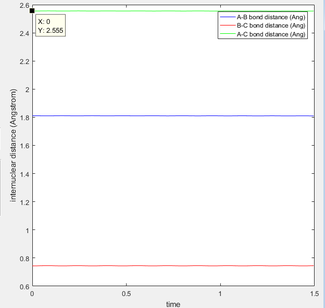
The plot on the center illustrates the transition state of an F - H - H reaction, and it occurs when rFH = 1.811 Å and rHH = 0.744 Å, and the initial momenta set to 0.
Activation energies

In the F + H2 reaction, the transition state resembles the reactants more due to its exothermic nature. Thus the difference between the highest point of kinetic energy and the lowest point on the side of the reactants is equal to the activation energy. The activation energy is found to be 22.574 kcal/mol.
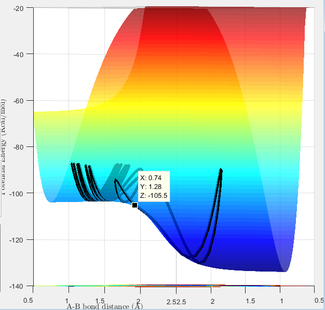
In the H + HF reaction, the transition state resembles the products more due to its endothermic nature. Thus the difference between the highest point of kinetic energy and the lowest point on the side of the products is equal to the activation energy. The activation energy was found to be 28 kcal/mol.
Reaction dynamics
F + H2 reaction
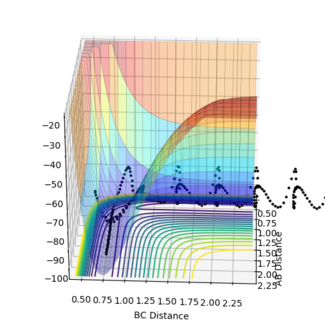
The reactive trajectory was found using initial conditions of rFH = 1.48 Å and rHH = 0.74 Å, while momenta were set to 0.
As F approaches HB and forms a bond with the atom, its potential energy increases, and HA, the leaving atom, loses potential energy and gains kinetic energy.
Testing different pHH and pFH values
 |
 |
 |
 |
 |
 |
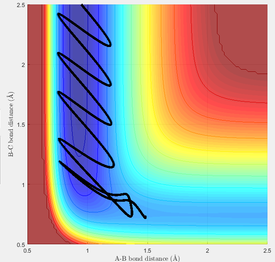
A range of values for pHH from -3.0 to 3.0 was explored with the trajectory starting at the bottom of the well. The conditions used were rFH = 1.48 Å, rHH = 0.74 Å and pFH = -0.5. In all of the reactions tested, the products are converted back to the reactants. This is due to there being an excessive amount of energy into the system.
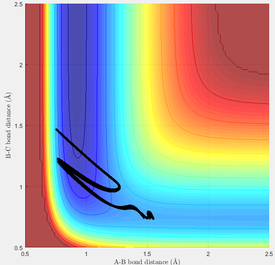
Using the same initial conditions as above, the reaction was tested with pFH = -0.8 and pHH = 0.1, reducing the overall energy of the system.
The trajectory leads to a reaction but HC and F remain in oscillation relative to the central HB.
H + HF reaction

The value of pHH was set to a high value above the activation energy.

The trajectory leads to a reaction when pHF = -0.1 and pHH = -1.2.
