
MRD:mg4417
Distance and momentum

Distances and momenta abbreviations used throughout this page correspond to those on the image (right), in this case a reaction between a hydrogen molecule and a hydrogen atom. p1 is the momentum on the interatomic distance r1 and p2 the same for r2. Distances all have units of Å and the unit of energy is unspecificied.
Exercise 1: H + H2 system
Dynamics from the transition state region
On a potential energy surface diagram, how is the transition state mathematically defined? How can the transition state be identified, and how can it be distinguished from a local minimum of the potential energy surface?
Mathematically, the transition state is a saddle point, that is a stationary point (gradient of zero) but that is not a local extremum. The second derivative test can distinguish saddle points from local minima and maxima. In the case that we just want to find the maximum on the minimum energy path, a local maximum can be found by taking a second derivative of stationary points, a local maximum will have a negative second derivative.
Good, it is a maximum on the LOWEST energy pathway, but what does the pathway link in the reaction? Consider giving information on the minimum too, will it be greater/less than or equal to 0? Mys18 (talk) 19:40, 14 May 2019 (BST)
Trajectories from r1 = r2: locating the transition state
Report your best estimate of the transition state position (rts) and explain your reasoning illustrating it with a “Internuclear Distances vs Time” plot for a relevant trajectory.
The transition state is difficult to precisely locate from visual inspection of a potential energy surface. Different distances were tested, with r1 = r2, and p1 = p2 = 0.0, and the internuclear distance vs. time plot used to determine the transition state, at which the molecules are expected to not move. A constant internuclear distance between the two reactants should be observed, with no vibration. Values were manually adjusted until a reasonably straight line was observed at r= 0.9077(42497875...).
-
 r= 1
r= 1 -
 r= 0.9
 -
 r= 0.9077 (4 s.f.)


Momentum vs time plots can be used to confirm that the involved species are relatively stationary since the momentum would ideally be zero in this model. A a plot showing very low momentum (periodic, aplitude: 9e-13) is produced with r=0.9077424978755.
Trajectories from r1 = rts+δ, r2 = rts
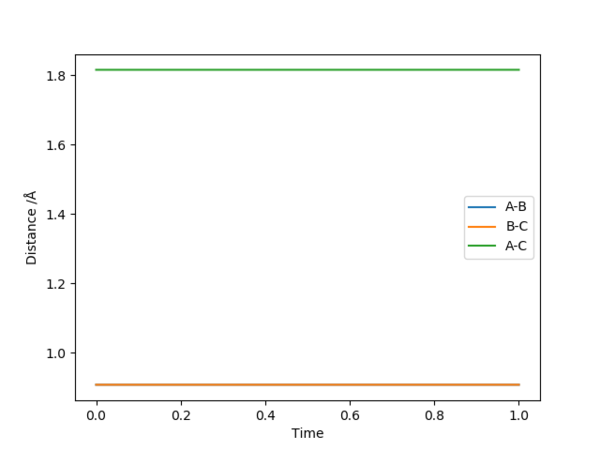
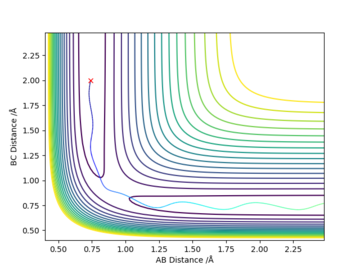
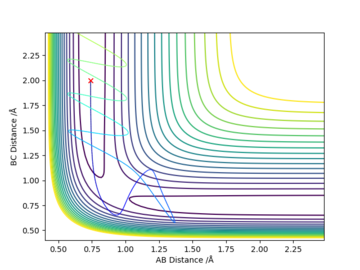
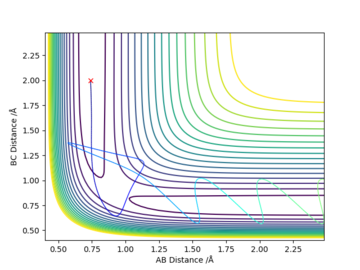
Initial conditions r1 = rts+0.01, r2 = rts and momenta p1 = p2 = 0 give a reaction path from a structure close to the transition state structure. An MEP (minimum energy path) trajectory calculation gives a trajectory corresponding to infinitely slow motion by resetting the momentum to zero at each step. This is a good method for quickly identifying trajectories but it is does not reflect the real motion of chemical species, mass is ignored so inertial motion is not accounted for.
-
 MEP
MEP -
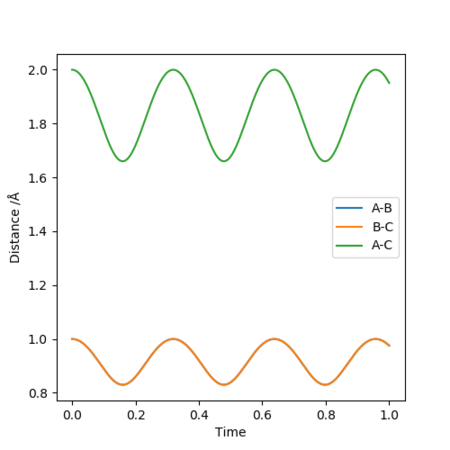
 Dynamics


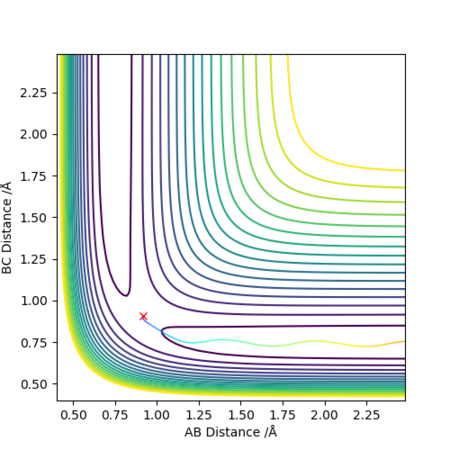
The MEP path is a straight line along the valley floor, whilst the dynamic calculation produces an oscillating trajectory. MEP shows a drop in total energy since potential becomes more negative and kinetic energy is set to zero by the method. Total energy remains constant in the dynamics model since kinetic energy can increase. In both models, the molecules move away with a final constant velocity however the dynamic model has vibrating bonds that are not present in the MEP animation.
Great explanation and description of the oscillating/straight line seen on the relevant contour plot! What are your units for r...? Mys18 (talk) 19:53, 14 May 2019 (BST)
Reactive and unreactive trajectories
Initial positions r1 = 0.74 and r2 = 2.0
| p1 | p2 | Etot | Reactive? | Description of the dynamics |
|---|---|---|---|---|
| -1.25 | -2.5 | -99.02 | yes | Typical. Species approach and reaction smoothly takes place. Products drift apart. |
| -1.5 | -2.0 | -100.46 | no | H approaches, both reactants "repel" at a distance of around 1.1 Å. |
| -1.5 | -2.5 | -98.95 | yes | Very similar to first trajectory. Slightly faster vibrations. |
| -2.5 | -5.0 | -84.95 | no* | H approaches molecule, forms something resembling the products momentarily, central atom goes back to product hydrogen atom after a few vibrations. Initial products reformed. 2 "exchanges" of the central atom between the other two as compared to the single "exchange" in the previous reacting trajectories. |
| -2.5 | -5.2 | -83.40 | yes* | Similar to previous model except the central atom goes back to the reacting hydrogen atom at the end and the products are formed. 3 "exchanges" of the central atom between the other two. |
-
 p1=-1.25, p2=-2.5
 -
 p1=-1.5, p2=-2.0
 -
 p1=-1.5, p2=-2.5
 -
 p1=-2.5, p2=-5.0
 -
 p1=-2.5, p2=-5.2


We can see that, generally, increased momentum increases the likelihood of reaction due to increased energy but the reaction can "go back" to the reactants with a momentum that is too high.
Precisely! A higher KE does not guarantee a successful reaction. Do you know the scientific terminology that describes 'going back' to reactants despite crossing over the TS to get to products? Mys18 (talk) 19:57, 14 May 2019 (BST)
State what are the main assumptions of Transition State Theory. Given the results you have obtained, how will Transition State Theory predictions for reaction rate values compare with experimental values?
The models used here assume classical mechanics and ignore quantisation and quantum effects such as tunnelling. Collisions have also been treated as perfectly elastic, not accounting for other energy transfer. Transition state theory assumes the reactants and transition state are in a type of equilibrium and energies are in a perfect Boltzmann distribution. The theory is likely to fail at very high temperatures when, for example, complications in the reaction model arise from high vibrational states becoming occupied.
Sure, it might be worth reading up on transition state theory to think about some more assumptions... consider an assumption that mentions going from reactants to products and then back to reactants, what about the Born-Oppenheimer approximation? How do you think this will affect the rate of reaction? Mys18 (talk) 20:02, 14 May 2019 (BST)
Exercise 2: F - H - H system
Note: all tests are done with r1 representing the distance between F and H and r2 the distance between H and H.
PES inspection

By inspecting the potential energy surfaces, classify the F + H2 and H + HF reactions according to their energetics (endothermic or exothermic). How does this relate to the bond strength of the chemical species involved?
F + H2 is exothermic and H + HF is endothermic, this suggests that the HF bond requires more energy to break and is stronger than the bond in the hydrogen molecule.
Correct. Perhaps one more sentence to fully explain this - is it the net effect from the corresponding values of bond-breaking and bond-forming giving an overall exo/endo reaction? Mys18 (talk) 20:09, 14 May 2019 (BST)
Locate the approximate position of the transition state.
Hammond's postulate tells us that the transition state is likely closer to the F + H2 structure. With this insight and through similar methods to those used for the H-H-H system, the transition state is found to be around r1= 1.810(7528...) and r2= 0.7448(785...).
Great, nice to see how you arrived at this value. Units? Mys18 (talk) 20:12, 14 May 2019 (BST)
Report the activation energy for both reactions.
Estimated by performing a mep from structures close to the transition state (r1+0.01, r1-0.01), and plotting energy against time.
F + H2: 0.264, H + HF: 30.266
These values are difficult to interpret without any units...however the number looks good if it is based on one out of the two units: a) kcal/mol b) kJ/mol Mys18 (talk) 20:15, 14 May 2019 (BST)
Reaction dynamics

In light of the fact that energy is conserved, discuss the mechanism of release of the reaction energy. Explain how this could be confirmed experimentally.
Model is a reactive trajectory of F + H2 (r1= 2.25, r2= 0.74, p1= -0.8, p2= 0.1.)
Initially, there are large vibrations of the HF bond, as shown by large oscillations in the momentum. Over time, these oscillations decrease in amplitude due to the release of reaction energy as heat. This can be experimentally measured by recording the temperature of a reaction system over the course of the reaction.
Which graph are you referring to and which curve oscillations are you referring to, B-C or A-B? Is B-C related to H-H or H-F? Good, you are right we can measure the temperature change - what is a well defined experiment that records this in a closed vessel? Also - as you mentioned vibrations, do you think we can study vibrational energies? Mys18 (talk) 20:21, 14 May 2019 (BST)
Discuss how the distribution of energy between different modes (translation and vibration) affect the efficiency of the reaction, and how this is influenced by the position of the transition state.
A trajectory starting on the side of the reactants of F + H2 (r1= 2.25, r2= 0.74, p1= -0.5, p2= -3 to 3) is unreactive, p2>3 results in reactive trajectories. p1= -0.8 and p2= 0.1 results in a reactive trajectory.
Initial conditions for the H + HF reaction starting at the bottom of the channel (r1= 0.875, r2= 2.475), with low vibrational motion on on the H - F bond, and high value of pHH above the activation energy (an H atom colliding with a high kinetic energy) produced nonreactive trajectories. Increasing the momentum of the H-F vibration to 5.20 and decreasing the momentum of the approaching H atom to -2.15718 (500 steps of size 0.002) produced a reactive trajectory.
F + H2 has an early barrier, increased kinetic energy and reduced vibrational energy appears to be effective in overcoming the transition state. H + HF has a late barrier, increased vibration energy is effective in overcoming barrier, kinetic energy is not very effective.
Precisely! Overall, great job on your report, there is clear understanding of the theory and good application of this in your answers. In terms of linking your own data to your answers, it would be worthwhile labelling your graphs with 'Figure 1, Figure 2' etc. Don't forget to include units in all your answers as a number is quite meaningless without it. Nice work :) Mys18 (talk) 20:25, 14 May 2019 (BST)
- ↑ https://wiki.ch.ic.ac.uk/wiki/index.php?title=CP3MD#Running_and_visualising_a_trajectory