MRD:mfc16
Exercise 1: H2+H system
Transition states and minimas
The transition state of the triatomic system is defined as the maximum of the minimum energy path on the potential energy surface. This kind of feature is known as a saddle point, and is found by looking at the curvature of the potential energy surface. For the H2+H system, the total energy gradient for the transition state and for the minimum is 0 for all stationary points, ie ∂V(ri)/∂ri=0. To differentiate the transition state from a minimum, one must look at the second derivative of the potential energy curve. Derivatives are with respect to three coordinates, the bond lengths of Hb-Hc and Ha-Hb as well as the bond angle between those bonds. The triatomic system considered here is assumed to have a bond angle of 180 degrees and thus we only deal with two out of three degrees of freedom. A saddle point is observed when:
∂f/∂x=0, ∂f/∂y=0 and fxxfyy-fxy2 > 0
Mm10114 (talk) 18:35, 31 May 2018 (BST) Nicely and clearly explained. Well done.
Locating the Transition state
The transition state ought to be on a reactive path between the reactants and products, thus the momenta are fixed to 0 because otherwise the system wouldn't be in the minimum well. A rough estimate of its location is done by looking at the contour plot. Furthermore, at the transition state, both AB and BC distances should be equal since the system is a symmetric reaction.
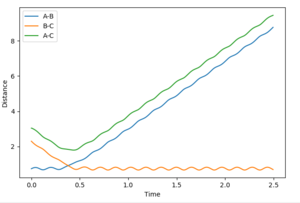
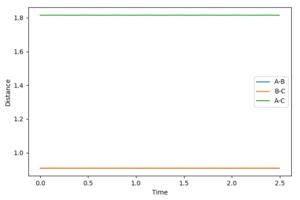
At the transition state the bonds do not oscillate, the plot should therefore show two horizontal flat lines. This is obtained when r1=r2=0.90755 Å.
Differences between dynamics and MEP settings
The minimum energy path (mep) is the lowest energy reaction path leading to the formation of products. The variation of potential energy along the mep is best described as a well rather than a barrier.
Contour maps
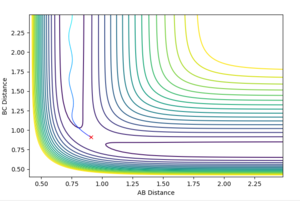
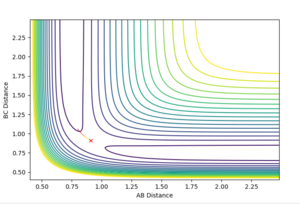
The dynamics setting shows the 'real' reaction pathway with the bonds oscillating whereas the MEP setting gives a curve that goes through the lowest energy path without any oscillations. The mep setting also show a much shorter trajectory compared with the dynamics method that extends beyond the saddle point, this is because the mep calculates the motion of atoms in small fractions with the momentum of the molecule set to zero at the start of each fraction. To observe a longer trajectory one would need to increase the number of steps.
Internuclear distance vs time
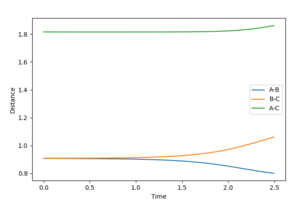

These graphs show that the molecule does not show an oscillating behaviour when the MEP settings are used, whereas the molecule indeed oscillates in the dynamics settings.
Mm10114 (talk) 18:35, 31 May 2018 (BST) So why exactly the bonds oscillate in dynamics, whereas in MEP don't? You should clearly state that.
Reactive and unreactive trajectories
| p1 | p2 | Total energy | Type of trajectory | contour plot | Description |
|---|---|---|---|---|---|
| -1.25 | -2.5 | -99.119 | Reactive | 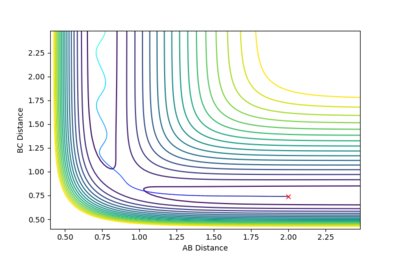 |
The reaction path heads towards the products minimum region. The A-B molecule starts oscillating slowly, but oscillates faster after the B-C is formed. |
| -1.5 | -2.0 | -100.456 | Unreactive | 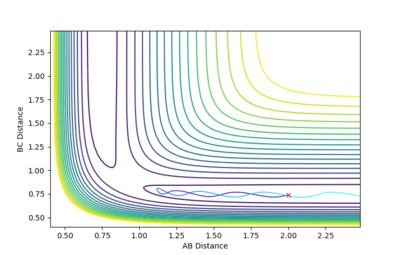 |
The A-B bond is oscillating, but the momenta of molecules AB and C combined are not strong enough to overcome repulsion forces and lead to the formation of the BC molecule. |
| -1.5 | -2.0 | -98.956 | Reactive | 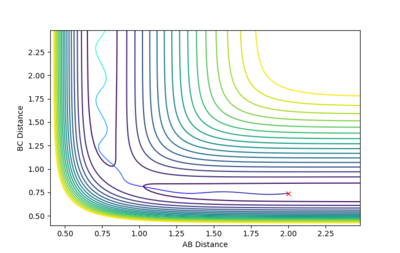 |
This trajectory is very similar to the first one, with the main difference being that before formation of the B-C bond, the A-B bond length stretches as C approaches. |
| -2.5 | -5.0 | -84.956 | Unreactive | 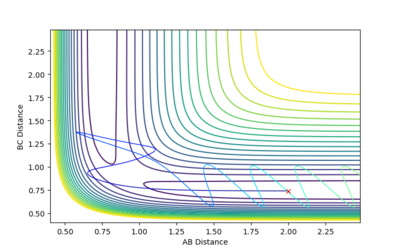 |
In this reaction, the AC bond does not oscillate initially. However, collision with atom C leads to a strongly vibrating BC bond which then causes the AB bond to stop oscillating. This trajectory is unreactive because the trajectory does not move towards the products since the transition state is isn't high enough in energy. Mm10114 (talk) 18:35, 31 May 2018 (BST) "So, it "is" or it "isn't"? |
| -2.5 | -5.2 | -83.416 | Reactive | 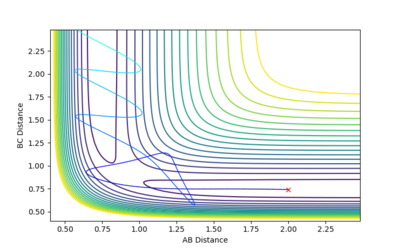 |
This plot is very similar to the one before, it even looks like its mirror image but this time the trajectory is in the product channel and has enough energy to lead to the formation of products. The AB product vibrates strongly. |
Mm10114 (talk) 18:35, 31 May 2018 (BST) Overall good observations. In the last two cases you should discuss the fact the transition state is crossed more than once (what is the term for this phenomenon? Maybe "intermolecular distances vs time" plot would be useful here?) Some more in-depth analysis + conclusions in the two last examples.
Transition state theory
The system considered here is a three atom reaction of the form:
A + BC → ABC‡ → AB + C.
The transition state as explained above, can be thought of as a bottleneck on the PES where the reactants have to be if products are to be formed, the theory implies that regions of products and reactants are separate entities. The assumptions of transition state theory are[1]:
- At fixed themperature, the reactants are in thermal equilibrium, or, at fixed energy, all reactant states are equally accessible.
- Motion along the reaction coordinate (minimum energy path) is seperable from motion orthogonal to it.
- Motion along the reaction coordinate is classical.
- Motion along the minimum energy path is direct.
The first point refers to the fact that starting materials must have energies that obey the Boltzmann distribution, the second one states that the Born-Oppenheimer approximation must be obeyed by each atom in the system, while the third one simply implies that quantum tunneling is no observed. Finally, the last point implies that all trajectories that cross the transition state dividing surface from the reactant side are assumed to go on and form products irreversibly.
However, transition state theory is based on assumptions that cannot be made in some cases. For instance in the 4th reaction tested above, the reactants have enough energy to overcome the activation barrier and get to the transition state, but this doesn't lead to the formation of products and thus goes against the 4th assumption. Tunnelling of small particles is observed as well, and the atoms that do tunnel would have much lower energies.
Mm10114 (talk) 18:35, 31 May 2018 (BST) Very good. So, in your opinion, how would the TST predictions compare to experimental values? You were supposed to comment on this as well.
Exercise 2: F-H-H
PES inspection
The reaction F + H2 ⇌ FH + H is an equilibrium reaction, with the forward reaction being exothermic (releases energy to the surroundings) while the reverse reaction is endothermic (absorbs energy from the surroundings). This is explained by the fact that the F-H bond is strong, with a bond energy[2] of 565 kJ/mol, compared to the H-H bond which has a bond energy of 432 kJ/mol.
Settings used : Atom A: F Atom B: H Atom C: H
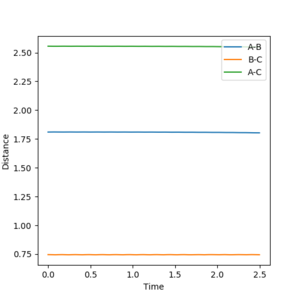
The approximate position of the transition state was found to be when: AB distance = 1.81 Å BC distance = 0.7456 Å Both momenta are set to 0 because here we look for the transition state. This is confirmed by plotting an internuclear distance vs time plot using the dynamics method, where no oscillations are observed meaning that the molecules are at rest which is characteristic of the transition state.
In order to find the activation energy, the calculation method is changed from dynamics to MEP and the AB bond distance is varied so that it is displaced from equilibrium at the transition state. By doing so, the molecule is forced to either go back to the reactants or go on to form the product. The Hammond postulate states that exothermic reactions have an early transition state and thus resembles more like the reactants than the products.
- The forward reaction F + H2 → FH + H is exothermic, so the transition state is observed early in the reaction and thus the AB bond length must be increased to find the activation energy.
AB distance is set to 1.91 Å and the number of steps is increased to 10 000.
Energy of the transition state = -103.344 Kcal/mol
Energy of the products = -103.622 Kcal/mol
Activation energy = energy of the transition state - energy of the reactants = 0.278 Kcal/mol
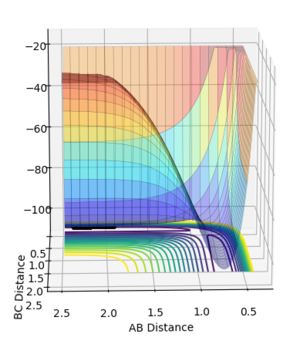
- The reverse reaction FH + H → F + H2 is endothermic, so the transition state is observed late in the reaction and thus the AB bond length should be decreased to find the activation energy.
AB distance is set to 1.71 Å and the number of steps is increased to 10 000.
Energy of the transition state = -103.618 Kcal/mol
Energy of the products = -131.485 Kcal/mol
Activation energy = energy of the transition state - energy of the reactants = 27.867 Kcal/mol
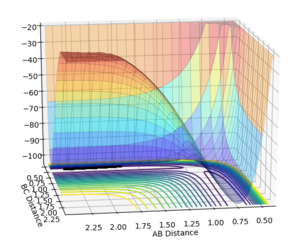
Mm10114 (talk) 19:03, 31 May 2018 (BST) Orientation of these plots is very awkward, making it very hard to see the trajectory path. Make sure to take it into consideration in the future, maybe a top view of the PES would be more clear? Also, are you sure the second plot is the right one? You report a change in energy between TS-reactants of 27 kcal/mol, but the difference between products/reactants and TS-reactants seems like much much less on these plots.
Reaction dynamics
Reactive trajectory
Let atom A= F atom B= H and atom C= H. Then if:
AB distance = 1.91 Å
BC distance = 0.7455 Å
AB momentum = -1.5
BC momentum = 1.0
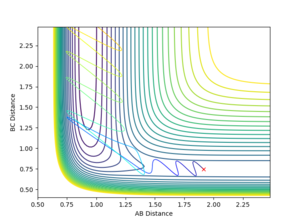

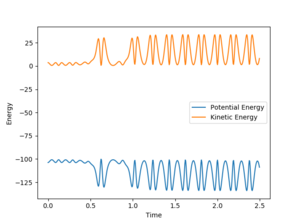
Looking at the momentum vs time plot, an increase in momentum results in a strongly oscillating molecule. The reaction considered here is the exothermic one, this would mean that energy released during this reaction is converted into vibrational energy, this is confirmed by looking at the energy vs time plot, after the collision the kinetic energy of the product molecule is strongly oscillating.
The effects of varying the momentum of AB
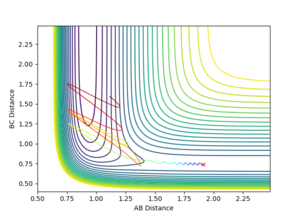
AB distance = 1.914 Å BC distance= 0.74 Å AB momentum= -3 to 3 BC momentum= -0.5
- In the case where pHH =-3 the molecules is strongly oscillating and leads to the formation of products.

- In the case where pHH =-0.5
- In the case where pHH =3
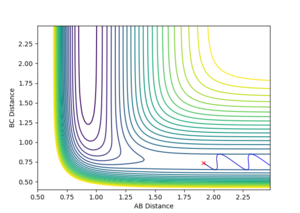
The momentum of FH corresponds to the vibrational energy when the atoms are bonded and corresponds to the translational energy when they are not. On figure 13 one can see that the translational energy of HH is converted to vibrational energy since the oscillation of the product is much larger than that of the reactants. Hence HH translational energy is converted to HF vibrational energy, because this is an exothermic process. This assumption could be confirmed by the use of IR spectroscopy because it is based on the vibrations of bonds. The greater the vibration of the bond, the higher the corresponding value of wavenumber.
A high and positive momentum as seen on figure 15 doesn't lead to the formation of products.
Polanyi's empirical rules
The different distribution of energy between different modes (translational and vibrational) have an impact on the type of transition state in a reaction. This was investigated by Polanyi who came up with a set of rules used to describe this relationship and was first illustrated using the same triatomic equilibrium system discussed here. The Polanyi rules state [3] that vibrational energy is more efficient in promoting a late barrier reaction (endothermic) than translational energy, and the reverse is true for early-barrier reaction (exothermic).
In the case studied here, the F + H2 → FH + H is exothermic and thus the rules would predict that a higher distribution of energy in the translational energy mode would promote the reaction. This matches the predictions made above when looking at the plots of momenta and energy against time.
For the reverse, endothermic reaction a high vibrational energy excited reactant molecule will encourage the reaction. So a high initial momentum of the starting material bond is favoured. Translational energy would cause the molecule to cross the transition state again resulting in no net reaction.
References
- ↑ M. Brouard, 1998, Reaction dynamics, "chapter 2 Potential energy surfaces" p13
- ↑ http://www.wiredchemist.com/chemistry/data/bond_energies_lengths.htm
- ↑ Polanyi, J. C. Concepts in Reaction Dynamics. Acc. Chem. Res. 1972, 5, 161−168.
