MRD:memes
Exercise 1: H + H2 System
Dynamics from the transition state region
On a potential energy surface diagram, how is the transition state mathematically defined? How can the transition state be identified, and how can it be distinguished from a local minimum of the potential energy surface?
The transition state is defined as the maximum on the path of minimum energy that links reactants and products, In three dimensions this can be observed as a saddle point. Mathematically they are defined by ∂V(ri)/∂ri=0 which tells us that the first partial derivative of two dimensions is 0. In addition, the second partial derivatives of the saddle point with respect to the orthogonal vectors (r1 and r2, see diagram) have opposite signs. The vectors r1 and r2 are orthogonal to each other with r1 defined as the tangent to the saddle back of the minimum energy path.


Perfect, what about details on a minimum and maximum, will the differential for a minimum/maximum be > 0 or < 0? Mys18 (talk) 18:19, 19 May 2019 (BST)

Report your best estimate of the transition state position (rts) and explain your reasoning illustrating it with a “Internuclear Distances vs Time” plot for a relevant trajectory.
Using parameters of AB Distance = BC Distance, to remove trajectories towards products or reactants, and AB and BC Momentum = 0 it is possible to adjust the internuclear distances of A,B and C to ensure that there are no local minima or maxima. This is the definition of a transition state and is shown in the Internuclear Distance - Time plot which is a flat line. Shown is a plot with internuclear distance of 0.9079 Å between A & B, and B & C.

Great methodology and well remembered units. Mys18 (talk) 18:45, 19 May 2019 (BST)
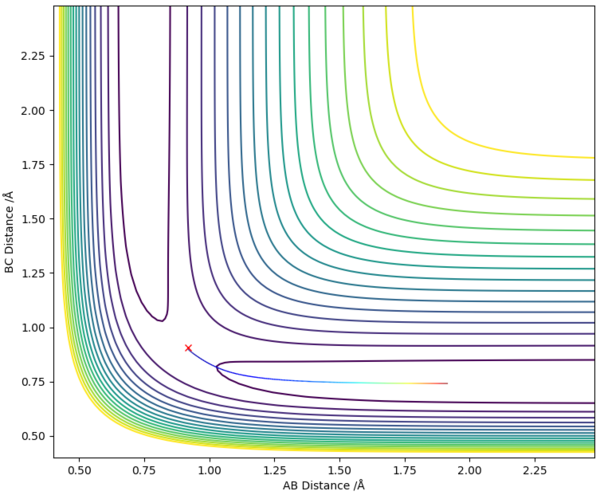
Comment on how the mep and the trajectory you just calculated differ.
The minimum energy path plot shows infinitely slow motion in which momentum and velocity is set to 0 at each point. This results in a plot with no oscillations compared to the dynamic calculations.
 |
 |
Perfect and so with these set to zero, MEP is ignoring the real motion of atoms in the reaction and we do not see the vibrations (straight line) Mys18 (talk) 18:48, 19 May 2019 (BST)
Reactive and unreactive trajectories
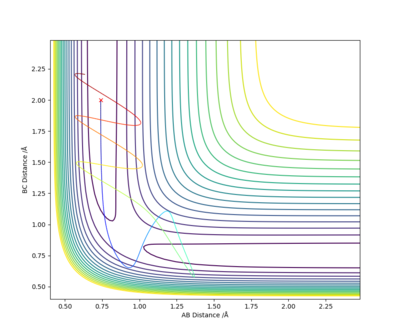
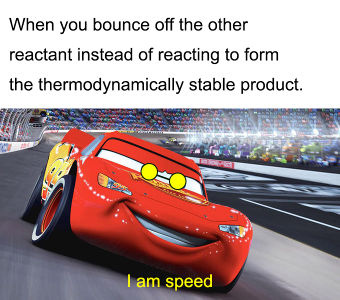
Excellent, quite rightly the diatomic IS speed. There is sufficient energy to overcome the energy barrier, but as my unedited meme attempts to quote Doc, we go the other way and recross the TS. What can you conclude from the entirety of your observations? Mys18 (talk) 18:59, 19 May 2019 (BST)

Complete the table above by adding the total energy, whether the trajectory is reactive or unreactive, and provide a plot of the trajectory and a small description for what happens along the trajectory. What can you conclude from the table?
State what are the main assumptions of Transition State Theory. Given the results you have obtained, how will Transition State Theory predictions for reaction rate values compare with experimental values?
The main assumptions of transition state theory state:
• Nuclear and electronic translations are independent of each other
• Reactant molecules and transition states (regardless of equilibrium between reactants and products) are distributed between energy states according to Maxwell-Boltzmann laws.
• Molecules which have crossed the transition state cannot reform into reactants again. They must proceed to products.
• In the transition state, translations can be treated classically as they are separate from other types of motion.
Due to the limitations of TST which treat any crossing of the transition state as going from reactants to products, the rate constant predicted by the theory will be higher than the experimental rate constants. Barrier recrossing is an observed phenomenon in real systems and TST does not take this into account.
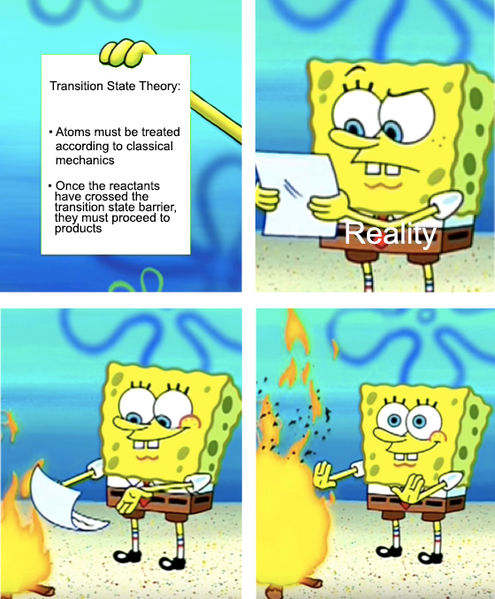
Excellent, good use of diagrams to support your answer. Mys18 (talk) 19:04, 19 May 2019 (BST)
EXERCISE 2: F - H - H system
PES inspection
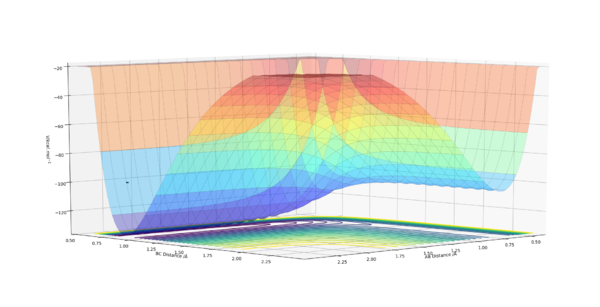
By inspecting the potential energy surfaces, classify the F + H2 and H + HF reactions according to their energetics (endothermic or exothermic). How does this relate to the bond strength of the chemical species involved?
 |
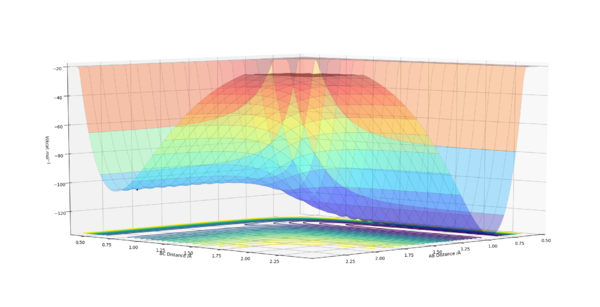 |
From the potential surfaces we see that the reaction between F and H2 is exothermic, with the products lying lower in energy than the reactants. This suggests that the HF bond is stronger than the H2 bond. In the second diagram we see that the reaction between H and HF is endothermic. This is represented by the increase in potential energy as we move from reactants to products. This is expected since the HF bond is stronger than the H2 bond.
Correct, might be worth showing the reaction so, H2 + HF gives... From your knowledge how else can you explain why the H-F bond is stronger? You could have a look at literature values for the energy for bond formation/breaking. Mys18 (talk) 19:07, 19 May 2019 (BST)
Locate the approximate position of the transition state.
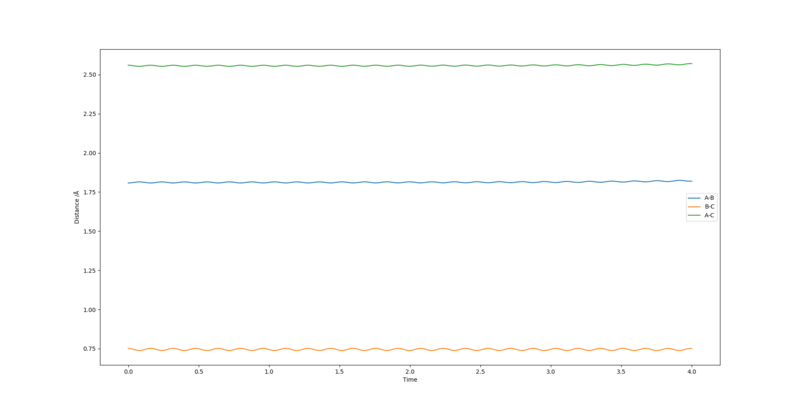
By inspecting the contour plot, approximate values of internuclear distances can be estimated of rAB of 1.8 Å and rBC of 0.75 Å. Through trial and error these can be further optimised to find a relatively good estimate for the transition state. This was obtained with values of 1.808 Å and 0.745 Å for rAB and rBC respectively.
Good. Mys18 (talk) 19:13, 19 May 2019 (BST)

Report the activation energy for both reactions.
 |
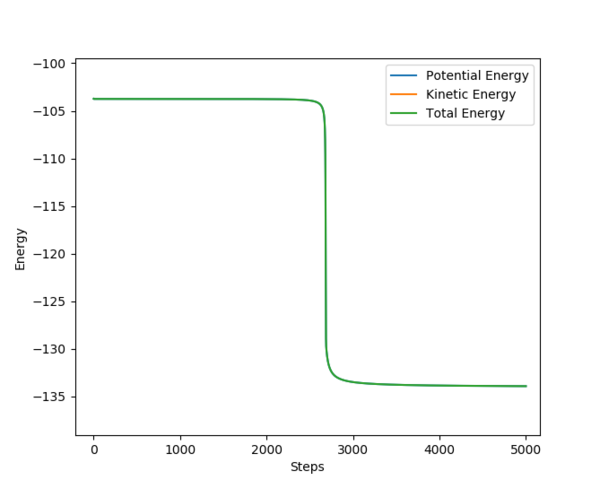 |
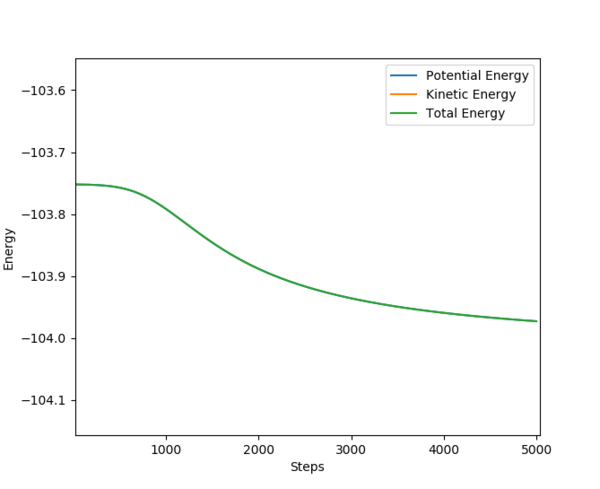
On the left is shown the activation energy for the reaction between F and H2. This has an activation energy of 0.25 kcal/mol. On the right, the activation energy for the reaction between H and HF is shown. From the graph it can be seen that the activation energy for this reaction is around 30.0 kcal/mol.
Again, good use of units, might be worth saying "approximately" opposed to "around". Mys18 (talk) 19:14, 19 May 2019 (BST)
Reaction dynamics
In light of the fact that energy is conserved, discuss the mechanism of release of the reaction energy. Explain how this could be confirmed experimentally.
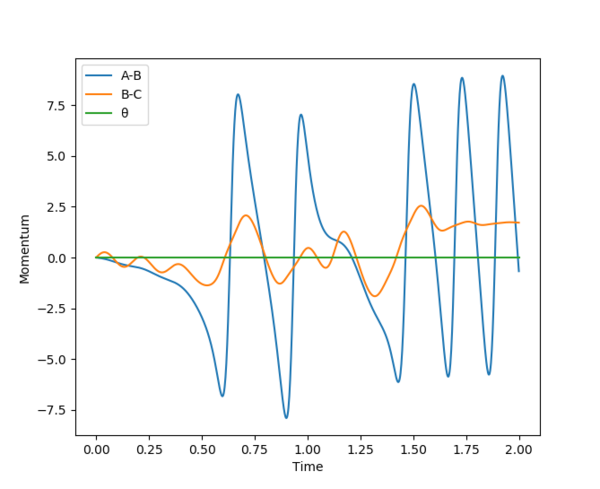
The chemical energy released from bond formation is converted into kinetic energy. This causes the H-F bond to vibrate which is shown by the oscillation shown by A-B. This often results in increase in temperature of the system. Experimentally this can be determined by the IR.
Yes, that is a robust technique that could be used! What values do you think would be observed for the frequency? Mys18 (talk) 19:18, 19 May 2019 (BST)
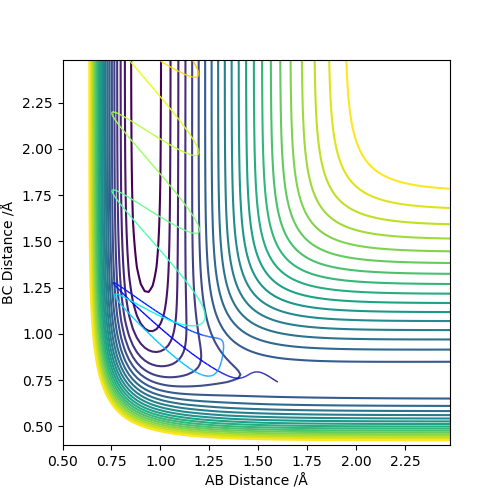
Discuss how the distribution of energy between different modes (translation and vibration) affect the efficiency of the reaction, and how this is influenced by the position of the transition state.
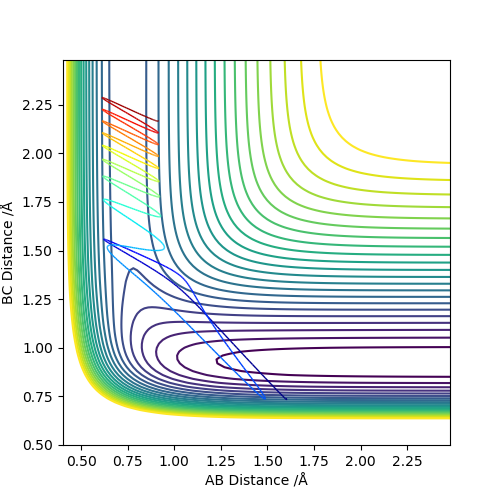
Polanyi's Empirical Rules state that early transition states are more efficiently activated by translational energy and late transition states are more efficiently activated by vibrational energy.
 |
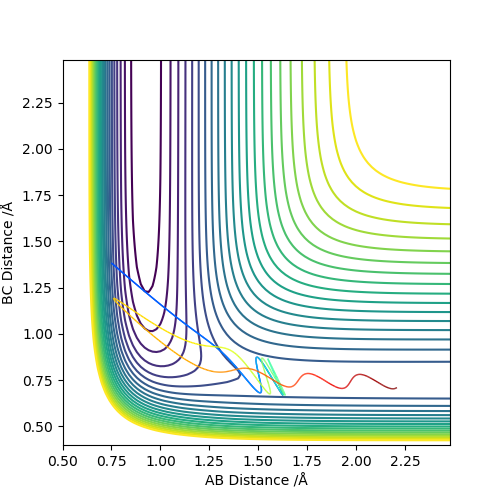 |
Comparing the reaction which proceeds via an early transition state (F and H2) we see that when the translational energy is high and vibration energy is low, the reaction proceeds to products through the transition state. However, when vibrational energy is high and translational energy is low, the reaction doesn't proceed to products and instead results in a barrier recrossing as shown by the graph. This is in accordance with Polanyi's Rules which state that early transition states are more efficiently activated by translational energy since the reaction only proceeds when this is high.
 |
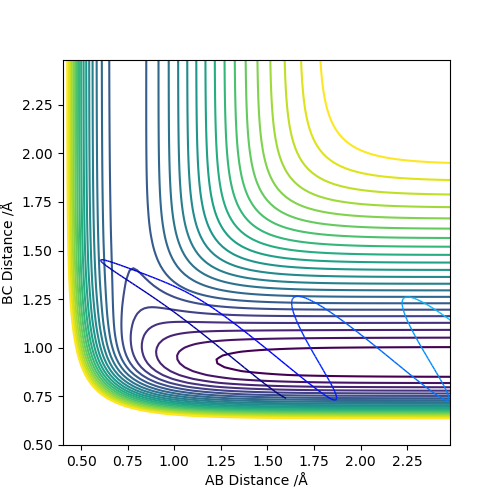 |
Comparing the reaction which proceeds via a late transition state (H and HF) we see that when the translational energy is high and vibration energy is low, the reaction does not proceed to products. However, when vibrational energy is high and translational energy is low, the reaction proceeds to products as predicted by Polanyi's Rules.
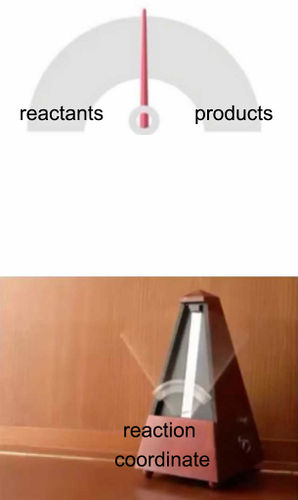
Excellent, nicely linked to your computational findings. Overall, your report has addressed all questions and you showed great understanding through your answers. Despite the meme's being humorous it did reiterate your understanding of the topic at hand. Fantastic job, it was a pleasure marking this :) Mys18 (talk) 19:22, 19 May 2019 (BST)


