MRD:me1218
Molecular Reaction Dynamics Lab 2020
OVERALL:4/5 - A good report overall, although you were missing some details in one or two places. One or two minor points are highlighted.
Exercise 1 - (H + H2 System)
The transition state on a potential energy surface plot is defined as the maxima of the minimum energy path where the gradient of the potential (derivative of potential over distances = ∂V(ri)/∂ri) is equal to zero. For a symmetrical system like H + H2, the transition state lies where rAB=rBC. Therefore, one way the transition state can be found is by generating a plot of internuclear distance against time for the reaction. The intersection between the lines of AB and BC distance over time gives the transition state with intermediate and equal bond lengths.
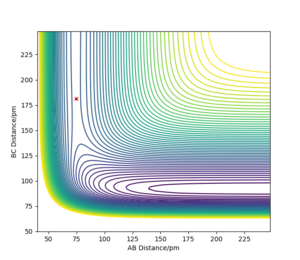
The transition state is a saddle point on the potential energy surface unlike any other local minima. It is a maximum of the minimum energy path of the reaction but the potential energy is at a minimum for the the dividing surface (plot orthogonal to the minimum energy path). This has been illustrated in figures 1, 2 and 3. Mathematically, using the second partial derivative test, the saddle point has a negative Hessian determinant.[1]
A sensible description of the TS, well done!
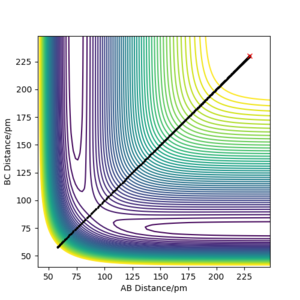
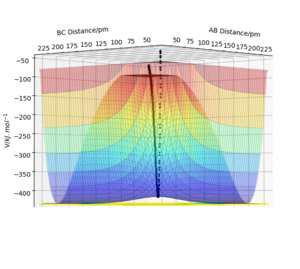
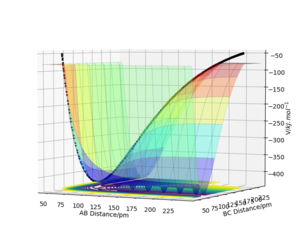
Table 1: Initial conditions tested in the software.
| Distance (r) [pm] | Momentum (p) [g.mol-1.pm.fs-1] | |
|---|---|---|
| AB | 230 | -5.2 |
| BC | 74 | 0 |
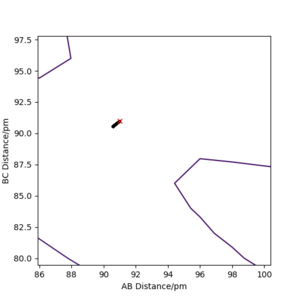
By initially using the intial conditions in table 1, a plot of internuclear distances against time was generated (figure 4). The intersection between the AB plot and BC plot (at the transition state bond lengths) was found to be at an internuclear distance value of around 91 pm (can be seen from zoomed figure 4 in figure 5).
A good estimate, although very slightly off from the true value. You can see some small residual vibrations in the plot.


The software was then set up using the conditions in table 2 to confirm whether the transition state was at around rAB=rBC=91 pm.
Table 2: Conditions for transition state in the software.
| Distance (r) [pm] | Momentum (p) [g.mol-1.pm.fs-1] | |
|---|---|---|
| AB | 91 | 0 |
| BC | 91 | 0 |
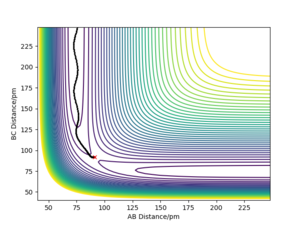
As shown from the contour plot generated from these conditions (figure 6), these conditions resulted in no overall trajectory towards products nor reactants. This is because there is no gradient directly at right angles to the transition state. There is only some oscillation of the system on the point as shown by the zoom of the contour plot of figure 6 in figure 7. Figure 8 is a plot of internuclear distance against time at this transition state. The oscillation in bond distances can be seen but there is no overall increase/ decrease in bond lengths between hydrogen's A, B and C. Looking at the initial geometry information in the control panel, the initial forces along AB and BC are around 0 kJ mol-1 (-0.037 kJ mol-1) showing that this is around the transition state.
The distance r at this transition state between A and B and between B and C can be called rts.

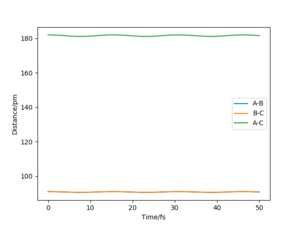
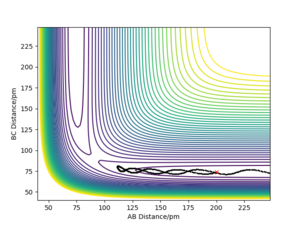
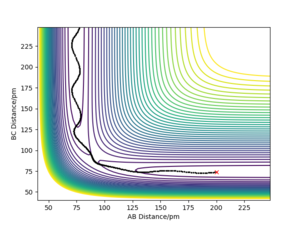
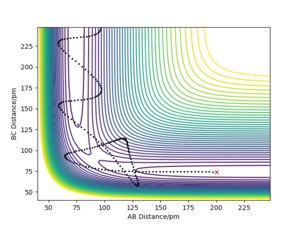
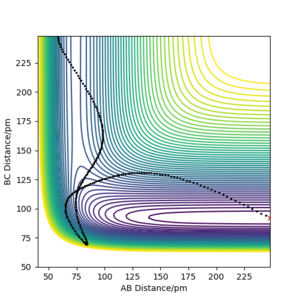
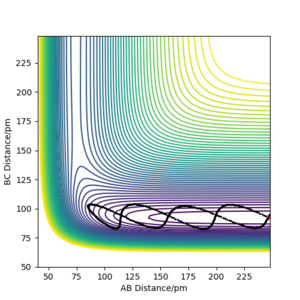
A minimum energy path (MEP) calculation was compared against a dynamics calculation (which, unlike an MEP, takes into account the vibrational motions of the system) using conditions where rAB = rts and rBC = (rts+1 pm). In the MEP calculation, the system follows exactly the trough (minimum points) of the potential energy surface with a direct trajectory down to the products - see figure 9.
In the dynamics calculation model, the system oscillates up and down the sides of the valley travelling towards the products - the trajectory is much less direct than in the MEP model - see figure 10.
The MEP is calculated assuming infinitely slow movement of the system on the potential energy surface (where momentum = 0 at each step calculated). Therefore, the only thing that determines the trajectory is the potential energy given by the potential energy surface and not any vibrational motion.
A sensible description, well done.
In figure 10, the vibrations (oscillations up and down the potential energy surface 'valleys') can be observed unlike in the MEP in figure 9. The MEP trajectory follows exactly the minimum points of the potential energy surface down from near the transition state to the products.
Table 3: Comparing dynamics of system given an initial position of rAB=200 pm and rBC=74 pm and the following values of p1 and p2.
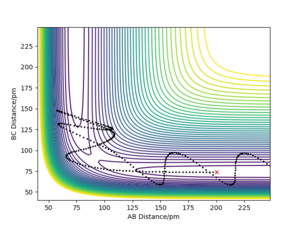
From table 3, it can be said that it is not, in fact, the Etot nor the combined magnitude of the initial momenta that determines if the reaction will proceed or not but rather whether the energy supplied is in the correct 'mode' for reaction to proceed. For example (4), even with total energy (Etot) of -357.277 kJ mol-1 (quite high relative to others in the table) and an initial momenta of AB roughly double that of example (3), the reaction does not proceed. Here barrier recrossing can be observed. This is when the system crosses the transition state region again - the bonds in the product form but the system doesn't go fully to product before returning back to the reactants (via the transition state again).
In 'Transition State Theory', one assumption made is that when kinetic energy is greater than the activation energy (and the transition state is reached), the system always goes on to form products. Once the transition state has been reached, the system cannot go back to form reactants. There are, however, exceptions to this assumption as shown in example (4) in table 3. There is 'barrier recrossing' whereby the transition state is reached (and in this example surpassed - going on to form product bonds) but the system ultimately returns to the reactants instead of forming products.
In terms of the rate of reaction, 'Transition State Theory' will overestimate the rate of reaction. This is because, hypothetically, if 1 out of 10 possible trajectories proceeds as in example (4) in table 3 and undergoes 'barrier recrossing', there would be 1 out of 10 trajectories which don't proceed to products as predicted by 'Transition State Theory'. This means the rate measured experimentally is always equal to or less than the rate which can be predicted using this theory.[2]
A good description of the limitations of TST. What other features does TST neglect though?
Exercise 2 - (F + H + H System)
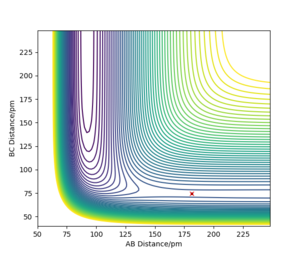
The transition state point was found by looking for a 'saddle-point' in the surface plot of the system. The value for rBC was set in the centre of the minimum potential energy surface in the reactants. Then, with values of momenta set equal to 0, the value of rAB was varied between 135 pm and 200 pm. Values of rAB below the transition state value result in an overall trajectory towards the products whilst values about the transition state result in an overall trajectory back to the reactants. By varying rAB and observing the overall trajectory, the transition state was found. This location was confirmed by taking note of the forces values in the initial geometry information panel at this transition state. These values were around 0 kJ mol-1 pm-1 along both AB and BC.
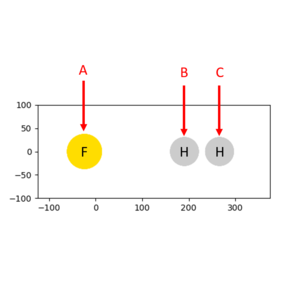
For the reaction of F with H2, the transition state is located at around the following: rAB = 181.15 pm, rBC = 74.5 pm.
This transition state is closer to the reactants side of the potential energy surface and so the transition state can be said (by Hammond's postulate) to be 'reactant like'. Therefore, the transition state is early and the reaction is exothermic.
By subracting the potential energy of the reactants (found at the minimum potential energy at the extreme of rAB bond length) from that of the transition state found, the activation energy of the F + H2 reaction was found to be 696 J mol-1
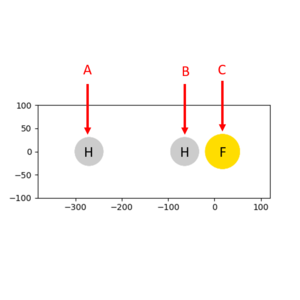
For the reaction of H with HF, the transition state is located at around the following: rAB = 74.5 pm, rBC = 181.15 pm.
This transition state is closer to the products side of the potential energy surface and so the transition state can be said (by Hammond's postule) to be 'product like'. Therefore, the transition state is late and the reaction is endothermic.
From the initial potential energies of the transition state and the reactants, the activation energy of the H + HF reaction was found to be 126.327 KJ mol-1 (126,327 J mol-1).
Sensible estimates for the activation energies of both reactions. I'd say your F+H2 barrier is slightly too small, but given the size of the barrier, this is expected.
The activation energy for the reaction of H + HF is much higher than that of the reaction of F and H2.
Since the F + H2 reaction is exothermic, there is more energy released to form the H-F bond than energy required to break the H-H bond. Also, as the H + HF reaction is endothermic, there is more energy required to break the HF bond than energy given back upon formation of the H-H bond. Therefore, it can be deduced that the H-F bond is stronger than the H-H bond.
An reactive trajectory of the F + H2 system was set up using the conditions in table 4.
Table 4: Conditions used for reactive F + H2 trajectory.
| Distance (r) [pm] | Momentum (p) [g.mol-1.pm.fs-1] | |
|---|---|---|
| AB | 225 | -2.0 |
| BC | 74.5 | -0.5 |
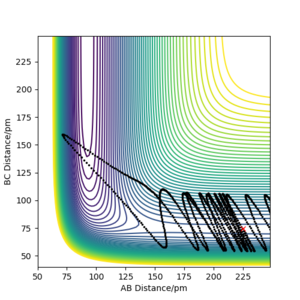
A contour diagram of this reactive trajectory is shown in figure 24.

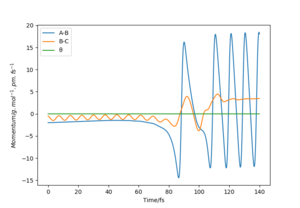
From these plots using the reactive trajectory conditions, the mechanism of release of energy can be illustrated.
From the contour plot in figure 24, it can be seen that the reactants start off with little vibrational energy. After surmounting the transition state, the products have much more vibrational energy (shown by the oscillations). Also, in the momentum against time plot for this process (figure 25), the oscillations (vibrational energy) in A-B and B-C are small before around 75 s (in the reactants) whereas in the products, the blue line (for A-B momentum) is high - the products have more vibrational energy. Therefore, in this example, the mechanism of release of energy is mostly via vibrational energy. A reactive trajectory for the reverse process (H + HF reaction) would have mostly translational energy released.
The mechanism for release of a particular reaction can be measured experimentally. This can be done by using calorimetry and IR spectroscopy (to measure vibrational activity) in tandem.
Taking the F+ H2 reaction as an example, calorimetry will allow for the total energy released during the reaction to be measured. In the reactants, vibrational modes of H2 molecule (being symmetrical and hence non-polar) are not IR active whereas those of the HF molecule formed in the products (being asymmetric and polar) are IR active. Therefore, the wavenumbers of the peaks in the IR spectrum of the products can be used to resolve the vibrational energy component to the total energy released in the reaction.
How though? What features would you expect to see? More detail in your explanation is needed...
Table 5: Plots, conditions and descriptions to illustrate Polanyi's rules using the F + H2 and the H + HF systems.
Most of your examples are good, but I'd say that one or two dont illustrate what you hope they do. For example, your demonstration of vibrational energy overcoming the barrier for the H+HF reaction also has a huge amount of translational energy.
Using these plots in table 5, Polanyi's empirical rules can be illustrated.
Total energy of the system is conserved in the process of moving from reactants to products. The distribution of this energy in different modes (vibrational and translational), however, can change.
In terms of Polanyi's rules, the table 5 shows that, depending on the position of the transition state, the distribution of supplied energy in different modes affects whether the reaction will proceed or not. It shows that, for an exothermic reaction (with an early transition state) it is more efficient (in terms of reactants proceeding to products) to start with little vibrational energy and high translational energy in the reactants. For an endothermic reaction (with a late transition state), it is more efficient to start with high vibrational energy in the reactants so that the 'longer transition state bond length can be achieved'. It also shows that for an exothermic reaction, high translational energy in the reactants is converted to high vibrational energy in the products. Again, for an endothermic reaction, the converse is true.
This rule can be demonstrated in real life observations - an early transition state gives greater vibrational energy out in the products - this increase is observed as a temperature increase upon formation of products. Hence exothermic reactions 'give out heat'.[3]
References
- ↑ Khan Academy. Second Partial Derivative Test. https://www.khanacademy.org/math/multivariable-calculus/applications-of-multivariable-derivatives/optimizing-multivariable-functions/a/second-partial-derivative-test (accessed: May 15, 2020).
- ↑ Steinfield, J. I.; Francisco, J. S.; Hase, W. L. Statistical approach to reaction dynamics transition state theory. In Chemical Kinetics and Dynamics. 2nd Ed.; Upper Saddle River: Prentice-Hall, 1989; pp. 287-321.
- ↑ Polanyi, J. C. Some Concepts in Reaction Dyanmics. Science. [Online] 1987 https://science.sciencemag.org/content/236/4802/680/tab-pdf (accessed: May 15, 2020).


