MRD:mco218
Molecular Reaction Dynamics 2020
Exercise 1: H + H2→H2 + H
How a Transition State is identified
A Potential Energy Surface (PES) describes the potential energy of the system when molecular species react depending on the distance between the reacting species, r. The Transition State (TS) is mathematically defined as the saddle point on the PES where the second derivative of potential energy with respect to r is zero. It is located at the maximum along the reaction trajectory which is the minimum energy path (MEP) taken by the reactants. At the TS the derivative of the energy path is equal to zero, ∂V(ri)/∂ri=0. The TS can be identified by a configuration such that its trajectory proceeds to react to form products1.
Most trajectories on PESs don't travel directly over the saddle point meaning they must acquire a total energy higher than the TS energy. Hence, the experimentally calculated activation energy is often higher than the actual saddle point energy. The TS can be distinguished from the local minimum in the MEP by examining the second derivatives of both peaks. The TS is at the local maximum meaning its second derivative must be less than zero whereas the local minimum has a second derivative above zero.
Good on your description for distinguishing between the TS and the local minimum but these are partial derivatives. The rest of your description is a little confusing, you mentioned that the second and first derivative is equal to zero at the TS but it's the partial derivative that is equal to zero at TS. I noticed that your references are not linked properly, information on how to do this is on your lab script. Sf3014 (talk) 14:17, 24 May 2020 (BST)
Reporting a best estimate of rts
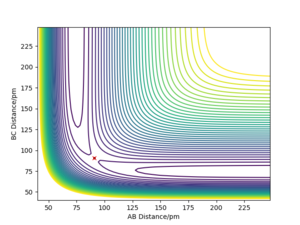
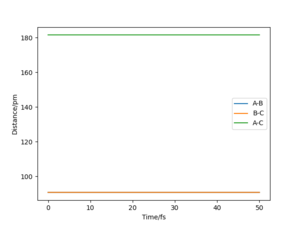
By examining the instance of the TS of a reaction between H and H2, the bond distances between each of the three molecules can be considered equal as the H atom approaches collinearly. The reason its line of attack is collinear is that the potential energy barrier is lowest at this trajectory and the overall reaction rate is higher than at any other angles. The bond distance between HA and HB & HB and HC at the TS can be labelled rts. As mentioned above, the TS occurs at the maximum of the minimum energy path, shown in Fig. 1 as a red cross when rts is 90.775 pm.
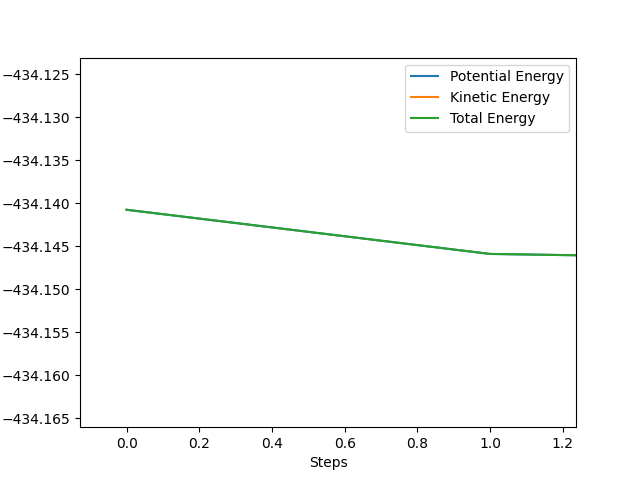
In this simulation, at rts is 90.775 pm, zero force, 0 kJ mol-1.pm-1, is acting on the system, meaning the reaction will remain in the TS configuration and will not proceed to the products or fall back towards the reactants. The red cross indicates the maximum in potential energy of which the reactants must obtain to transform into products. The internuclear distances vs time graph illustrate the motion of each reactive species in Fig. 2 during the TS. The B-C and A-C distances display a horizontal, constant behaviour meaning the bond distances remain the same throughout the TS.
Very good description and use of simulated results Sf3014 (talk) 14:22, 24 May 2020 (BST)
Trajectories of r1=rts+δ , r2=rts
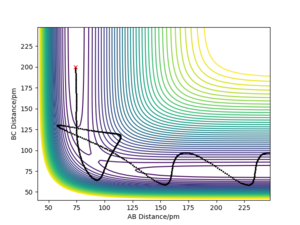
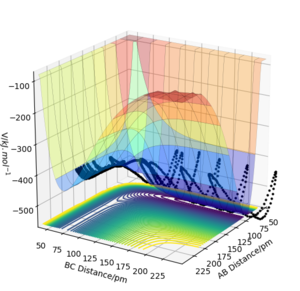
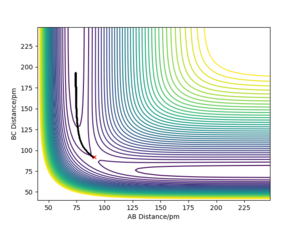
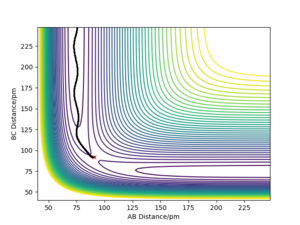
Whilst looking at the trajectory of the reactants when r1 is slightly longer than r2, the reactants can turn into the products H2 + H. The trajectory follows the PES product channel as indicated by a black line in Fig. 3 and Fig. 4. Using a MEP simulation, the trajectory is a smooth line displaying the path taken by the reactants which requires the lowest potential energy. In a Dynamics simulation, there is a non-linear line with sinusoidal behaviour indicating that the products are in a vibrationally excited state, by demonstrating the actual trajectory taken by the reactants.
Very good, but what can you conclude from this? Whilst stating only your observations your discussion is left incomplete. Sf3014 (talk) 14:26, 24 May 2020 (BST)
Reactive and Un-reactive Trajectories Table
Reaction 1
HAHB + HC → HA + HBHC
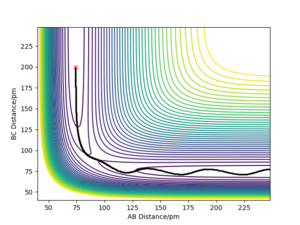
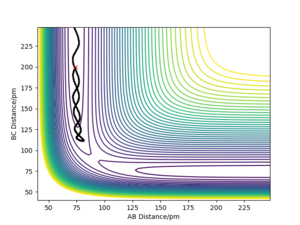
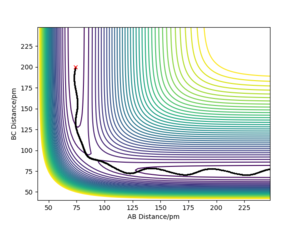
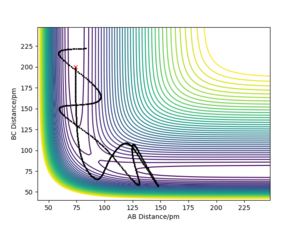
In the trajectories below, AB distance refers to the distance between HA and HB and BC distance refers to the distance between HB and HC. The initial positions were AB = 74 pm and BC = 200 pm.
Good table layout and descriptions but what do p1 and p2 refer to with regards to distances AB and BC? Sf3014 (talk) 14:37, 24 May 2020 (BST)
Table 1. Exploring different cases where the momenta of the reactant species in reaction 1 are altered.
Conclusions from Table 1.
By analysing the different scenarios from the above table, I can conclude that the distribution of energy in the reacting species needs to be at a certain configuration for the reaction to happen. In situtation 2, the reactants are vibrationally excited however there is insufficient translational kinetic energy available for the reaction to form products. In situation 4, the colliding atom has excess translational energy however the HAHC lacks vibrational energy to react. In situation 5, the total energy of the system is more than 10 kJ mol-1 higher than in situation 4. This provides the additional energy needed to overcome the higher potential barrier by not proceeding through the saddle point.
Good but hard to follow because p1 and p2 has not been defined according to the AB and BC distances Sf3014 (talk) 14:41, 24 May 2020 (BST)
How Transition State Theory (TST) predictions compare with experimental values
TST states many assumptions when examining PESs. TST assumes that once the reactant trajectory passes over the TS the trajectory cannot go back to the reactants but instead form the products. This assumption is contradicted in many chemical reactions as shown in Fig. 8. The trajectory overcomes the potential energy barrier but fails to create products and rebounds towards its initial starting point. Another assumption is that all collisions with a kinetic energy higher than the activation energy will result in a reaction. However, even when high amounts of translational energy is given to a system, the reactants fail to make products as seen in Fig. 8. This eludes to the conclusion that the distribution of energy in a system between modes other than translational, such as vibrational, determines whether the reaction will go to completion. TST is a classical theory where quantum effects such as quantum tunnelling are not involved.
By experimenting with different reactive and un-reactive reactions, it is clear that many trajectories on PESs don't travel directly over a saddle point but instead partially climb the walls of the potential well. In order for the reaction to go to completion, the reactants in these situations must acquire a total energy significantly higher than the saddle point energy. As a result of this, the experimentally determined activation energy for reactions are commonly higher than the TST energy barrier predictions. In reality, with a higher energy barrier this would suggest that the rate of reaction is higher in TST rate predictions than in experimental values.
Good but what evidence shows the reaction trajectories climbing the potential well walls before goin over the saddle point? This is not clear to the reader Sf3014 (talk) 14:49, 24 May 2020 (BST)
Exercise 2: F-H-H System
Energetics of F + H2 and H + HF and bond strengths
Reaction 2.1
F + HAHB → FHA + HB
Reaction 2.2
HA + HBF → HAHB + F
| Reaction | Initial distances / pm | Momenta / g.mol-1.pm.fs-1 | Total Energy / kJ mol-1 | Transition State Position | Forces at TS / kJ mol-1 | Activation Energy kJ mol-1 | |
|---|---|---|---|---|---|---|---|
| 2.1) | F + HAHB | F - HA = 200
HA - HB = 74 |
AB = -2.5
BC = -5.1 |
-417.591 | F - HA = ~98 pm
HA - HB = ~104 pm |
along AB = -1.197
along BC = +1.140 Net Force = -0.057 AB |
0.006 (Exothermic) |
| 2.2) | HA + HBF | HA - HB = 200
HB - F = 92 |
AB = -23.0
BC = -10.0 |
-207.717 | HA - HB = ~103 pm
HB - F = ~98 pm |
along AB = +1.197
along BC = -1.133 Net Force = +0.064 AB |
1.171 (Endothermic) |
Table 2. The total energy of each reacting system.
Reaction 2.1 is lower in energy, -417.591 kJ mol-1, than reaction 2.2 at -207.717 kJ mol-1. This suggests that reaction 2.1 is a more energetically favourable reaction. Reaction 2.2 is higher in energy and unstable requiring energy from the surroundings to react as demonstrated by the larger activation energy in table 2. This implies that the new H-F bond formed is stronger than the H-H bond and more energetically favourable. As reaction 2.2 is more endothermic, it requires energy from its surroundings to form the H-H bond again meaning it is a weaker, less stable bond than H-F. As shown in Fig. 10 and 11, the energy difference between the reactants and TS can be calculated to find the activation energy values in table 2. There is a greater difference in energy in Fig. 11, this suggests that the reaction doesn't occur spontaneously which is the opposite for reaction 2.1.
Good work on stating which direction is endo- and exo-thermic but you can support this further using your potential energy surface plot. The rest of your description is unclear, how did you calculate your activation energy (Ea) and how did you locate your transition state (TS)? Your numbers for Ea seen quite low and fig. 11. does not show the full energy difference between TS and the reactants. Sf3014 (talk) 15:03, 24 May 2020 (BST)
Fig. 10 Activation energy required to form F-H + H in reaction 2.1.
Fig. 11 Activation energy required to create H2 + F in reaction 2.2.
Reaction Dynamics
Mechanism for release of reaction energy
Photoelectron spectroscopy can be used to determine the energy of the TS2 and different stages of the reactants and products. Transition State Spectroscopy by photodetachment of a negative ion is used to determine these energies to plot PESs. In the spectrum, the number of peaks represent the various vibrational excitations that are occurring in the negative ion, in this case HFH-. The more peaks there are, the more vibrationally excited states in the system. By finding the energy of the TS, the exothermic or endothermic nature of a reaction can be determined.
Very Good but discussion about how energy is conserved is missing Sf3014 (talk) 15:16, 24 May 2020 (BST)
F + H2 Reaction
Table 3. Contour and Surface plots of reaction 2.1 with various initial momenta settings whilst initial internuclear distances remain constant.
As shown in the table 3, varying amounts of energy are given to reaction 2.1 by altering the initial momenta. The energy provided exceeds the activation energy yet not all of the reactions in Fig. 12 - 15 are reactive. In Fig. 12, the reactants trajectory travels through the reactants channel whilst oscillating up and down the sides of the potential wall. The reactants overcome the energy barrier but rebound back towards the reactants channel, meaning the reactants don't have sufficient energy distribution in both translational and vibrational modes. This is similar to the trajectory in Fig. 15. Both trajectories in Fig. 13 and 14 showcase successfully reactive reactions. The reactants travel through the transition state towards the products. The reactants appear to obtain a significant amount of vibrational energy suggesting the H2 molecule is in a vibrationally excited state.
By examining Polanyi's Rules3, since reaction 2.1 is more exothermic, it has an earlier TS. This leads to an earlier energy barrier in the entrance channel of the potential well, nearer the reactants. To overcome this barrier, the reaction is more effective if the reactants have a higher amount of translational energy than vibrational. If there is more vibrational energy in the reactants, the trajectory can travel up the sides of the repulsive potential well and lose energy in the process meaning they cannot travel over the potential energy barrier at the TS. In Fig. 14, the reactants may have some vibrational energy but have a significant amount of translational energy due to the higher initial momentum of the incoming atom. Whereas in Fig. 15 the reactants have lower translational energy and cannot reach the products, hence it is unreactive.
Good but hard to follow because p1 and p2 are not defined Sf3014 (talk) 15:09, 24 May 2020 (BST)
F-H + H Reaction
Reaction 2.2 is more endothermic when compared to reaction 2.1 as the H-F is broken in the process which is a stronger bond. In Fig. 18, the reactants are given a high translational kinetic energy as demonstrated by the relatively linear trajectory in the reactants channel. The reaction in Fig. 18 is reactive as it overcomes the energy barrier towards the products. However, the reaction in Fig. 19 is un-reactive and the reactant trajectory rebounds once it reaches the TS energy barrier. In this trajectory, the reactants have more vibrational energy than in Fig. 18 whilst the reactants in Fig. 18 have more translational motion.
Fig. 18 A successful reaction trajectory of reaction 2.2.
Fig. 19 An un-reactive trajectory of reaction 2.2.
By appreciating Polanyi's Rules2, the reason behind the reactivity of the trajectories in Fig. 18 and 19 can be solved. The endothermic reaction 2.2 means it has an later TS which resembles the structure of the products, by Hammond's Postulate. When a reaction has a late TS, the potential energy barrier is located in the exit channel. Reactants which have more vibrational energy are able to overcome the later TS barrier, Fig. 18. Whereas reactants with high translational energy collide against the repulsive potential energy walls before even reaching the energy barrier, Fig. 19, hence loose energy in the process and the reaction is deemed un-reactive.
Bibliography
1 P. Atkins, J. De Paula, Atkin's Physical Chemistry, OUP Oxford, UK, 2014, Focus 18
2 D. M. Neumark, Acc. Chem. Res., 1993, 26, 2, p 33-40
3 J. Steinfield, Chemical Kinetics and Dynamics, Prentice Hall, Michigan, 2, 1999, p 272-274

