MRD:mc4717
Molecular Reaction Dynamics Computational Lab
H + H2 system
Dynamics from the transition state region
The transition state is defined as "the maximum on the minimum energy path linking reactants and products." Therefore, the transition state can be found as a stationary point on the potential energy surface graph and the derivative of the potential energy is zero with respect to the Cartesian coordinates. However, on the potential energy surface a local minimum point has the same value as therefore, the second derivative is calculated to differentiate the transition state from local minima.
Good, how do you think the saddle point would fit into your definition? After evaluating the second derivative, do you think this will give you values that are zero, negative or positive? Mys18 (talk) 23:00, 19 May 2019 (BST)
Trajectories from r1 = r2: locating the transition state (rts)
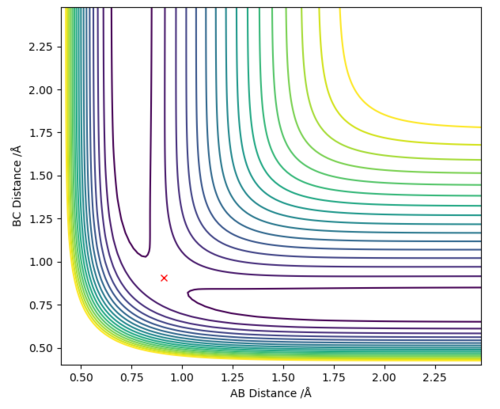
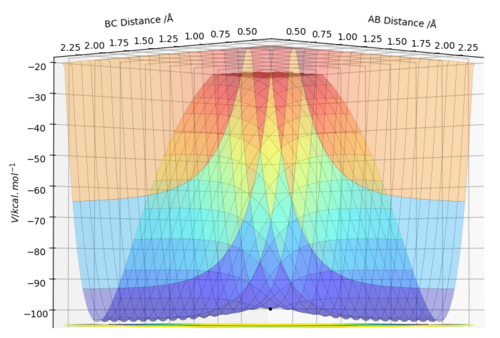
After observing the potential energy surface, the transition state was estimated to be approximately at 0.9 Å. The values for the energy against time plot were exported, in order to evaluate which value lies between the minima and the maxima. The transition point was therefore, estimated to lie between the values 0.9-9.1 Å. In order to acquire values corresponding to the transition state (KE = 0) the distances were made more accurate by increasing the decimal points of 9.0 Å until the value rts=0.9077424 was acquired.
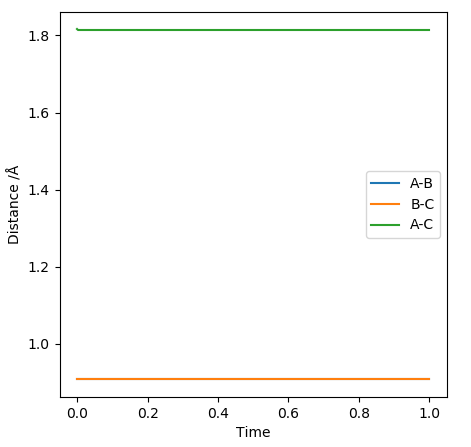
At rts=0.9077424 Å the line in the internuclear distance against time plot is horizontal which, means that the molecules are at the transition state and vibrating symmetrically. Furthermore, when rBC=rAC=0.9077424 Å and pBC=pAC=0, the forces along AB and BC and the kinetic energy are 0. As there is no initial momentum on the transition state the values confirm that HA and HBC are stationary and the transition state is confirmed.
Good explanation and well remembered units. So using your answer and your graph what can you comment on the internuclear distances? Mys18 (talk) 23:13, 19 May 2019 (BST)
Calculating the reaction path: MEP and Dynamics
After having located the transition state position the minimum energy reaction (MEP) path trajectory can be calculated.
The minimum energy path is the path form reactants to products with the lowest energy and it was determined by using the initial conditions to find the transition state position, except that the internuclear distance of HA and HB was increased to 0.9177424 Å. The reaction path was obtained using the calculation types Dynamics and MEP and analysed.
Surface Plot
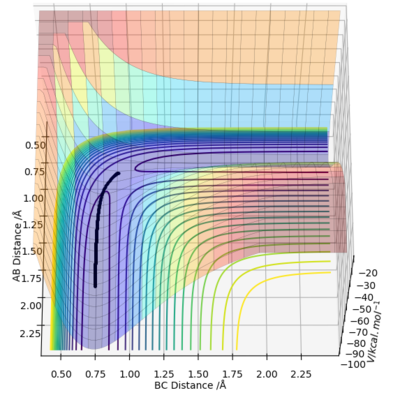
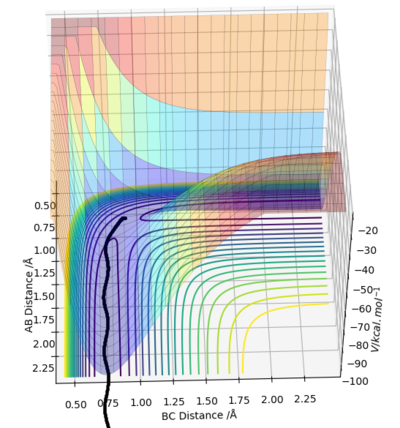
The reaction path can be detected on the surface plot as the black line. Based on the MEP calculation method, the trajectory as shown on the graph follows a relatively straight line, indicating that the atoms are not vibrating (KE=0). As the momenta are set to zero after each step in the minimum energy path, the reactants are converted into products infinitely slowly.
However, based on the dynamic calculation method, the trajectory as shown on the graph follows a wavy line, indicating that the atoms are oscillating (KE≠0). This is because at regions of high potential the reactants convert to products.
As the mass and inertia of the atoms are neglected in the MEP calculation model, it does not represent a realistic model of the atom motion in the reaction progress.
Nice to see you have yet again given explanations to show how you arrived at your answer. Precisely there is no conservation of energy using the MEP method and so we observe the straight line. Mys18 (talk) 23:26, 19 May 2019 (BST)
Internuclear Distance against Time Plot
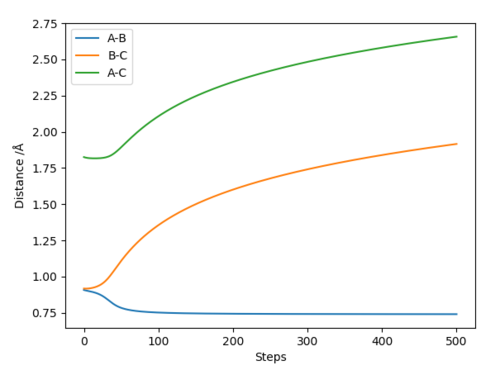
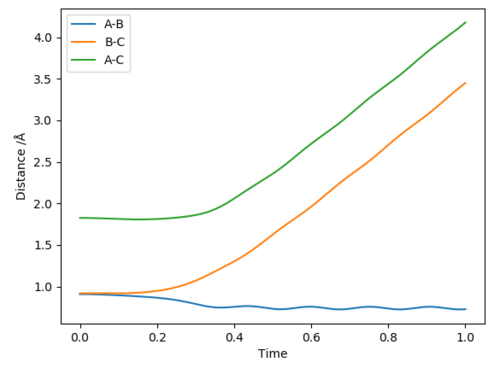
In the MEP graph, the distance between HA and HB decreases during the first 50 steps and it plateaus to a value of ca. 0.75 Å (hydrogen bond length). This means signifies a bond formation HA-HB. The distance between HB and HC increases at large step values which signifies that that HC is removed after HA and HBC collide successfully.
In the dynamic graph, the distance between HA and HB decreases, which signifies the hydrogen bond formation between HA and HB, whereas the distance between HB and HC increases.
A difference between the figures is the internuclear distance between HA and HB. Whereas in the MEP the distance is constant because the bond is static in the dynamic the internuclear distance is oscillating, because the bond is vibrating.[1]
Reactive and unreactive trajectories
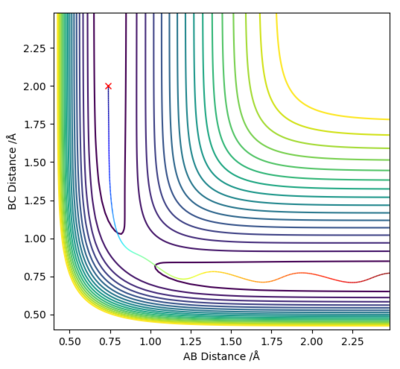
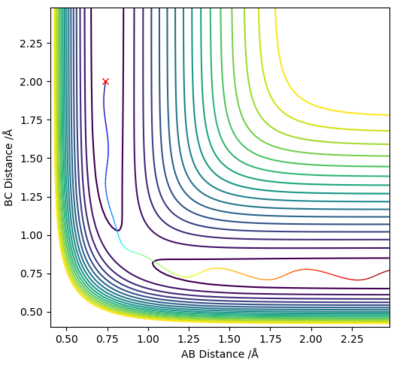
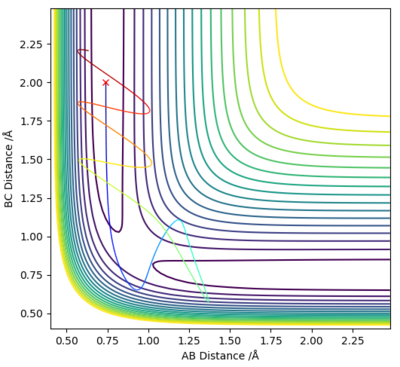
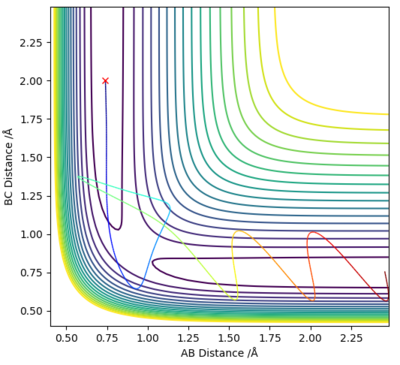
The initial conditions were r1 = 0.74 Å and r2 = 2.0 Å, with p1 and p2 varied as shown in the table below.
As demonstrated in the above table, a successful reaction does not depend solely on the KE being larger than the Ea. In example 4, although the KE was sufficient the reaction was unsuccessful, whereas in examples 1 and 3 a reaction occurred despite the lower energy systems.
Well done, perfectly answered and your observations are spot on. Mys18 (talk) 23:48, 19 May 2019 (BST)
Transition State Theory [2]
Transition state theory is a theory that provides the reaction rate and rate constant in elementary chemical reactions. This model involves a chemical equilibrium (quasi-equilibrium) between the reactants and the activated transition state complex and the TS, reactants and product interactions.
1. The Maxwell-Boltzmann distribution governs the distribution of reactant molecules in their respective states.
2. As the Born-Oppenheimer approximation postulates electronic and nuclear motions are separated.
3. The activated transition state complex and the reactants are in equilibrium.
4. Once reactants cross the transition state the products form and reactants cannot be reformed.
5. Particles are treated classically (quantum phenomena are not expected).
The assumptions stated do not conform with reality and limitations arise in the transition state theory.
Firstly, assumption 4 states that once the reactants cross the activation energy barrier the products will form. However, as seen in example 4 in the table above the system reformed the reactants although the KE was sufficient to form the products and the transition state was crossed; this is called barrier recrossing. Therefore, the rate values expected are greater than the obtained experimental ones.
Secondly, assumption 5 neglects the implication of quantum phenomena. For lighter atom and lower activation energy systems quantum effects are considerable. When the activation energy barrier of a system is low and the KE of the reactant is insufficient to cross the TS barrier tunnelling can occur leading to product formation. The transition state theory neglects such phenomena and the rate values expected are lower than the obtained experimental ones.
Correct, nicely linked back to the previous question! Mys18 (talk) 23:52, 19 May 2019 (BST)
F-H-H system
PES inspection
F + H2 → HF + H
.
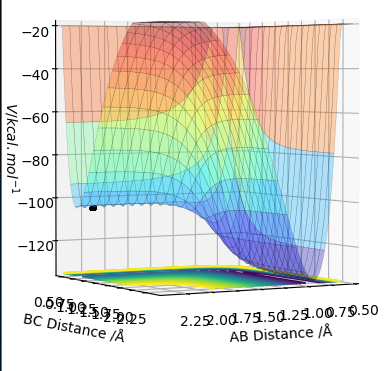
The reaction between F and H2 is exothermic. The reaction involves the breaking of a H2 bond and the formation of a HF bond. The H-H bond is 436 kJ/mol [6], hence weaker than the H-F bond of 565 kJ/mol. This is due to the higher EN of the F which results in a higher polar covalent bond forming. As the bond that is formed is stronger than the bond being broken the reaction is overall exothermic and the reactants are higher energetically than the products. As seen IN Fig. 8 the reactants have a greater potential energy than the products.[1]
H + H-F → H2 + F
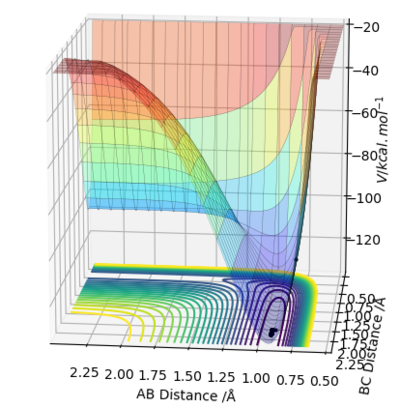
The reaction between HF and H is endothermic. The reaction involves the breaking of a HF bond and the formation of a H2 bond. The H-F bond is 565 kJ/mol [6], hence stronger than the H-H bond of 436 kJ/mol. This is due to the homonuclear bond formed which is not polar covalent. As the bond that is formed is weaker than the bond being broken the reaction is overall endothermic and the reactants are lower energetically than the products. As seen in Fig. 8 the reactants have a lower potential energy than the products.
Locating the TS
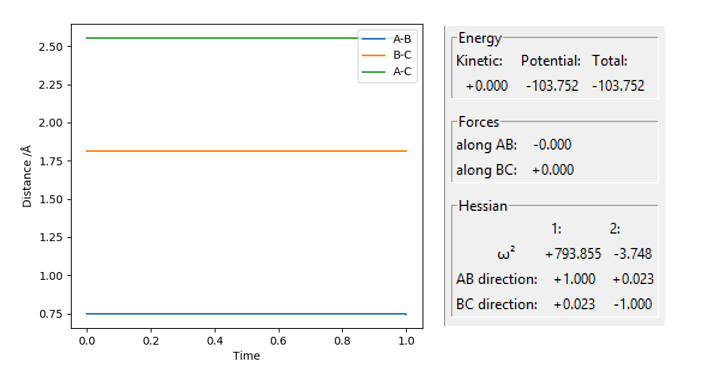
According to Hammond’s Postulate the TS in a reaction resembles either the reactants or products depending on where it energetically is: an early transition state is energetically closer to the reactants, whereas a late TS is energetically closer products. Early transition states are characteristic of exothermic reactions such as the H2 + F -> HF + H reaction. Therefore, the TS must resemble the reactants, specifically H2. The H2 bond length was 0.74 Å and then decimal places were added to both the HF and H2 until the the position of the TS was found to be HF=0.744878 Å and H2=1.810789 Å. The KE and the forces along the AB and BC being 0 confirmed the TS position.
Excellent literature searching for specific comparisons with the energies involved in bond breaking/forming. Mys18 (talk) 23:55, 19 May 2019 (BST)
Activation Energy
The activation energy was found by calculating the energetic difference between the TS and the reactants when the reacting species are no longer in the TS. This was achieved by reducing/increasing the value of rAB and rBC. The activation energy was then calculated to be:
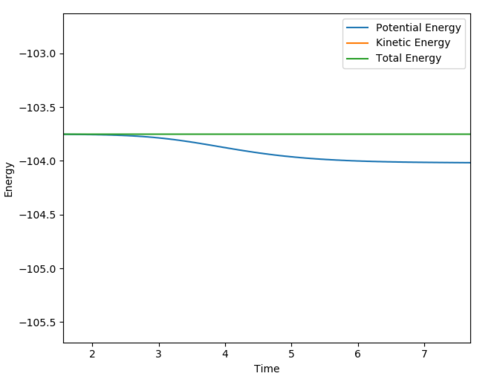
Ea of H2 + F reaction=0.275 kcal/mol
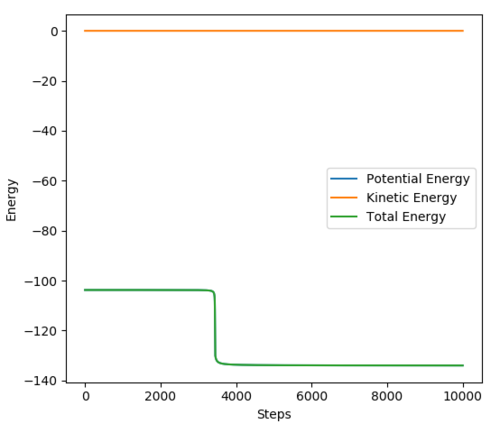
Ea of HF + H reaction=28.25 kcal/mol
Good, perfect units. Mys18 (talk) 23:56, 19 May 2019 (BST)
Reaction dynamics: F + H2 → HF + H
To achieve a reaction trajectory the conditions were set to:
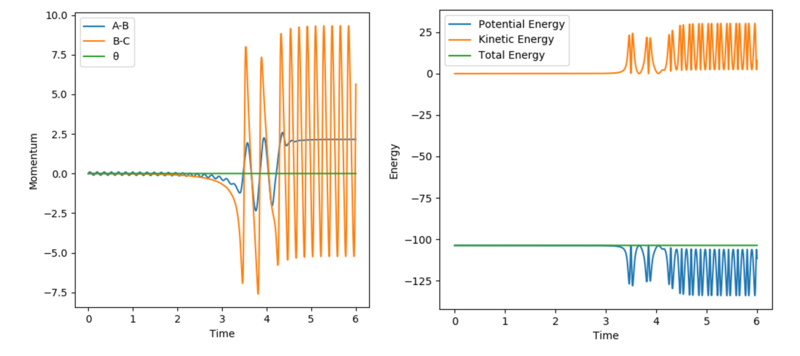
Initially the H2 molecule travels straight with low amplitude oscillations as seen in Figure 12. Following the collision of H2 with the F atom the produced HF molecule has excess KE due to the exothermic reaction (formation of HF bond) and is vibrationally excited, oscillating at high amplitudes. In light of the fact that energy is conserved the total energy in this reaction system remains constant as seen in Figure 12. Instead, PE is converted to KE as the atoms collude manifested in the HF oscillations.
This can be experimentally observed form IR-emission spectroscopy. Following the formation of the products, the HF bond is vibrationally excited therefore, the IR emitted of the HF can be detected.
Indeed, using IR spectroscopy would be most useful. What sort of frequency would you expect to observe? Mys18 (talk) 23:57, 19 May 2019 (BST)
Polanyi's Empirical Rules[2]
In chemical reactions, in order for the reactants to become products they have to overcome the activation energy barrier. The Polyani Rules explain that vibrational energy promotes a late-barrier reaction (endothermic–product resembling TS) more efficiently, in contrast to translational energy that promotes early-barrier reaction (exothermic–reactant resembling TS).
The forward reaction H2 + F is exothermic, as stated above. Therefore, it is an early-barrier reaction and the TS is energetically closer to the reactants. As per Polyani’s Rules, translational energy is more efficient in this reaction.
The reverse reaction HF + H is endothermic, as stated above. Therefore, it is a late-barrier reaction and the TS is energetically closer to the products. As per Polyani’s Rules, vibrational energy is more efficient in this reaction.
Forward Reaction: H2 + F → HF + H
Test 1
System Conditions:
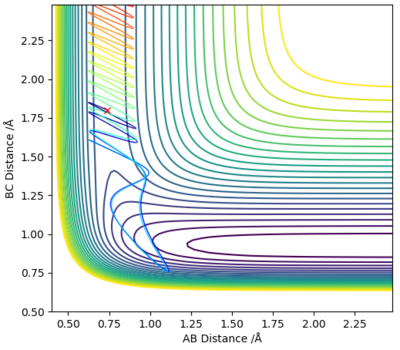
As shown on Figure 15 H2 and F collide however, the reaction does not go to completion as the collision is unsuccessful. Although the molecules have collided and there is sufficient KE to overcome the Ea barrier, barrier recrossing occurs and the products are not formed.
The energy deposited in the system is vibrational energy; as per Polyani's Rules vibrational energy is not effective for this system, as the reaction is exothermic with an early-barrier reaction and a TS energetically closer to the reactants. Therefore the forward exothermic reaction is not promoted.
Test 2
System Conditions:
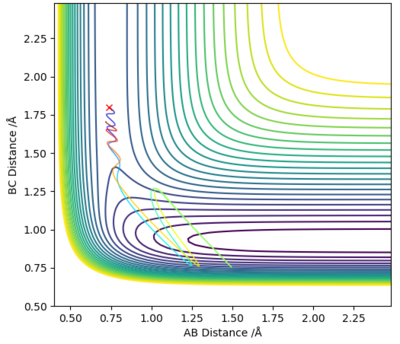
As shown on Figure 16 H2 and F collide and the reaction does go to completion as the collision is successful. Although the total energy of the system is lowered (lower vibrational energy) the translation energy of the reactants is raised as seen in the reaction conditions and the products are formed.
The energy deposited in the system is translational energy; as per Polyani's Rules translational energy is efficient for this system, as the reaction is exothermic with an early-barrier reaction and a TS energetically closer to the reactants. Therefore the forward exothermic reaction is promoted.
Reverse Reaction: HF + H → H2 + F
Test 1
System Conditions:

As shown on Figure 17 H2 and F collide however, the reaction does not go to completion as the collision is unsuccessful. Although the molecules have collided and there is insufficient KE to overcome the Ea barrier and the products are not formed.
The energy deposited in the system is vibrational energy; as per Polyani's Rules vibrational energy is effective for this system, as the reaction is endothermic with a late-barrier reaction and a TS energetically closer to the products. In this case the vibrational energy is insufficient to drive the reaction.
Test 2
System Conditions:
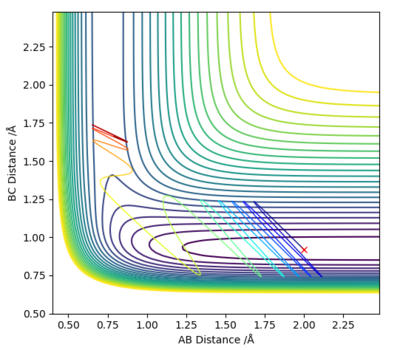
As seen in Figure 18 and the system conditions, by increasing the amount of vibrational energy in the system (pFH) resulted in a successful collision and product formation. As the reactants have sufficient KE the activation energy barrier was crossed and the chemical reaction occurred.
As above the energy deposited in the system is vibrational energy, efficient for this system and sufficient to drive the reaction.
To conclude, increasing the translational energy promotes an exothermic reaction and increasing the vibrational energy promotes an endothermic reaction; the tests carried out are in accordance with the Polyani's rules.
Excellent, good diagrams to compliment your explanations and indeed to support Polanyi's rule. This report was very well laid out and written up concisely providing correct answers with substantial detail. There is great evidence for understanding the theory behind the lab and you have included good references. Great job :) Mys18 (talk) 00:01, 20 May 2019 (BST)

