MRD:maddiehardstaff
(Fv611 (talk) 11:48, 25 May 2017 (BST) Very nice wiki - a few points to consider but some answers show you understood the content really well. Well done!)
Exercise 1: H + H2 system
Dynamics from the Transition State Region
The mathematics of molecular potential energy surfaces (as a function of inter-nuclear separation) indicates many features of molecular collisions. They are principally used to determine both the thermodynamic and kinetic feasibility of whether a given collision (of reactant molecules) results in the formation of product molecules. [1]
The transition structure corresponds to a maximum on the minimum energy path, which is a saddle point on the surface plot.[1] As with the minimum in the potential energy surface, the total gradient of the potential energy surface has a value of zero at both of these stationery points. [2]
Distinction Between Maxima and Minima
A true minimum and a saddle point can be distinguished by using the 'Two-Variable Second Derivative Test'.[2]
Therefore, we must find the value of the following equation at each point:[2]
The minimum in the potential energy surface will have: a > 0.
The saddle point in the potential energy surface (the transition structure) will have: a <0. [2]
(Fv611 (talk) 15:56, 24 May 2017 (BST) Very good discussion)
Locating the Transition State
The best estimate for the transition state of the H + H2 colinear colliding system, from analysis of the potential energy surface plot is found to be:
rts = 0.90775 A
This is the value of the equidistant A-B and B-C inter-nuclear distances at which the system is at its maximum potential energy (transition state structure).[1] This must be the location of the transition state, there is no oscillation in either bond length, as shown by the horizontal lines in the corresponding Internuclear Distances vs. Time Plot (see Figure 1). This must therefore correspond to the transition state since, by definition, the transition state corresponds to a stationery point in the potential energy plot.[1] Thus, at the exact point in the transition state, the gradient of the plot is zero.[1] Therefore, the force exerted on each H atom is zero, because force is given by the derivative of potential energy with respect to inter-nuclear separation.[1] If no force is exerted on any of the (hydrogen) atoms in the system, they will not be displaced.[1] Therefore, all three H atoms will remain perfectly stationary, and so the inter-nuclear separations in the transition structure are fixed, giving a horizontal line in the Internuclear Distances vs. Time Plot, as shown in Figure 1.
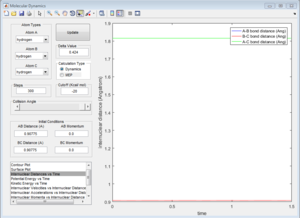
Calculating the Reaction Path
The value of r1 (B-C distance) differs in the 'Dynamics' analytical technique and the 'MEP' analytical technique. Using the Dynamics run (since this is more representative of the true structure), with 300 steps:
At time, t = 2:
r1 (B-C distance) = 0.755 A
r2 (A-B distance) = 7.155 A
p1 = + 2.481
p2 = + 1.122
With the offset (from the transition structure) changed to the opposite direction, the atoms revert back to the original reactant molecule, BC and atom A, rather than giving the product AB and dissociated atom C.
Minimum Energy Path (MEP) vs. Trajectory
Both the minimum energy path (MEP) and reactive trajectory path show the variation in A-B bond length (r2) as a function of increasing B-C bond length (r2), starting from a position on the potential energy surface which is slightly offset from the transition state, i.e. observing how the reacting system 'rolls' across the PES in the direction of increasing r2. Due to the way the system coordinates have been defined, the system 'starts' at a position offset from the transition structure in such a way that results in the formation of products .
The MEP, however, has fewer degrees of freedom [3] - the potential energy is held constant - at the minimum value. Therefore, kinetic energy is also fixed (by Conservation of Energy).[3] This means that the MEP can be considered as a pseudo-two variable system, in which the only variables free to change are A-B (r2) bond length, and B-C bond length (r1). [3]
However, the dynamic trajectory does not have such limitations, and therefore shows a system which is subject to more degrees of freedom, i.e. potential energy is not fixed at the absolute minimum value.[3] Therefore, the A-B inter-nuclear distance (the bond length of the product H2 molecule), oscillates as the potential energy interconverts between kinetic and potential energy, according to the Principle of Conservation of Energy (as observed in the Internuclear Distances vs. Time plot (see ''Figure 2'')). [3]
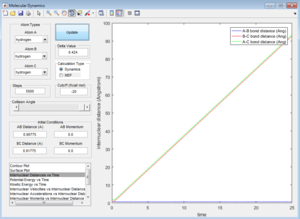
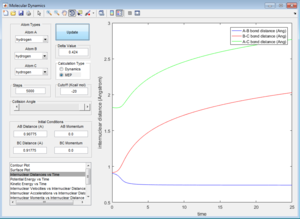

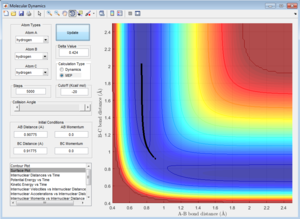
When the initial positions correspond to the final positions of the trajectory, and the final momenta have their signs reversed, we just observe the final AB molecule vibrating about its equilibrium bond length, with the C atom dissociated.
(Fv611 (talk) 15:56, 24 May 2017 (BST) Very good. Consider also that as the energy is kept to the minimum, the kinetic energy is actually fixed as zero.)
Reactive Trajectories
By using different sets of initial conditions - specifically, differing pairs of the initial momenta along the A-B axis (p2) and the initial momenta along the B-C axis (p1), and observing the dynamic trajectory, the trajectory can be classified as either reactive (results in formation of the AB bond, with dissociated C), or unreactive, where the system simply reverts back to the reactants (BC molecule with A dissociated).
| Initial Conditions | p1 | p2 | Reactive or Unreactive Trajectory? |
|---|---|---|---|
| 1 | -1.25 | -2.5 | Reactive |
| 2 | -1.5 | -2.0 | Unreactive |
| 3 | -1.5 | -2.5 | Reactive |
| 4 | -2.5 | -5.0 | Unreactive |
| 5 | -2.5 | -5.2 | Reactive |
Initial Conditions 1
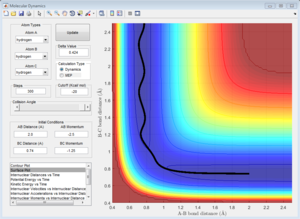
Along the reactive trajectory, the AB inter-nuclear distance decreases as the A atom approaches the BC molecule. At the transition state, the BC bond is breaking as the AC bond is forming, and the momentum p2 (along the AB inter-nuclear distance) is so great that it can overcome the activation barrier, and the B-C bond breaks.[3] C dissociates, and its momentum increases in magnitude as it dissociates away from the newly-formed AB molecule. The A-B bond oscillates about the equilibrium bond length, as the total energy of the A-B bond interconverts between potential and kinetic energy, in line with the Conservation of Energy.[3]
Initial Conditions 2
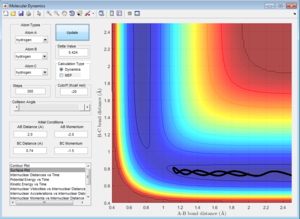
Atom A approaches molecule BC (which is oscillating about the equilibrium bond length). However, the momentum along A-B (p2) is so low that A has insufficient kinetic energy to to overcome the activation barrier,[3] and therefore approaches B, with the magnitude of p2 decreasing to 0 at a closest distance of 1.116. At this point, A rebounds, and the momentum increases in the opposite direction as A dissociates away from BC.
Initial Conditions 3
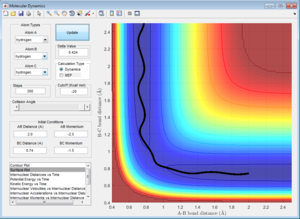
A approaches the molecule BC with a momentum (p2) sufficient to overcome the energy barrier for A-B bond formation.[3] The momentum along the B-C axis (p1) is greater than p1 in the Initial Conditions 1, and so the dissociation of C is more easily achieved (i.e. the B-C bond breaks more quickly), for a system with Initial Conditions 3.
Initial Conditions 4 and 5
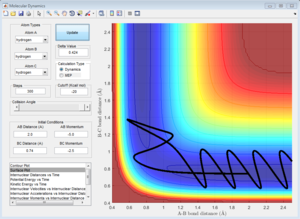
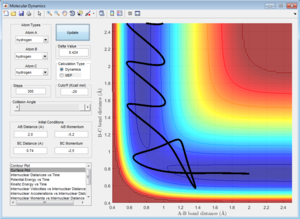
Both systems with initial conditions 4 and 5 have a very large (relative) magnitude p2, which is the momentum along the A-B bond length. This means that for both systems, there is a large translational kinetic energy as the hydrogen atom A approaches the rapidly oscillating molecule BC. Both systems show a dynamic trajectory which 'bounces' between the walls of infinite potential. The system with initial conditions 4 'bounces' several times, but eventually reverts back to the reactants, whereas the reactive system corresponding to the initial conditions 5 also 'bounces', but does eventually proceed to the products.
It is difficult to definitively justify the difference in reactivity of the two trajectories, and indicates the limitations in using Transition State Theory[3] to predict reactivity of a given dynamic trajectory when the reacting molecules have a high initial translational kinetic energy. This is in contrast to the reacting systems with initial conditions 1, 2 and 3, which correspond to significantly lower initial translational kinetic energies. For these three systems, the reactivity (or lack thereof) of each trajectory can be easily justified.[3]
(Fv611 (talk) 15:56, 24 May 2017 (BST) Lovely discussion.)
Transition State Theory
The transition state is a saddle point.[1] At this precise point on the potential energy surface, the reacting atoms must have a very specific arrangement (i.e. all bond lengths must have a very specific value), called a "critical geometry".[3] Hence, the probability of a given trajectory (which results in successful reaction), reaching this precise point is very low.[3]Therefore, a vast majority of reactive trajectories do not actually pass exactly through the transition state geometry. [3] .
A system with a dynamic trajectory that results in successful reaction must have an overall energy which either equals or exceeds the activation energy (which is the exact value of potential energy corresponding to the saddle point, i.e. the transition state structure). [3] Therefore, a given (experimental) reactive trajectory (which does not pass exactly through the transition structure) will most likely have a maximum potential energy value (the experimental activation energy) greater than the energy at the saddle point (the calculated activation energy). [3]
Arrhenius' equation relates activation energy to rate of reaction: k=Ae(-Ea/RT) .[3] This relationship means that the greater the activation energy of a given reaction, the smaller the value of the rate constant, k, and therefore, the slower the reaction rate.[3] In the case of Transition State Theory, where it is very likely that experimental activation energies will be larger than calculated activation energies, for a given reaction, this means that the experimental rate of reaction is likely to be slower than that calculated using Transition State Theory. [3]
(Fv611 (talk) 15:56, 24 May 2017 (BST) Good discussion on rates, but you missed a few key points. How does TST deal with quantum effects? Does it allow for recrossing?)
Exercise 2: F + H2 system
The H2 + F reaction is exothermic. This can be easily determined by observation of the surface plot : as A-B inter-nuclear separation decreases from an effectively infinite separation (as the F atom approaches the H2 molecule), the potential energy decreases to a minimum. Exothermic reactions are defined as reactions in which products have a lower total potential energy than reactants,[3] so the lower potential energy at a small B-C internuclear separation, and large A-B (i.e. when the H-F bond has formed and H-H has broken) indicates that the formation of HF and dissociation of H2 is an exothermic process.[3] This is shown in Figure 11.

Therefore, the reverse reaction (HF dissociating and H2 reforming) must by definition be an endothermic (i.e. enthalpically unfavorable) process, as is shown in Figure 12.

Therefore, this proves that the HF bond must be stronger (have a more negative enthalpy of formation)[3] than the H2 bond - since the H2 and F sytem which forms a HF bond at the expense of a H2 bond has a negative (exothermic) reaction enthalpy.[3]
(Fv611 (talk) 15:56, 24 May 2017 (BST) Very good.)
Locating the Transition State
The transtion state can be approximated (to 3 decimal places), to:
A-B (H-F internuclear separation): 1.812 A
B-C (H-H internuclear separation): 0.745 A
Activation Energy
(To two decimal places)
Absolute energy of the transition state:-103.75 kcalmol-1
Absolute energy of H2 and F: -104.02 kcalmol-1
Absolute energy of HF and H: -134.01 kcalmol-1
Activation energy to form H2 and F: -103.75 - (-104.02) = 0.27 kcalmol-1
Activation energy to form HF and H: -103.75 - (-134.01) = 30.26 kcalmol-1
(Fv611 (talk) 15:56, 24 May 2017 (BST) Correct, but it would have been nicer to explain where you're getting these values from.)
Mechanism for Release of Reaction Energy
As shown in Figure 13, the vibrational energy in the reactants is smaller than the vibrational energy in the products (since the amplitude of the oscillations in the corresponding directions is much larger in the products (in the A-B bond, i.e. H-F).
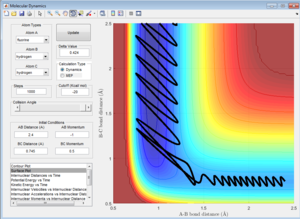
The translational kinetic energy is approximately proportional period of the oscillations, due to the manner in which the momenta have been defined. Although these differ between reactants and products, the magnitude of this difference is significantly less than the difference in amplitude. However, since the period of oscillations is also larger in the products ( see Figure 13), the translational kinetic energy is larger in the products.
Therefore, the total kinetic energy (vibrational plus translational, neglecting rotational, as there is zero rotation in a diatomic molecule)[3] is greater in the products (HF and H).[3] However, due to the Conservation of Energy, the total energy of the system (potential energy plus kinetic energy) must remain constant. [3]
Therefore, the potential energy of the product state must be lower than reactants - which we know is true as we have already found the H2 + F reaction to be exothermic. This is shown in the surface plot, Figure 14:
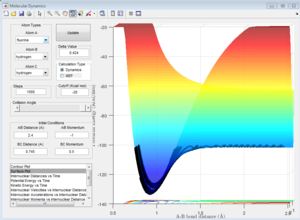
This could be proven by several different experimental methods, including infrared spectroscopy and calorimetry.[3]
Infrared Spectroscopy
In the reactants, the vibrational kinetic energy is lower. Therefore, the reactant and product systems could each be monitored experimentally by recording an IR spectrum for each system. For the reactant system, the intensity of absorption of the H-H bond (reactants) would be much lower than the intensity of the absorption peak corresponding to the H-F bond (products).[3]
Calorimetry
Conversely, due to the higher total kinetic energy of the product system, the products are hotter than reactants - the exothermic nature of the reaction means that temperature of the system increases as heat energy is released. Therefore, calorimetry, which is a technique used to measure the change in heat energy of a reaction, could be used to monitor the given reaction.[3]
Polanyi Rules
The Polyani rules state that late transition states (those corresponding to endothermic reactions, according to Hammond's postulate)[4] are enhanced by a greater vibrational kinetic energy (than translational kinetic energy), whereas early transition states (corresponding to exothermic reactions)[4] are favored by a higher translational kinetic energy (so lower vibrational kinetic energy).[5]
Therefore, the case study of the HF plus H reaction with different pHH and PHF momenta values allows a visual example of these rules. This reaction is an endothermic reaction, so has a late transition state, by Hammond's postulate.[4] Therefore, according to the Polyani rules, the forwards reaction will be promoted by a higher vibrational kinetic energy than translational kinetic energy in the reactants.[5]
This is shown as such:
For a high initial BC momentum (pBC = 9.26) (corresponding to high H-H vibrational energy), with a low initial translational kinetic energy (pAB = -0.9), the forwards reaction is kinetically favoured, as shown by the existence of a reactive pathway in Figure 15.
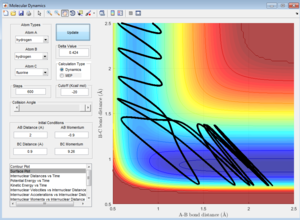
However, since the Polyani rules are only empirical, [5] they are not infallible. For example, many systems actually disobey the rules, including the given trial system - the H2 plus F reaction is exothermic so by Hammond's postulate, should have an early transition state. [4] Therefore, according to the Polyani rules, the forwards process should be favoured by a higher translational kinetic energy.[5] When this hypothesis was tested (using the given initial parameters, pHH = -0.5 and rHH = 0.74), the opposite was found to be true (although the files are not included). The reaction only went to completion when initial vibrational energy of the reactants was higher than the initial translational kinetic energy, corresponding to a larger magnitude pHH momentum (proportional to H-H vibrational energy) than pHF.
A potential reason for this discrepancy between the empirical Polyani rules and the calculated trajectory is that the calculation shows only one very specific reaction trajectory. However, the Polyani rules are empirical (determined experimentally),[5] and so by definition correspond to the average behavior of the overall canonical ensemble. [3] Therefore, although there was a deviation between the specific trajectory observed computationally and the Polyani predictions,[5] the computed trajectory may be an anomalous result, not representative of the average behavior that the reacting system would display on the experimental scale.
(Fv611 (talk) 15:56, 24 May 2017 (BST) Excellent discussion)
References
[1] </references>
[2] </references>
[3] </references>
[4] </references>
[5] </references>
- ↑ 1.0 1.1 1.2 1.3 1.4 1.5 1.6 1.7 1.8 R. J. Silbey, R. A. Alberty and M. G. Bawendi, Physical Chemistry, John Wiley & Sons, Inc., New York, 2001
- ↑ 2.0 2.1 2.2 2.3 2.4 J. Stewart, Essential Calculus, Brooks/Cole, Benson, 2007
- ↑ 3.00 3.01 3.02 3.03 3.04 3.05 3.06 3.07 3.08 3.09 3.10 3.11 3.12 3.13 3.14 3.15 3.16 3.17 3.18 3.19 3.20 3.21 3.22 3.23 3.24 3.25 3.26 3.27 3.28 3.29 3.30 P. Atkins and J. de Paula, Atkins' Physical Chemistry, Oxford University Press, Oxford, 2014
- ↑ 4.0 4.1 4.2 4.3 4.4 J. Clayden, N. Greeves and S. G. Warren, Organic Chemistry, Oxford University Press, Oxford, 2012
- ↑ 5.0 5.1 5.2 5.3 5.4 5.5 5.6 Z. Zhang, Y. Zhou, and D. H. Zhang, "Theoretical Study of the Validity of the Polanyi Rules for the Late-Barrier Cl + CHD3 Reaction", The Journal of Physical Chemistry Letters, 2012, 3(23), pg. 3416 - 3419
