MRD:lxr0627
EXERCISE 1: H + H2 system
1.On a potential energy surface diagram, how is the transition state mathematically defined? How can the transition state be identified, and how can it be distinguished from a local minimum of the potential energy surface?
The transition state is a saddle point on a potential energy surface, where the gradients of potential in orthogonal directions are both zero. It is a relative maximum point along an axis direction and a relative minimum point along the the orthogonal axis. It is mathematically defined as ∂V(ri)/∂ri=0 and D<0 , where D=[frr(ri,V(ri))fVV(ri,V(ri))-(frV(ri,V(ri))2].
Going along the minimum energy trajectory, the maximum point on the energy path is the transition state. It can be recognised from the contour plot as the point where AB and BC distances are equal to each other in this triatomic reaction case.
To distinguish from the local minimum, a minimum satisfies D>0 and frr(ri,V(ri))>0 while a saddle point has D<0. Good but you should define your varibles and illustrate the "orthogonal axis". Also, there is no clear definition of the "axis" that the local min and max lie on, where the the local maximum is found along the reaction path. Sf3014 (talk) 22:21, 28 May 2019 (BST)
2.Report your best estimate of the transition state position (rts) and explain your reasoning illustrating it with a “Internuclear Distances vs Time” plot for a relevant trajectory.
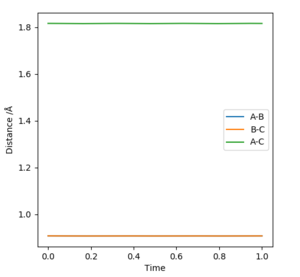
The best estimate transition state is found to be at r1=r2= 0.908 Å, where the animation shows the three atoms are at fixed positions. The graph of “Internuclear Distances vs Time” shows the constant BC and AC distances, indicating the transition state at this point. Good but how did you get this position for the transition state. And where is this shown on the animation? If you state that something is "shown", show it. Sf3014 (talk) 22:31, 28 May 2019 (BST)
3.Comment on how the mep and the trajectory you just calculated differ.
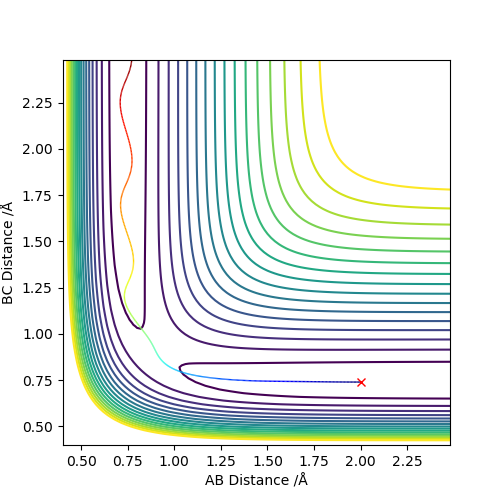
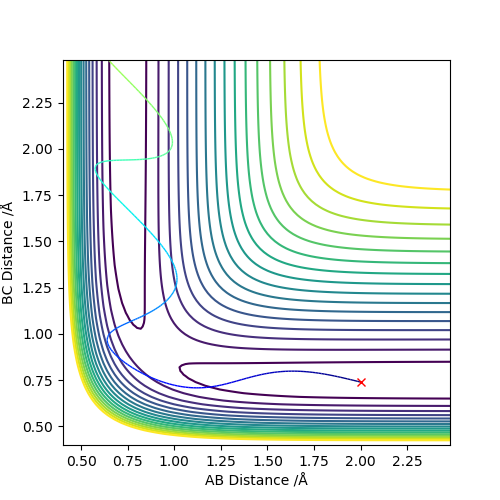
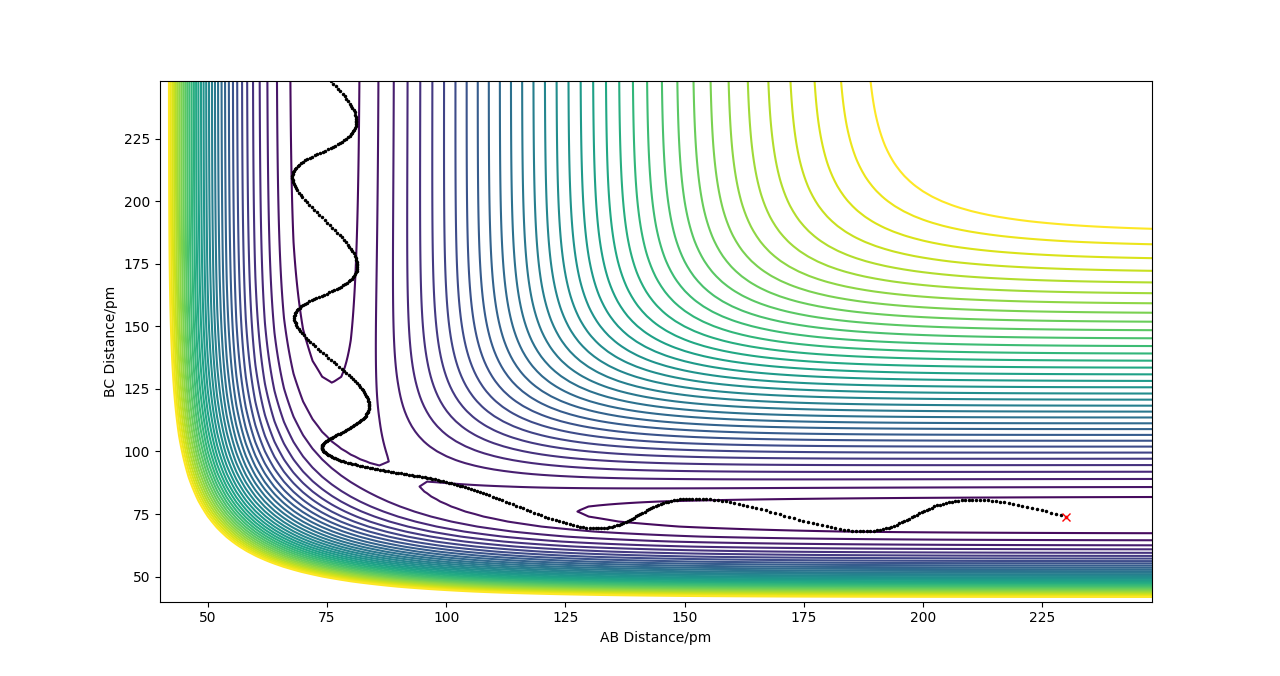
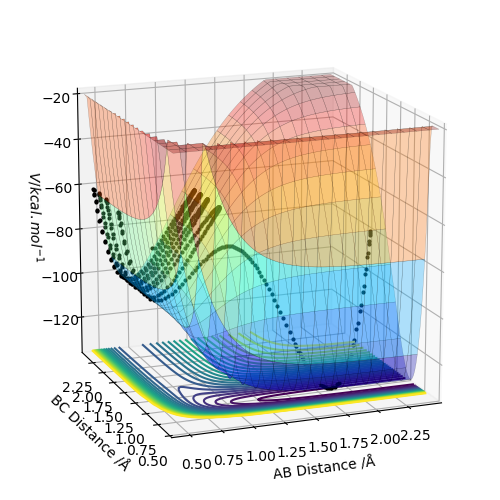
Conditions are set as r1=rts+δ = 0.918 Å, r2 = rts = 0.908 Å and p1=p2=0. The MEP calculation gives a trajectory of a straight line with smoothly increasing potential energy but no oscillation on a surface plot. The Dynamic calculation results in a wavy line going up in energy with oscillation behaviour.
Changing to r1 = rts = 0.908 Å, r2 =rts+δ = 0.918 Å gives similar properties like above and the big difference is that the trajectory rises from the opposite direction in surface plot. In the “ Internuclear Distances vs Time” and “Momenta vs Time” graphs, the A-B and B-C exchange the their positions. You should show the graphs that you have stated, to back up your statement. What did you concluded for the differences between MEP and dynamic calculations, in terms of momenta and energy?. Also, does the MEP trajectory result in increasing potential energy from your initial values? when the MEP trajectory follows the reaction path away from a position close to the local maximum. Sf3014 (talk) 22:48, 28 May 2019 (BST)
At r1 = 0.908 Å, r2 = 0.918 Å, the final r1(t) = 0.73 Å and r2(t) = 3.46 Å. p1(t) = 1.44 and p2(t) = 2.49 when t is large.
At r1 = 0.918 Å, r2 = 0.908 Å, the final r1(t) = 3.46 Å and r2(t) = 0.73 Å. p1(t) = 2.49 and p2(t) = 1.44 when t is large.
Setup a calculation where the initial positions correspond to the final positions of the trajectory you calculated above, the same final momenta values but with their signs reversed.
The whole process is observed to be reversed. Instead of three close atoms colliding with each other and moving apart, the atoms far away in the beginning comes together.
4.Complete the table above by adding the total energy, whether the trajectory is reactive or unreactive, and provide a plot of the trajectory and a small description for what happens along the trajectory. What can you conclude from the table?
| p1 | p2 | Etot | Reactive? | Description of the dynamics and Illustration of the trajectory |
|---|---|---|---|---|
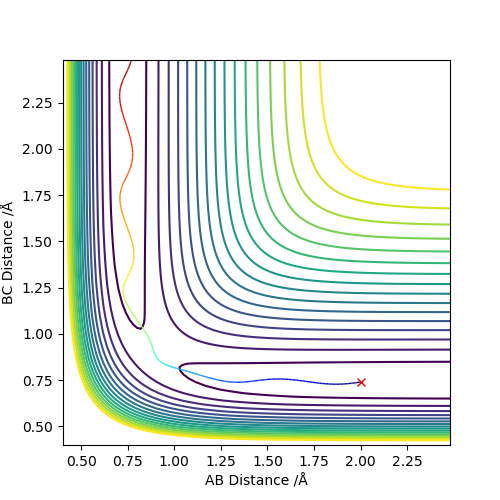
| -1.25 | -2.5 | -99.0 | yes | The reactants have enough kinetic energy to process the reaction, which can be seen from the contour plot, the trajectory goes through the transition state and moves to the products. |
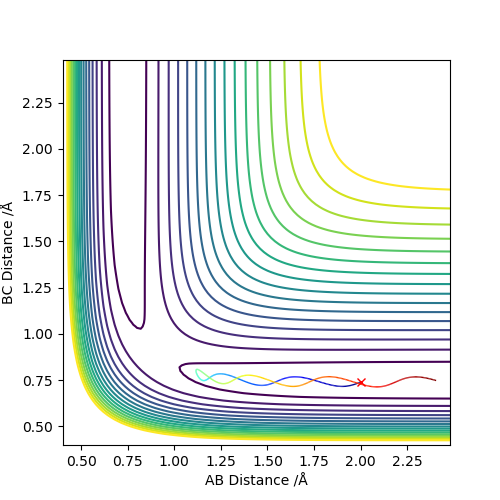
| -1.5 | -2.0 | -100.5 | no | The reactants do not have enough kinetic energy to process the reaction, which can be seen from the contour plot, instead of going pass the transition state, the trajectory returns to the reactants. |
| -1.5 | -2.5 | -99.0 | yes | The reactants have enough kinetic energy to process the reaction, which can be seen from the contour plot, the trajectory goes through the transition state and moves to the products. |
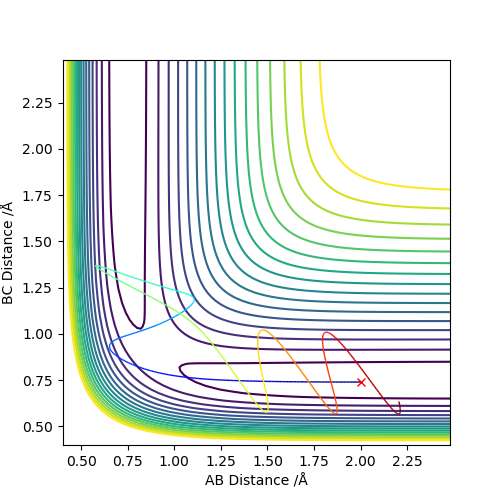
| -2.5 | -5.0 | -85.5 | no | The reactants have enough kinetic energy to go through the transition state. It can be seen from the contour plot that the trajectory moves to the products initially, but since it possesses the energy to go over transition state again, the trajectory returns to the reactants in the end. |
| -2.5 | -5.2 | -83.4 | yes | The reactants have enough kinetic energy to go through the transition state initially and to pass the transition state the second time, returning to the reactants. After this, as it still possesses the enough energy to go over the transition state the third time, the trajectory leads to the products as shown in the contour plot. |
To conclude the table, the reactants need to possess enough kinetic energy to pass the transition state. However, a high momenta doesn't promise the reaction will happen. After the trajectory passes the transition state, if it still possesses enough kinetic energy it will pass the transition state the second time and return to the reactants. In this case the reaction will not happen. Very good observations and conclusion. Sf3014 (talk) 22:56, 28 May 2019 (BST)
5.State what are the main assumptions of Transition State Theory. Given the results you have obtained, how will Transition State Theory predictions for reaction rate values compare with experimental values?
Assumption 1:The atomic nuclei is assumed to behave in the classic mechanics way, in which the reactions only happen when the reactants possesses enough energy to pass the transition state. The quantum tunnelling effect is ignored here, which states the possibility that the reactants tunnelling through the energy barrier to the products without possessing enough energy.
Assumption 2: Each atom in the reactants or intermediates has a Boltzmann distribution energy. The intermediates are assumed to be long-lived.
Assumption 3: The reaction trajectory is assumed to pass the lowest energy saddle point on the potential energy surface. This is not always true at high temperatures.
Assumption 4: The systems have a velocity towards to product configuration so once passing the transition state the trajectory will not go back to reactants.
According to the assumptions, the TST predicted rate values will be larger than the experimental values as the trajectory is assumed to move only forward and there is not reverse reaction. [1] Good but you should define TST, ie transition state theory (TST), then you can use TST. Also, this would be better if you referred to your trajectories in your table above in your conclusion on TST and the experimental reaction rates. Sf3014 (talk) 22:56, 28 May 2019 (BST)
EXERCISE 2: F - H - H system
1.By inspecting the potential energy surfaces, classify the F + H2 and H + HF reactions according to their energetics (endothermic or exothermic). How does this relate to the bond strength of the chemical species involved?
Good but A, B and C are not defined. You could also include reported values for HF and H2 bond energies in your explanation. Sf3014 (talk) 23:04, 28 May 2019 (BST)
2.Locate the approximate position of the transition state.
| Reaction | position of Transition state | Contour plot |
|---|---|---|
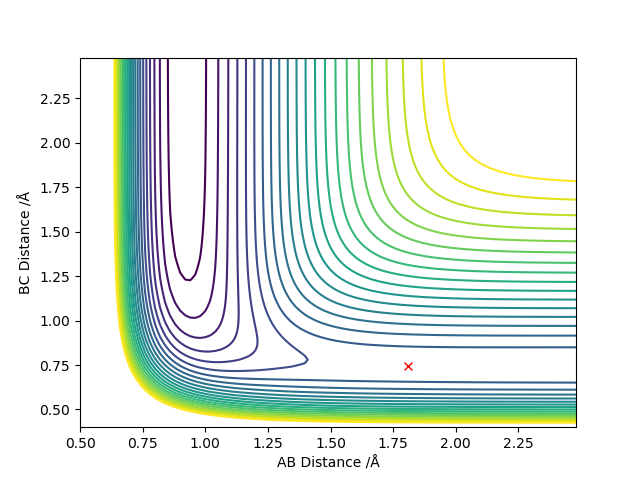
| F + H2 | AB=1.81, BC=0.746
p(AB)=p(BC)=0 |
|
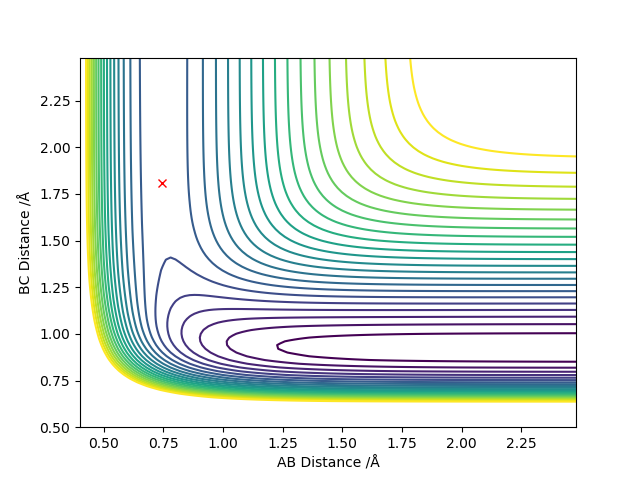
| H + HF | AB=0.744, BC=1.81
p(AB)=p(BC)=0 |
|
The transition state is located at a point where the trajectory oscillates on the ridge but does not fall off. Good but how did you locate the position of your transition state? More description needed. Sf3014 (talk) 23:06, 28 May 2019 (BST)
3.Report the activation energy for both reactions.
4.In light of the fact that energy is conserved, discuss the mechanism of release of the reaction energy. Explain how this could be confirmed experimentally.
| Reaction | Graph | Description |
|---|---|---|
| F + H2
AB=2.0, BC=0.75 p(AB)=-1.3, p(BC)=0 |

|
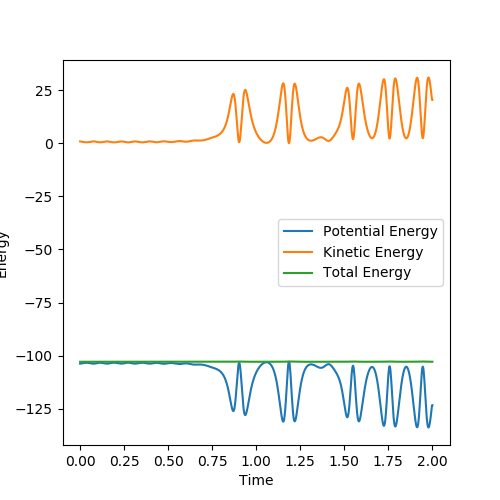
In the reaction process, the kinetic energy increases in consistence with the potential decrease and both are to the same extent, holding the total energy constant. The energy conservation can be seen from the Energy vs Time graph through the constant total energy line. This reaction is exothermic as the potential energy decreases and the increase in kinetic energy can be seen experimentally from the heat released, which will raise the temperature. Good but define which analytical technique will show you this. Sf3014 (talk) 23:10, 28 May 2019 (BST) |
Setup a calculation starting on the side of the reactants of F + H2, at the bottom of the well rHH = 0.74, with a momentum pFH = -0.5, and explore several values of pHH in the range -3 to 3 (explore values also close to these limits). What do you observe?
At conditions of rHH = 0.74, rFH = 2.0 and pFH= -0.5, it is observed that when the magnitude of pHH increases, the H2 vibrates along the H-H bond more strongly. When the vibration is low at small pHH, the H collides with F and forms H-F bond but immediately reforms H-H bond. However in high vibration at high pHH the H atom collides with incoming F but retains H-H bond.
For the same initial position, increase slightly the momentum pFH = -0.8, and considerably reduce the overall energy of the system by reducing the momentum pHH = 0.1. What do you observe now?
The vibration is low and the new H-F is formed. The incoming F atoms collides with the H with a faster speed.
5.Discuss how the distribution of energy between different modes (translation and vibration) affect the efficiency of the reaction, and how this is influenced by the position of the transition state.
| Reaction | Contour plot |
|---|---|
| High translation energy
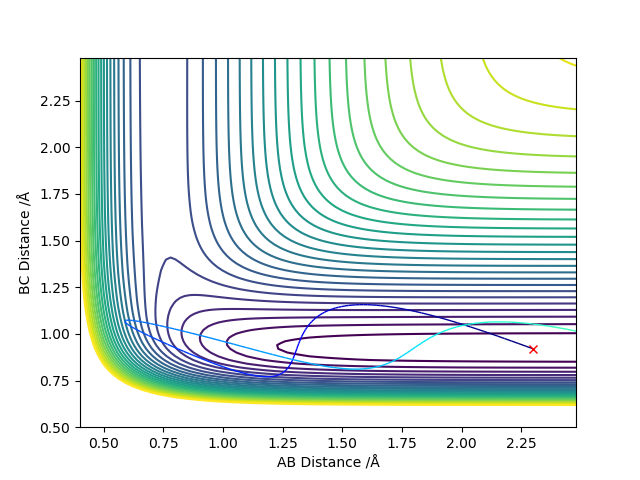
rHH = 2.3, rHF = 0.92 pHH = -8, pFH = -1 |
|
| High vibration energy
rHH = 2.3, rHF = 0.92 pHH = -1, pFH = -7.35 |

|
The reaction is endothermic so attains a late transition state. According to Polanyi's empirical rules, the vibration of a molecule bond in the late barrier reaction is more likely to make a significant contribution to the reaction rate, which can be seen from the trajectories above. In late barrier reactions, the molecule with higher vibration energy is more likely to go over the energy barrier to form transition state than the one with high translation energy.
However, for early barrier reactions, the high translation energy promotes the reaction more effectively to go over early transition state. Good but you should conclude your observations above with Polanyi's rules and in your graph define A, B and C. Also, a reference for polanyi's rules would be great. Overall good but a lot of details were not concluded, explained or defined very well, you need to be more thorough with your findings. Sf3014 (talk) 23:16, 28 May 2019 (BST)

