MRD:lu01083057
Molecular Reaction Dynamic: Application to Triatomic Systems
H + H2 Systems
This system will describe the dynamic associated within the collision of a hydrogen atom (HA) and a hydrogen molecule (HB-HC).
The chemical equation is: HA + HB-HC -> HA-HB + HC
The distance between HB and HC = r1 , the momentum = p1
The distance between HA and HB = r2 , the momentum = p2
The initial condition for the collision system will be set at: r1=0.74 Å, r2=2.30 Å; p1=0.0 Ns, p2=-2.7 Ns
Under this condition, the system has a reactive trajectory for the reaction to take place. The value of r2 is will decrease and oscillate about a constant value whereas r1 will increase and stay constant also. This indicates that bond breaks between HB and HC and forms between HA and HB. The oscillating behavior is due to the H-H bond vibrations.
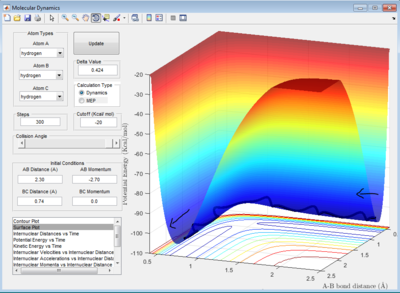
Dynamics from the transition state region
The transition state is defined as the saddle point which is the local maxima on the minimum energy path linking reactants and the products. Therefore, at both minimum point and transition structure, the total gradient of the potential energy surface have a value of zero. This is described by the first derivative of potential energy vs bond distances graph : ∂V(ri)/∂ri = 0
The minima and transition structures can be distinguished using the calculation of second derivative of the curvature (gradient) of the potential energy surface. A negative value of second derivative of gradient (<0) indicated a transition structure whereas positive value (>0) represented the minimum point of reaction path.
Second derivatives of the gradient: ∂2V(ri)/∂ri2
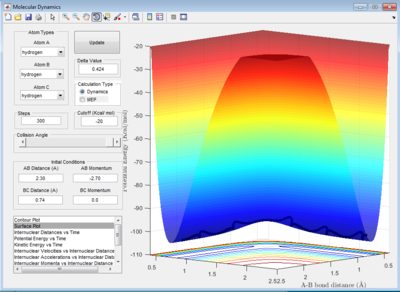
Trajectories from r1 = r2: locating the transition state
The transition state position (rTS) can be estimated using trial-and-error method by fixing the momentum p1 = p2 = 0.0, and altering the values of initial condition: r1 = r2.
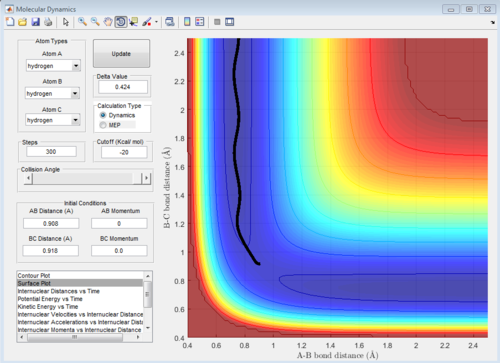
The best estimated TS position is obtained at rTS = r1 = r2= 0.908 ± 0.0005 Å.
The small deviation of 0.0005 Å is due to the periodic symmetric vibration of the system at its transition state. The internuclear distance vs time graph showed straight lines indicating very least oscillations against time in the internuclear distances between A-B, B-C and A-C.
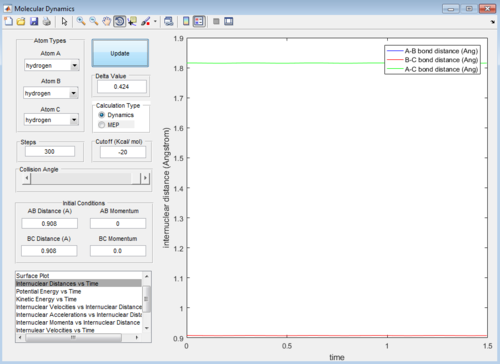
Calculate the reaction path at trajectories from r1 = rTS+δ, r2 = rTS
Calculation A-Minimum Energy Path (MEP):
The reaction path (minimum energy path or MEP) is a very special trajectory that corresponds to infinitely slow motion as the velocity always reset to zero in each time step.
Once the transition state has been located, the minimum energy path can be set such that the positions r1 = rTS + 0.01, r2 = rTS and the momenta p1 = p2 =0
MEP give smooth, straight line that follows the valley floor. This is the motion of atom and molecule is not real, therefore system will behave ideally with the H and H2 accelerate in the steepest pathway at each time at their velocities = 0 ms-1. As a result, the system will follow the minimum energy trajectory on the potential surface as shown in figure 4.
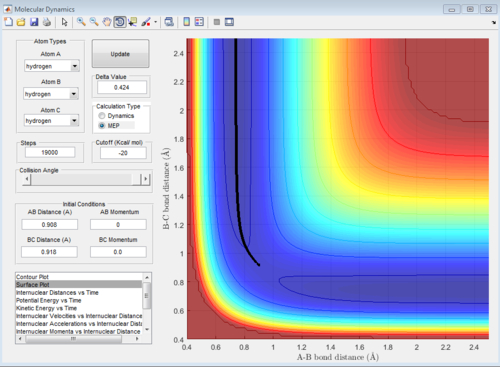
Calculation B- Dynamic:
Dynamic calculation considered the movements of H atom and H2 molecule starting from their initial velocities, this means that inertia associated with the H and H2 is taken into account. Also, the bond vibration of H2 molecule is not excluded as in MEP method and this results in a wavy line illustrating the H-H bond oscillations.
Reactive and unreactive trajectories
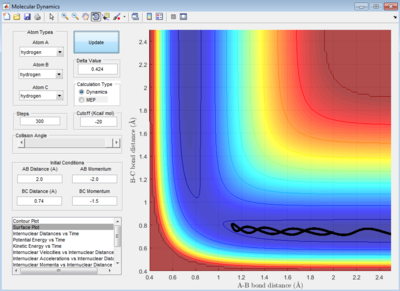
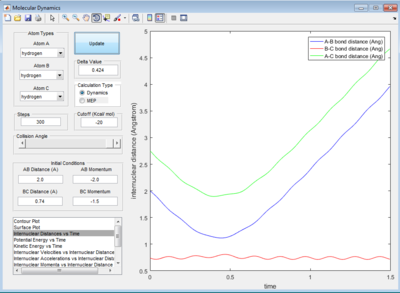
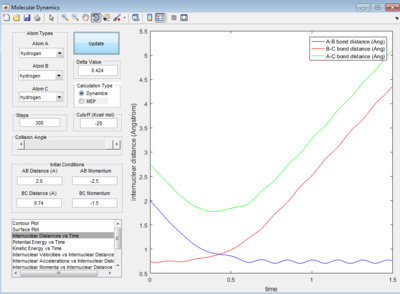
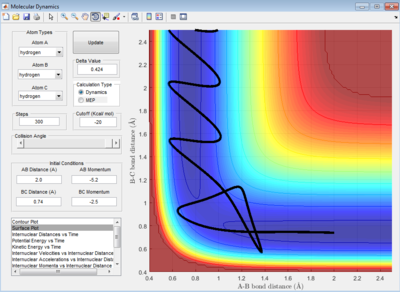
Complete the table by adding a column reporting if the trajectory is reactive or unreactive. For each set of initial conditions, provide a screenshot of the trajectory and a small description for what happens along the trajectory.
Transition State Theory
State what are the main assumptions of Transition State Theory. Given the results you have obtained, how will Transition State Theory predictions for reaction rate values compare with experimental values?
- Assumption of population of species in different energy states obey Boltzmann distributions
- Assumption of quasi-equilibrium between activated complexes with reactants[1]
- Assumption of any activated complex that crosses the transition energy barrier will necessarily continue on to form products
However, that is possibilities that some trajectories may cross the barrier more than once, with many of these being reverted back to reactants as the results of shape of potential energy surface[2]. For example, this assumption is not practical when apply to all five of the trajectories of the hydrogens' triatomic system in part 1.1.4. The trajectory 1 to 3 obey this assumption but 4 and 5 disagree as the transition state barrier is recrossed for two and three times respectively.
- Assumption of reacting molecules to pass through saddle point of potential energy surface[3]
Hence, the rates of reaction is assumed to be study by examining activated complexes near the saddle point of a potential energy surface. In reality (experiment), the predictions of reaction rates by TST is inaccurate, as some reaction trajectories need not pass through the saddle point.
- Assumption of the motion of reactant and product molecules obey the laws of classical mechanics, thus tunneling across the barrier doesn't occur
Therefore, it is not practical for light systems such as those of hydrogen, since quantum mechanical influences become important and the calculations become inaccurate.
F-H-H Triatomic Systems
Reaction Energetics
Classify the F + H2 and H + HF reactions according to their energetics (endothermic or exothermic). How does this relate to the bond strength of the chemical species involved?
Reaction enthalpy is the difference in bond energy of the reaction.
ΔH = bond breaking - bond forming
| Type of Reaction | Reaction Enthalpy (kJ mol-1) | Reaction Energetics |
|---|---|---|
| H2 + F -> HF + H | - 134 | Exothermic |
| HF + H -> H2 + F | + 134 | Endothermic |
The resulted in table 2 is because of the smaller potential energy obtained when the HF distance is small than when the H-H distance is small. So, the H-F has stronger bond strength than H-H. This is justified by comparisons with literature bond energy[4] (H-F) = 570 kJ mol-1 BE (H-H) = 436 kJ mol-1.
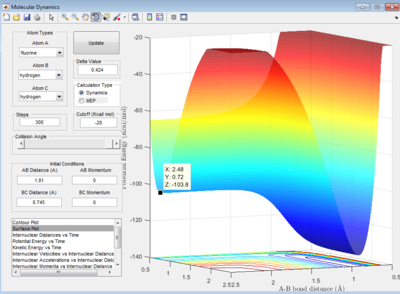
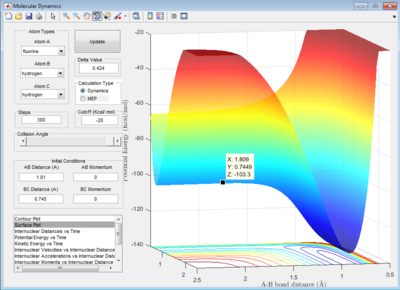
Locate the approximate position of the transition state
H2 + F system
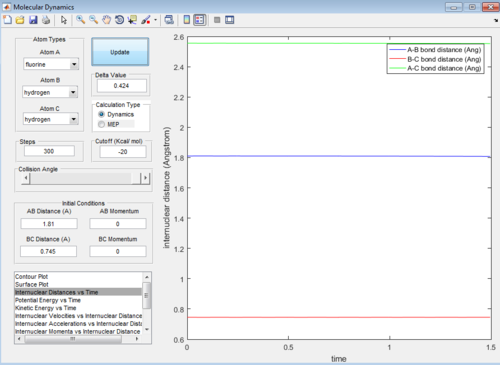
Let H2 = C-B and F = A, best approximated position for TS:
AB distance = 1.810 ± 0.002 Å
BC distance = 0.745 ± 0.002 Å
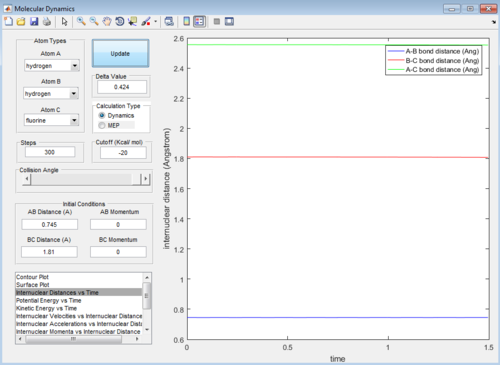
Note that the deviation of position is obtained from the fluactuations of internuclear distance in animation mode
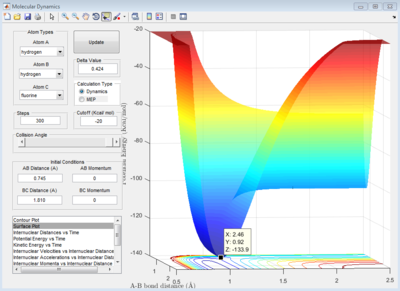
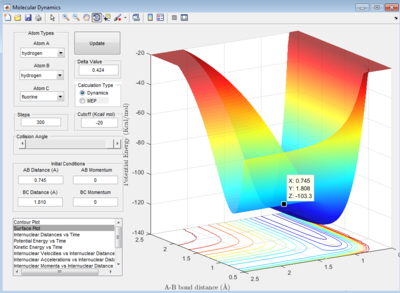
HF + H -> H2 + F system
Let HF = B-C and H = A, best approximated position for TS:
AB distance = 0.745 ± 0.002 Å
BC distance = 1.810 ± 0.002 Å
Activation Energy calculation
As the activation energy of one of the reaction (H2 + F) is very small, Hammond's postulate is used to ease the calculation of activation energy.
Hammond’s postulate states that the transition state of a reaction resembles either the reactants or the products, to whichever it is closer in energy.
In an exothermic reaction, the transition state is closer in energy to the reactants than to the products. Therefore, the transition state resembles the reactants.
In an endothermic reaction, the transition state is closer in energy to the products than to the reactants. Therefore, the transition state resembles the products.
Reaction Dynamic
Energy conversion in H2 + F system
In light of the fact that energy is conserved, discuss the mechanism of release of the reaction energy. How could this be confirmed experimentally?
The principle of conservation of energy states that the total energy of an isolated system remains constant or conserved over time. The energy transforms from one form to another and it can neither be created nor destroyed.[5]
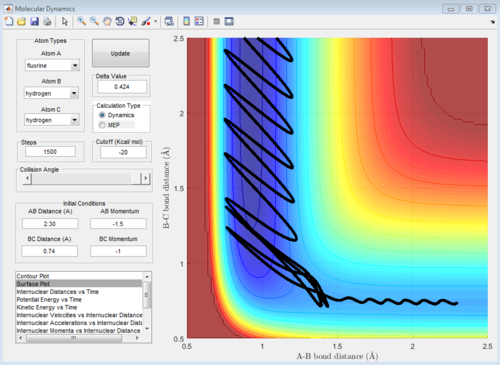
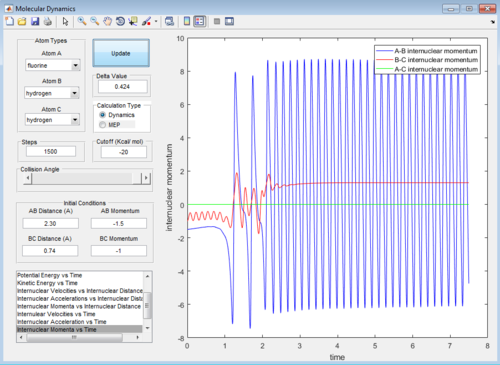
H2 + F -> HF + H is an exothermic reaction which involves heat release upon product generation. The heat energy change (ΔQ) of the system can be determine by measuring the change in temperature using instrument such as thermometer, thermocouples or thermistors. The temperature change can be used to calculate the heat energy released using the equation:
                                                           ΔQ = mc(ΔT)
            where Q = heat energy (J), m = mass of reactants (kg), ΔT = change in temperature before and after the reaction (°C)
In figure 23, the momentum of H-H oscillate within a small amplitude and stay constant after certain period of time while the momentum of H-F stay constant and oscillate in a relatively larger amplitude after the same time period. In figure 22, there is also a relatively large increase in extend of oscillation arose from the H-F bond vibration in exit valley when compared to entrance valley.
By assuming that the reaction is carried out in a closed system , the heat energy released is reabsorbed back into the system and stored as potential or vibrational energy in H-F molecule. In other words, the heat energy is used to excite the bond vibration of H-F to a higher vibrational state. In order to justify this deduction, the change in vibrational energy can be measured by infrared spectroscopy or infrared chemiluminescence technique. Infared chemiluminescence is a technique to measure and analyse weak infrared emissions from the product molecules with excited vibrational states as a result of storing of excess energy.[6] So, the excited H-F molecule will decay with emission of infrared radiation upon infared irradiation.
Reaction Efficiency: The Application of Polanyi's rule
The cases studied are an illustration of Polanyi's empirical rules. Discuss how the distribution of energy between different modes (translation and vibration) affect the efficiency of the reaction, and how this is influenced by the position of the transition state.
Polanyi's Rule describes how the energy requirement and the energy disposal in a direct atom + diatomic molecule chemical reaction are influenced by the barrier location.[7] .
For an exothermic A + BC reaction, the reaction has an early transition state with the energy of transition state closer to reactant. Hence, there is an early barrier which is generally located in the entrance valley of the reaction. Polanyi's rule states that the translational energy of reactant is more effective than vibrational energy to overcome the early barrier in an exothermic reaction reaction. Therefore, a reactant state of high translational energy will accelerate the reaction rate. Also, the rule explains that the total available energy will then be deposited mostly into product vibration for an early-barrier reaction by applying the principle of microscopic reversibility.
For an endothermic A + BC reaction, the reaction has a late transition state with the energy of transition state closer to product. Thus, the late barrier is usually located at the exit valley of reaction. Polanyi's rule states that vibrational energy is more efficient in promoting a late-barrier reaction than translational energy[8] . Regarding to the principle of microscopic reversibility, a translationally hot product will be produced from a late-barrier reaction.
Case Study 1: H2 + F -> HF + H
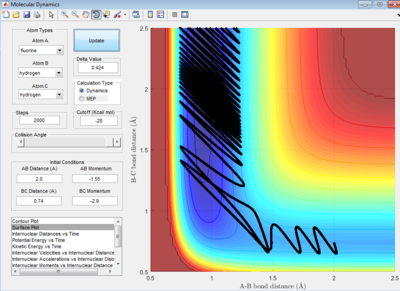
The reaction in figure 24 is exothermic as calculated in part 1.2.1.1 (table 2). The case study for this exothermic reaction is reactive at the initial condition:
r1= 0.74 Å and r2= 2.0 Å
p1= -2.90 Ns and p2= -1.55 Ns.
The initial energy distribution is mainly vibrational and this is depicted by the wavy line in the entrance valley. The vibrational energy is sourced from the H-H bond stretch. According to the Polanyi's rule, the vibrational energy is not efficient to surmount the early barrier of this reaction. Hence, the reaction is classified as inefficient although the reaction worked.
Case Study 2: HF + H -> H2 + F
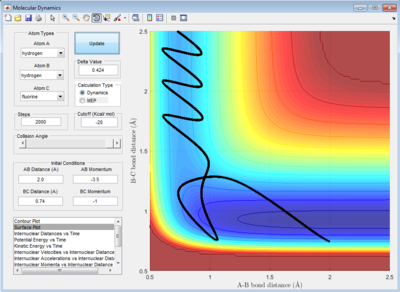
The reaction in figure 25 is endothermic and the reaction works at the initial condition:
r1= 0.74 Å and r2= 2.0 Å
p1= -1.0 Ns and p2= -3.5 Ns.
The initial energy distribution is mainly translational provided by the high initial total momentum of the reactants. By referring to the Polanyi's rule, the late barrier should be overcome more efficiently by vibrational energy. In figure 27, the initial energy distribution is mostly translational and transition state is crossed for two times.Thus, the reaction is said to be inefficient.
(A nice report overall. In this section it would have been preferable to start your systems from a distance of 2.5 rather than 2.0. A reaction would not begin with the system so near to the transition state. Perhaps this would change the outcome of your observations. Note that the efficiency of the reaction is not related to the number of times the barrier is recrossed by a trajectory. Rather if you had a set of trajectories with high vibrational energy and low translational energy a greater proportion of those trajectories would result in successful reactions than if you had a set of trajectories with high translation and low vibration energy, assuming a late transition state. Lt912 (talk) 02:14, 26 May 2017 (BST))
References
- ↑ Laidler, K.J. and King, M.C., 1983. Development of transition-state theory. The Journal of physical chemistry, 87(15), pp.2657-2664.
- ↑ John W. Moore, Ralph G. Pearson, ''Kinetics and Mechanism'', Wiley-Interscience Publication, 1981, 5, 166-168
- ↑ Eyring, H., 1935. The activated complex in chemical reactions. The Journal of Chemical Physics, 3(2), pp.107-115.
- ↑ Richard Myers,''The Basics of Chemistry'',Greenwood Press, 1951, 3,79
- ↑ Richard Feynman (1972). The Feynman Lectures on Physics Vol 1. Addison Wesley, ISBN 978-0-201-02115-8.
- ↑ J. C. Polanyi, 1963. Infrared chemiluminescence. Journal of Quantitative Spectroscopy and Radiative Transfer, 3(4), pp.471-496.
- ↑ Yan. S, Wu. YT, Liu. K. 2008. Tracking the Energy Flow along the Reaction Path. PNAS, 105 (35), pp. 12667-12672
- ↑ Polanyi, J. C. 1972. Concepts in reaction dynamics. Accounts of Chemical Research, 5, pp. 161−168.


