MRD:lp2015
Molecular Reaction Dynamics
Dynamics from The Transition State Region
The total gradient of the potential surface energy at a minimum and at a transition state is zero. This is due to both points having a first order derivative of zero. As the maximum of the potential surface energy is defined as the transition state, the second order derivative for the transition state would be negative, due to the potential energy falling from the maximum. On the other hand, the minimum of the potential surface energy would have a positive second order derivative, as the potential energy increases from the minimum.
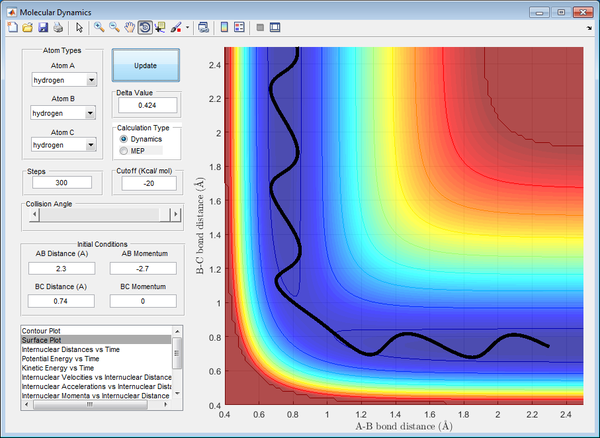
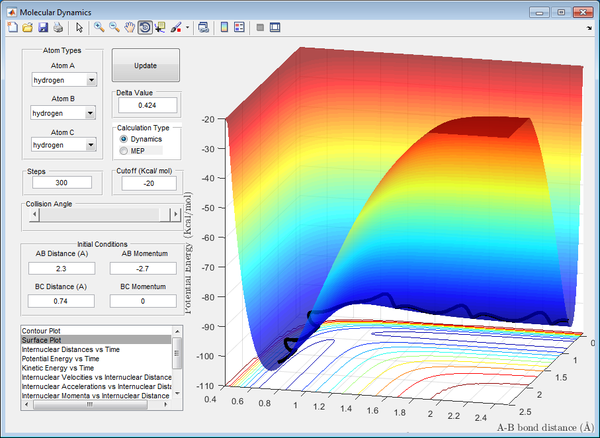
Transition State Position (rts)
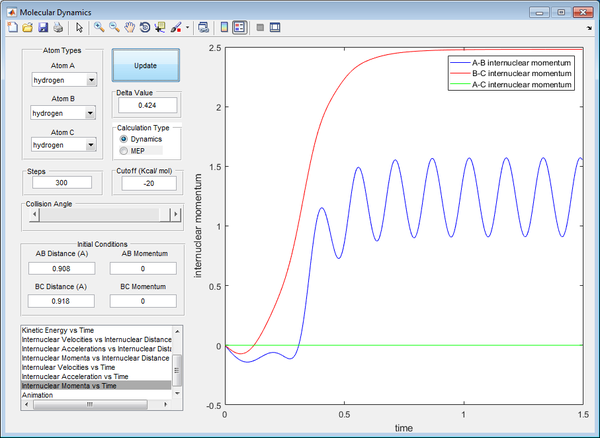
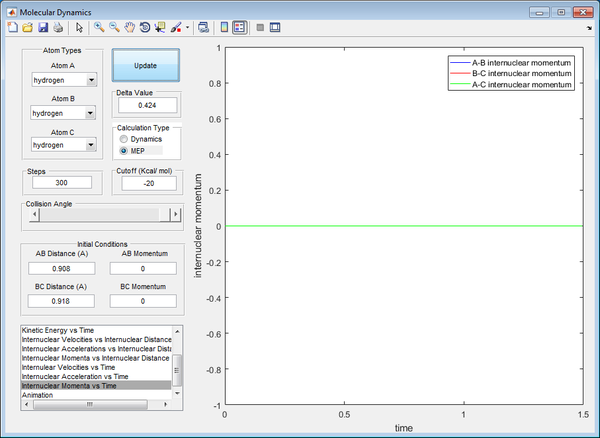
Best estimate of the transition state position (rts): 0.908 Å
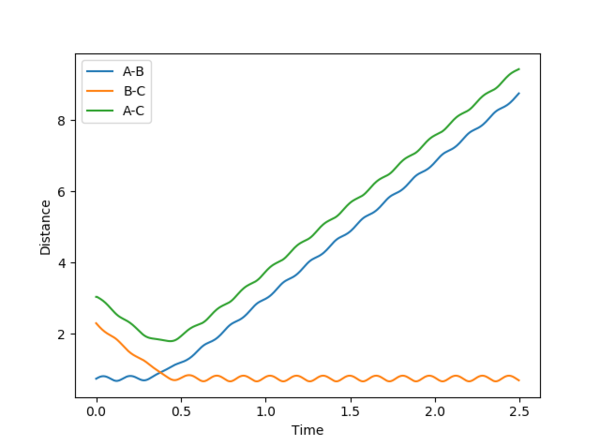
At that distance, the internuclear distance between B and C is constant from the inter-nuclear distance vs time plot, illustrated by a straight line of zero gradient. This signifies that the system possesses the maximum potential energy possible at that distance, with no vibrations present between the atoms. This number was obtained through trial-and-error, observing the internuclear distance against time graph until the minima and maxima of the graph converge to a constant number. It also depicts that the AB bond is just about to form as the BC bond is just about to break at that distance, forming the basis of the transition state.
Trajectories from r1 = rts+δ, r2 = rts
For MEP, a smaller range is covered (transition state), hence no vibrations were recorded. However for dynamics, a larger range is covered, so the is a variation of internuclear distance against time due to vibrations of the atoms.


Reactive and Unreactive Trajectories
| p1 | p2 | Trajectories |
|---|---|---|
| -1.25 | -2.5 | Reactive |
| -1.5 | -2.0 | Unreactive |
| -1.5 | -2.5 | Reactive |
| -2.5 | -5.0 | Unreactive |
| -2.5 | -5.2 | Reactive |
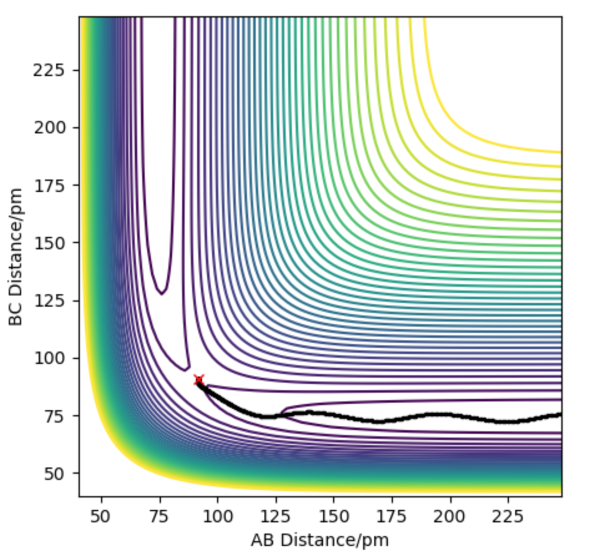
The AB bond is formed as the distance AB gets closer until a certain value, whilst the BC bond is broken, resulting in hydrogen atom C moving further away from B. This signifies a reactive trajectory, with a bond formed and a bond broken permanently. It also shows that a transition state for reaction has been achieved at the point where bond length AB is equivalent of that of bond length BC. There is sufficient energy to overcome the activation energy to break the BC bond.

The transition state for reaction has not been achieved, as from this graph, the bond length of BC is never equivalent to bond length of AB. The BC bond length remains relatively constant, and always lower than that of AB. Hence, this is an unreactive trajectory, with no reaction resulting in bonds forming or breaking. There is insufficient energy to overcome the activation energy to break the BC bond.
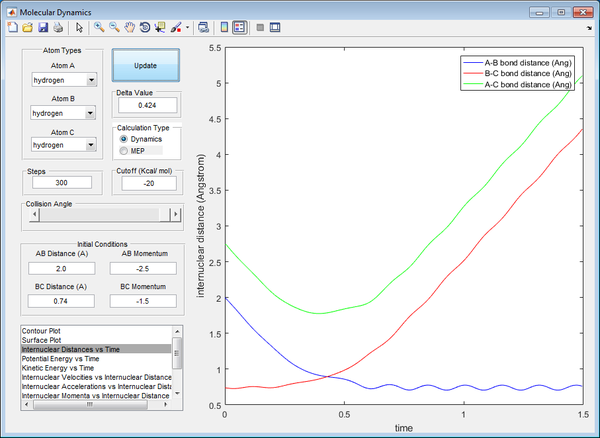
The AB bond is formed as the distance AB gets closer until a certain value, whilst the BC bond is broken, resulting in hydrogen atom C moving further away from B. This signifies a reactive trajectory, with a bond formed and a bond broken permanently. It also shows that a transition state for reaction has been achieved at the point where bond length AB is equivalent of that of bond length BC. There is sufficient energy to overcome the activation energy to break the BC bond.
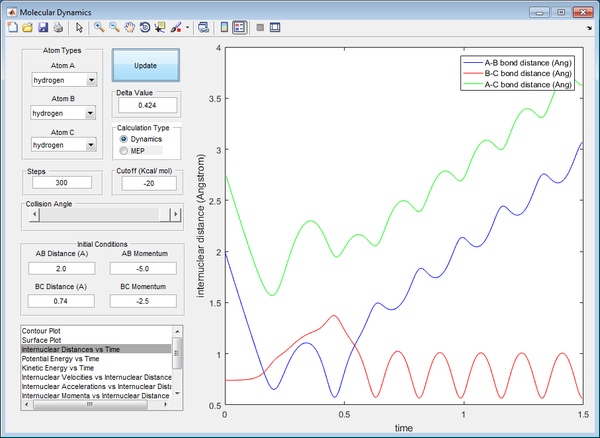
In this graph, this is a case of barrier recrossing. Although the transition state has been achieved and the BC bond breaks whilst the AB bond forms, the system reverts back to the reactant state. Overall, the BC bond is reformed and remains unchanged (albeit with some vibrations along the bond due to excess energy from collision), whereas the AB bond was briefly formed then broken again. This results in no net bond forming or breaking, leading to an unreactive trajectory. There is sufficient energy to break the bond initially, but there was also sufficient energy remaining to revert back to the original state, as illustrated by the curves of both bond lengths crossing twice, going back to their original state.
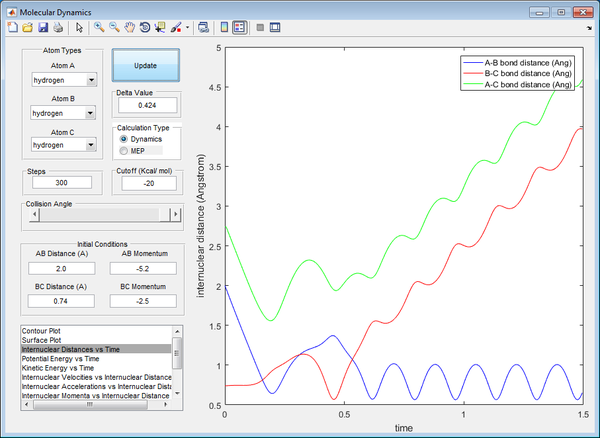
In this graph, this is a case of barrier recrossing, however there is sufficient energy to form products, then forming back reactants, then forming products again as the final result, illustrated by both graphs crossing each other thrice. The transition state has been achieved thrice, forming and breaking bonds, with the final result showing net bond breaking of BC and net bond forming of AB. Hence, this is a reactive trajectory.
Transition State Theory (TST)
Main Assumptions
1. The atomic nuclei in the system obeys classical mechanics.
2. Once the reaction crosses the transition state to form products from reactants, it does not recross again to form back reactants in the same system.
3. Each transition state intermediate has a long enough lifespan to possess a Boltzmann distribution of energies before forming products.
Comparing to the trajectories in the table above, Transition State Theory (TST) would be able to theoretically predict the reaction rate of the first three trajectories similar to the experimental rates. However, for the last two trajectories, as Transition State Theory assumes that barrier recrossing does not occur, Transition State Theory would not be able to predict those reaction rates accurately to their experimental rates (theoretical reaction rates may be higher than experimental, as equilibrium is reached at a slower rate than predicted by Transition State Theory). Transition State Theory also would not be able to predict the reformation of reactants from products, especially in trajectory 4.
F - H - H System
Bond Energy
H-H: 436 kJ/mol
H-F: 568 kJ/mol
The bond energy of H-F is greater than of H-H. A positive change in enthalpy signifies heat energy being used up overall for the reaction to occur (endothermic); whereas a negative change in enthalpy signifies heat energy being dissipated to the surroundings during the reaction (exothermic).
F + H2 reaction: +568 kJ/mol - 436 kJ/mol = +132 kJ/mol (Endothermic)
H + HF reaction: +436 kJ/mol - 568 kJ/mol = -132 kJ/mol (Exothermic)
Transition State
At transition state:
H-H bond length: 0.745 Å
H-F bond length: 1.810 Å

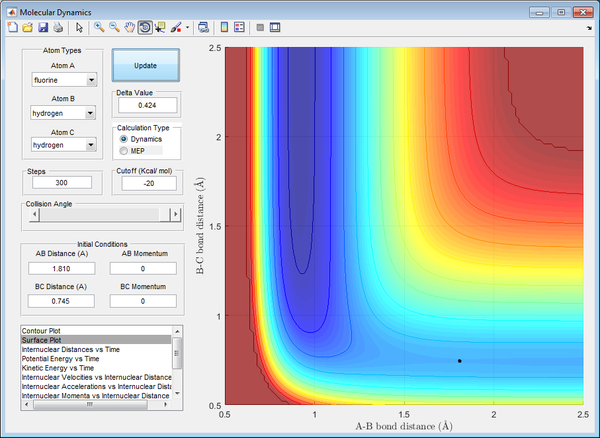
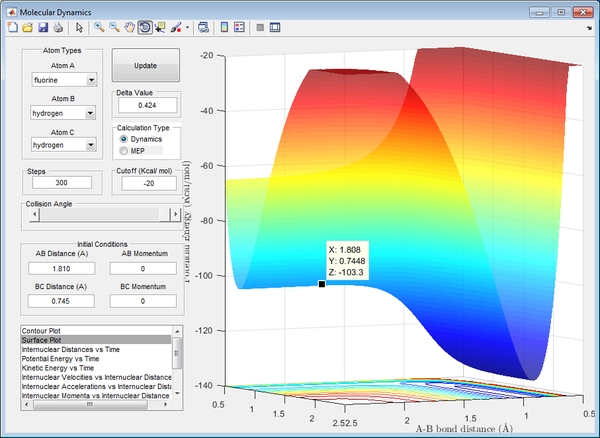
The bond length were found through trial-and-error, similar to the previous question, until the internuclear distances remain constant (minima and maxima converge at a constant value).
Activation Energy
F + H2 reaction: -103.3 kcal/mol - (-103.9 kcal/mol) = + 0.6 kcal/mol = + 2.510 kJ/mol (3 d.p.)
H + HF reaction: -103.3 kcal/mol - (-133.9 kcal/mol) = + 30.6 kcal/mol = + 30.6 kJ/mol (3 d.p.)
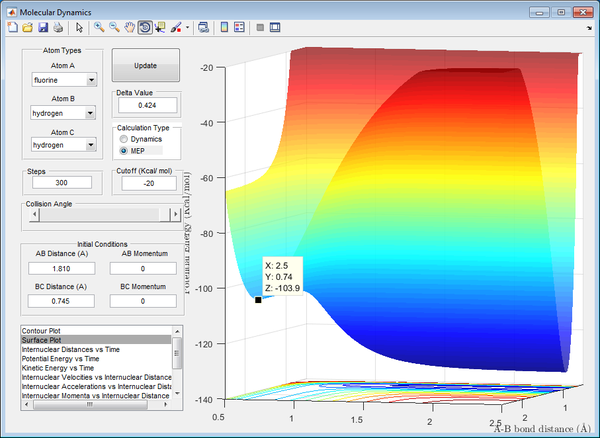


The activation energies of the reactions were found using the potential surface plot to identify the energies of the reactants and the transition state, with their differences giving the activation energies of the reactions.
Reaction Dynamics
As energy is conserved, the release of reaction energy from the F + H2 reaction may be in the form the kinetic energy of the radical H atom moving away from the H-F molecule. It could also be in the forms of heat and light energy released as the atoms drop from excited states to their ground states. In extreme cases, barrier recrossing may occur with reactants and products reforming, as illustrated in the pictures below. We would be able to confirm that experimentally by using a calorimeter to identify the heat energy lost during the reaction. Using a light detector and plotting a UV-Vis spectrum would also be able to identify the light energy emitted from the reaction. Measuring the experimental reaction rates and comparing it to the theoretical reaction state as predicted by Transition State Theory would also illustrate barrier recrossing that cannot be predicted by Transition State Theory.
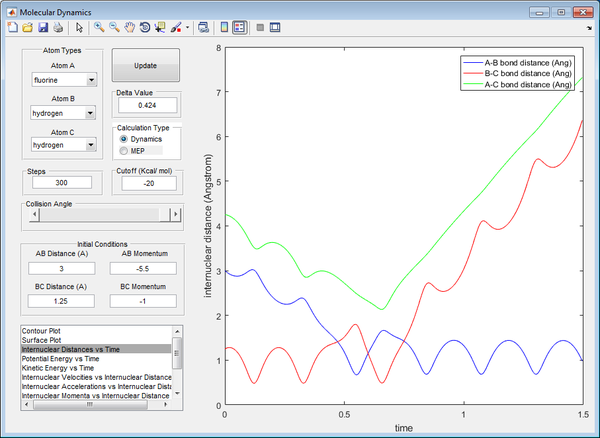
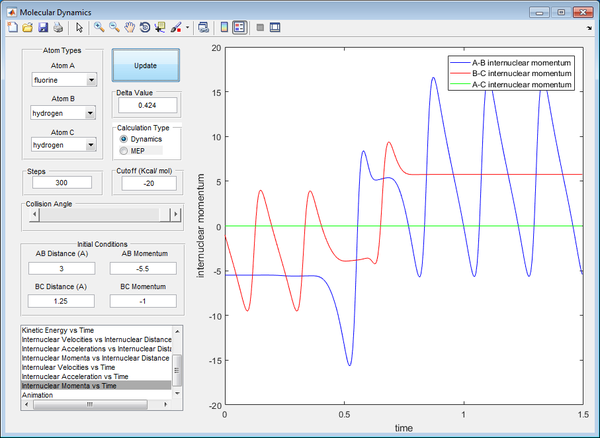
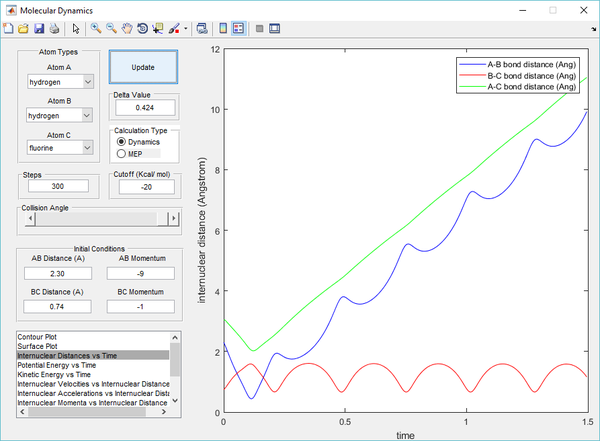
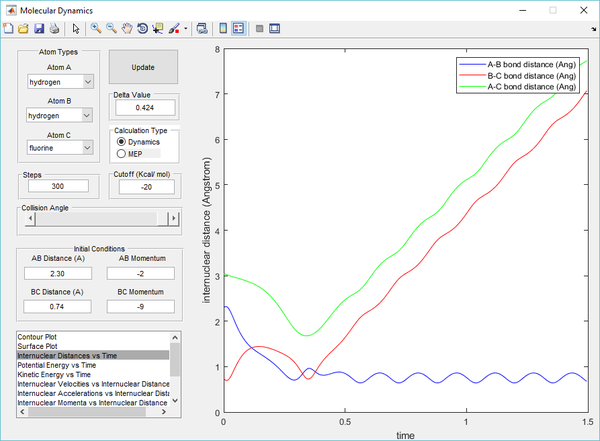
Polanyi's empirical rules state that vibrational energy is more efficient in promoting a late-barrier reaction than translational energy, this is supported by the presence of a reactive trajectory of the H + HF reaction by decreasing the kinetic energy of H atom (translational) whilst increasing the energy of vibration of the HF bond (vibrational). By increasing the vibrational energy, the transition state position (rts) has a longer bond length compared to previous calculations. The transition state also takes a longer time to be achieved, due to the low translational energy of the incoming H atom.
References
1. Universitat Autonoma de Barcalona - Unitat de Quimica Fisica (UAB) "Chemical kinetics: Transition state theory"
http://klingon.uab.es/prat/Thesis/node52.html
2. Eyring, H. (1935). "The Activated Complex in Chemical Reactions".
J. Chem. Phys. 3 (2): 107–115. doi:10.1063/1.1749604.
3. Masel, R. (1996). Principles of Adsorption and Reactions on Solid Surfaces. New York: Wiley.
4. Pineda, J. R.; Schwartz, S. D. (2006).
  "Protein dynamics and catalysis: The problems of transition state theory and the subtlety of dynamic control".
  Phil. Trans. R. Soc. B. 361 (1472): 1433–1438. doi:10.1098/rstb.2006.1877. PMC 1647311Freely accessible. PMID 16873129.
5. University of Waterloo - Science "Bond Lengths and Energies"
http://www.science.uwaterloo.ca/~cchieh/cact/c120/bondel.html
6. Zhaojun Zhang, Yong Zhou, and Dong H. Zhang, Theoretical Study of the Validity of the Polanyi Rules for the Late-Barrier Cl + CHD3 Reaction
http://pubs.acs.org/doi/abs/10.1021/jz301649w
