MRD:lp1916
Exercise one
Question 1
Q: What value do the different components of the gradient of the potential energy surface have at a minimum and at a transition structure? Briefly explain how minima and transition structures can be distinguished using the curvature of the potential energy surface.
Answer:
First of all, let r1 be the distance between HA-HB where HC is approaching with an initial momentum, and r2 be the distance between HB-HC where HA has left. The gradient of potential energy is comprised of two components which are the partial derivative of r1, = Vr1, and the partial derivative of r2, = Vr2, respectively in a 3D space. At minimum trajectory , both components equal ZERO. Whereas for the transition structure(i.e. saddle point), which is defined as the local maximum point ON THE MINIMA PATH (i.e. maximum point on total energy curve but minimum point on potential energy curve), both components equal ZERO as well. As the values for different component of potential energy cannot be used as a reference to distinguish between minima and transition structure, curvature can be used. Curvature can be approximated to be the secondary partial derivatives of both r1 and r2. For the minima, Vr1r1 is greater than zero while the determinant (curvature), Vr1r1•Vr2r2 - V2r1r2, is greater than zero as well. However for the saddle point, the determinant is less than zero. That is, at a saddle point, the secondary derivative of one component is positive and the other one is negative i.e. Vr1r1 > 0 and Vr2r2 < 0
Question 2
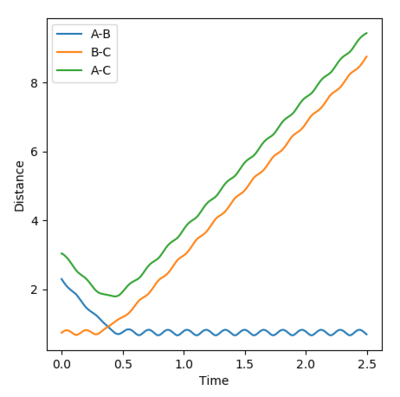
Q: Report your best estimate of the transition state position (rts) and explain your reasoning illustrating it with a “Internuclear Distances vs Time” plot for a relevant trajectory.
Answer:
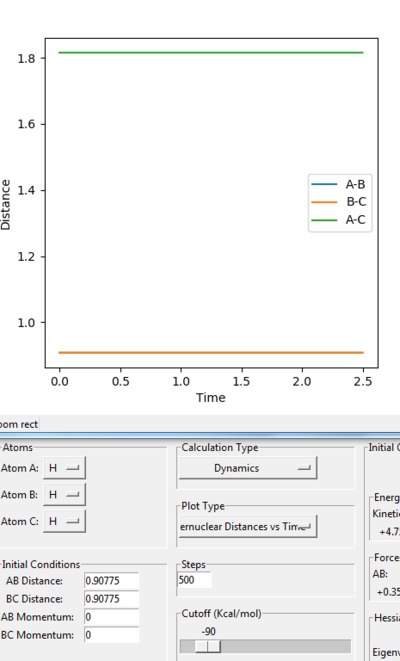
• Transition state position: 0.90775 Å
 |
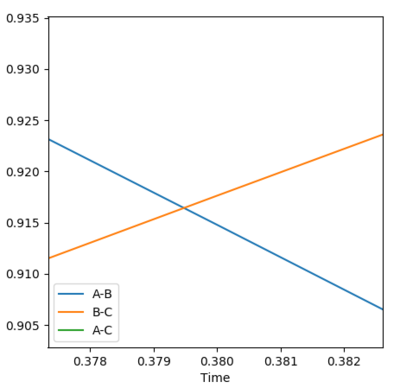 |
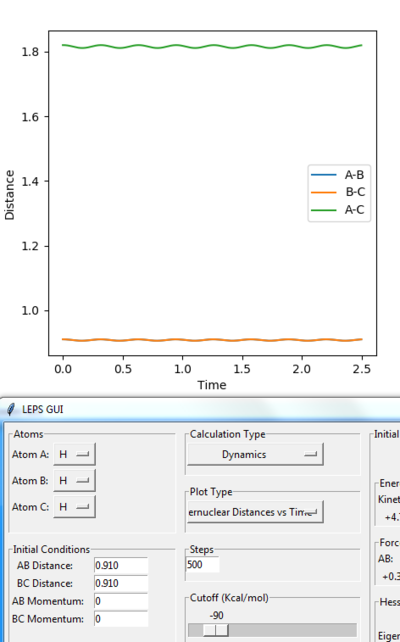
• Reasoning: According to Figure 1 and 2, the curve showing the distance between HA and HB crosses the one showing the distance between HB and HC. The interception point represents the transition state where the distances of HA-HB and HB-HC equal and the y-axis therefore can be used as a reference in determining the position of transition state. Therefore, according to Figure 3, by setting the initial momenta as zero, the triatomic structure should remain stationary (if the atoms are indeed staying on TS positions) and there should not be any oscillation of distances between HA-HB and HB-HC. By approximating different values of the distances between HA and HB, two straight lines has shown up in the D vs. t plot (Figure 4) which indicate the absence of oscillation and thereby proves that this approximated distance is indeed where the transition state locates.
 |
 |
Jas213 (talk) 19:41, 28 May 2018 (BST) Good illustration of your working.
Question 3
Q: Comment on how the mep and the trajectory you just calculated differ.
Answer:
 |
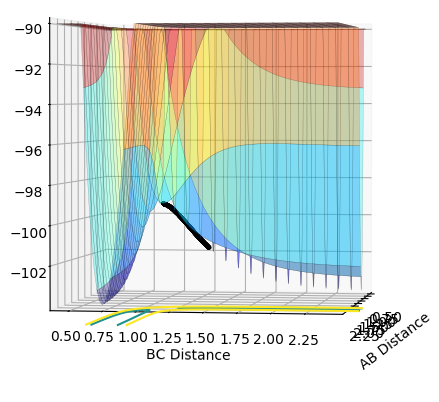 |
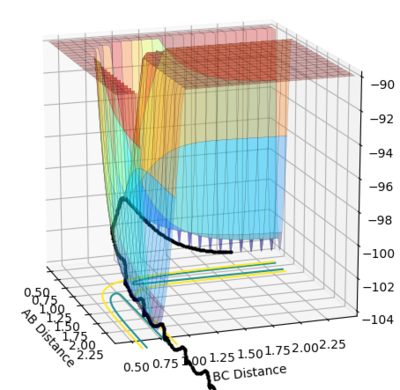
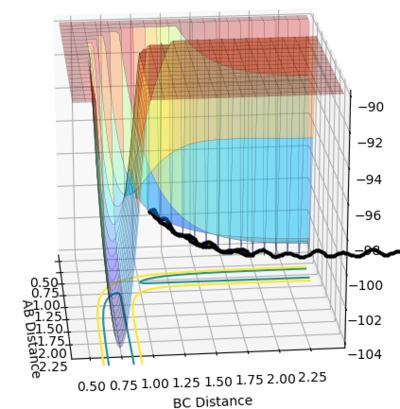
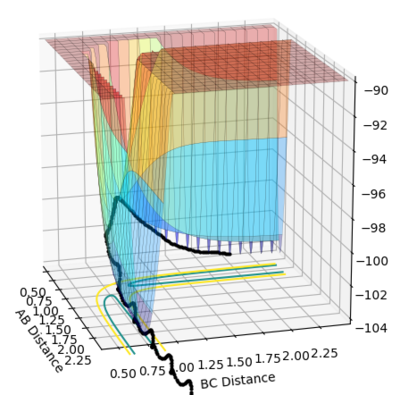
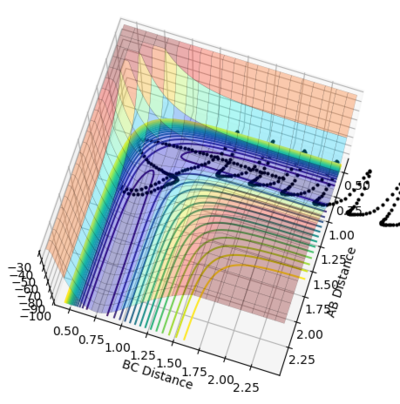
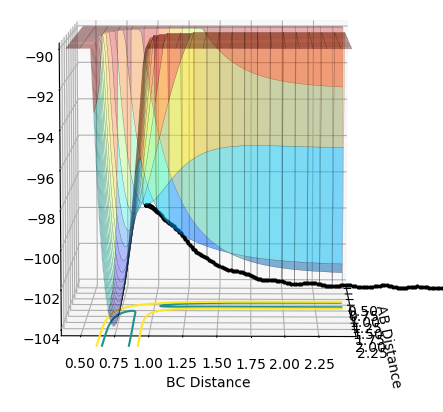
As shown in Figure 5 and 6, mep follows the lowest energy path and gives a smooth, linear trajectory without any observable oscillations. The Dynamics method, however, shows the real reaction pathway which includes the diatomic vibration and there are visible oscillations in atomic distances. Also, mep has a very short trajectory from the middle of an axis to the saddle point while Dynamics has a much longer trajectory that extended beyond the coordination system when using 553 steps. This is because that the mep method calculate the motion of atoms in tiny fractions. The momentum of molecules are reset to zero for the start of each tiny fraction along the trajectory. This makes the conversion of potential energy to kinetics energy useless. Therefore it would take much more steps to have enough energy to have a full trajectory. Therefore the path under MEP would be shorter given same number of steps as Dynamics.
Jas213 (talk) 19:43, 28 May 2018 (BST) Very clear and I like that you also stated the number of steps used!!
Question 4
Q: Complete the table by adding a column with the total energy, and another column reporting if the trajectory is reactive or unreactive. For each set of initial conditions, provide a plot of the trajectory and a small description for what happens along the trajectory. Jas213 (talk) 19:43, 28 May 2018 (BST) What were your initial conditions used? What are you trying to do? Don't just copy the question, write an actual report.
A:
Jas213 (talk) 19:46, 28 May 2018 (BST) "This proves that the initial conditions could enable a reaction to occur." Is very meaningless and repetitive, you already say reactive or unreactive in a different column. Instead you should have commented on the distribution of kinetic energy into translational and vibrational energy. An overall concluding comment of what you learnt from this table would have been expected.
Question 5
Q: State what are the main assumptions of Transition State Theory (TST). Given the results you have obtained, how will Transition State Theory predictions for reaction rate values compare with experimental values?
A:
Main Assumptions[1]
1. The reactants (or products) are in equilibrium with the activated complex.
2. Quantum-tunneling effects are negligible and the Born-Oppenheimer approximation is invoked.
3. Once the system attains the transition state, with a velocity towards the product configuration, it will not reenter the initial state region again.
Analysis
According to the attempts shown above (especially set 4 and set 5), the reaction trajectory could recross back to reactants side even if it has reached T.S. TST, however, states that the reaction pathway will not reenter the reactants side after reaching the transition state. Therefore, the real rate of reaction should be lower than the theoretical value since many reactions will not actually take place.
According to TST, no quantum-tunneling would occur. However, in real experiments, it is possible that particles (especially those that has light weight[2]) can still tunnel across the potential energy barrier with a much lower activation energy. The energy of atoms that tunnel through the barrier would decrease exponentially. Therefore the actual energy of those atoms may not be as high as the theory. Therefore theoretic predictions for reaction rate would be higher than the actual values.
Exercise two
Question 6
Q: Classify the F + H2 and H + HF reactions according to their energetics (endothermic or exothermic). How does this relate to the bond strength of the chemical species involved?
A:
Classification
• F + H2 scenario:
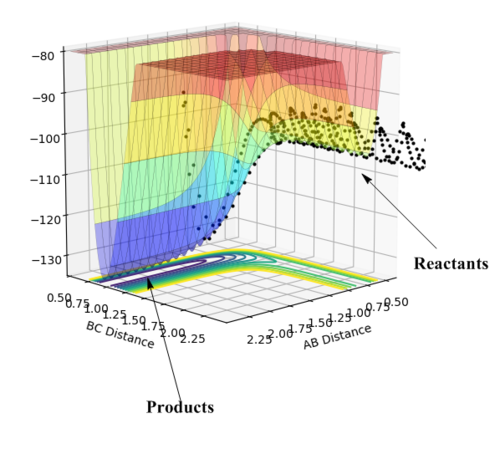
According to Figure 12, the potential energy (minima pathway) that reactants (H2 and F) possess are greater than the energy that products possess (HF and H). Therefore, this specific process can be characterized as an exothermic reaction. (i.e. energy level of reactants > energy level of products, energy has been released as a form of heat during the process ==> exothermic)
• H + HF scenario:
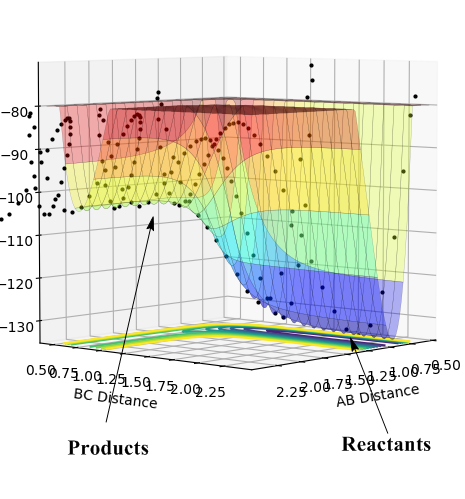
According to Figure 13, the potential energy (minima pathway) that reactants (HF and H) possess are less than the energy that products possess (H2 and F). Therefore, this process can be characterized as an endothermic reaction. (i.e. energy level of reactants < energy level of products, extra amount of energy is required to during the process ==> endothermic)
Further analysis on bond strength
• F + H2 scenario:
Since this is a exothermic process where heat has been given out during the reaction process, the energy required to break the hydrogen-hydrogen bond is less than the energy released from the formation of hydrogen-fluorine bond. This proves that the bond enthalpy of H-F is greater than that of H-H.
• H + HF scenario:
Since this is an endothermic process where heat from surroundings has been consumed during the reaction process, the energy required to break the strong hydrogen-fluorine is greater than the energy released from the formation of hydrogen-hydrogen bond. This proves that the bond enthalpy of H-F is greater than that of H-H.
Both scenarios are in good accordance with the literature values of bond enthalpies of H-F and H-H which equal 565 kJ/mol and 432 kJ/mol respectively.
Question 7
Q: Locate the approximate position of the transition state.
A:
• F approaching H-H scenario:
According to Hammond's postulate, the geometric structure of the transition state can be resembled by the geometric structure of the species neighboring it and has closest energy to it along the reaction coordinate. Since this is an exothermic process, the energy difference between the transition state and reactants is the smallest and the TS would show the geometric structure similar to that of reactants as represented in Figure 14.
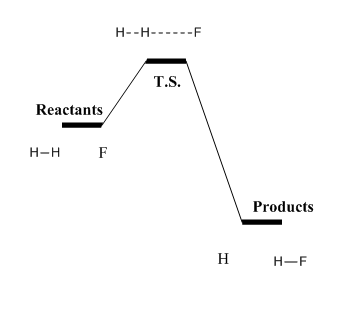
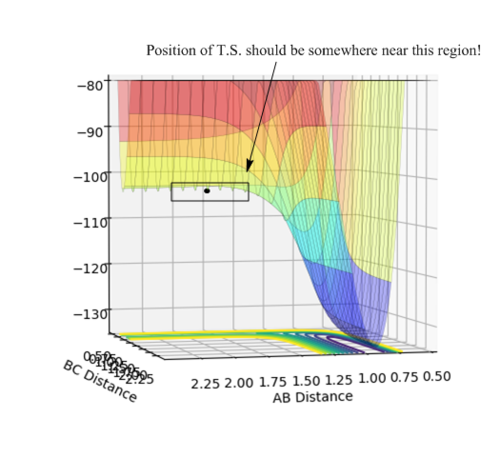
The position of transition state can therefore be approximated more efficiently, as shown in Figure 15. It is easier to first make sure that the position of transition state is on the reactant side and easily obtain the distance between the two hydrogen atoms --- around 0.75.
Then by trying different values in the selected range, a set of coordinates has been determined that the distances between both H-H and H-F are stable with time (i.e. three straight lines are observed in the plot of Internuclear Distances vs. Time). This indicates that a T.S. position has been found, as shown in Figure 16.
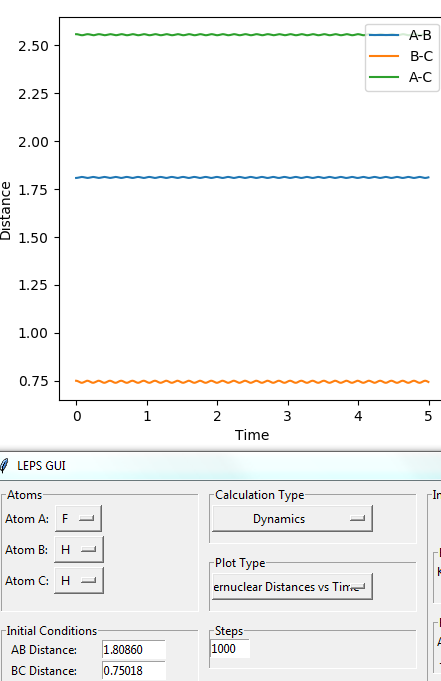
Therefore, The position of T.S. is given as:
- dHF=1.80860 Å, dHH= 0.75018 Å
• H approaching H-F scenario:
The same postulate applies as well. As this is an endothermic process, the geometric structure of T.S. would be similar to that of products as represented in Figure .
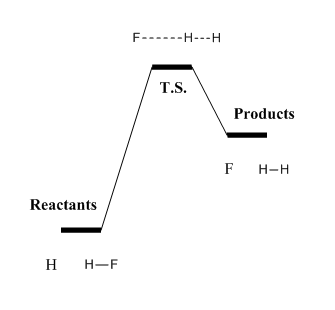
Similarly as above, the approximated position of T.S. can be found in the region near the products side, as shown in Figure 18.
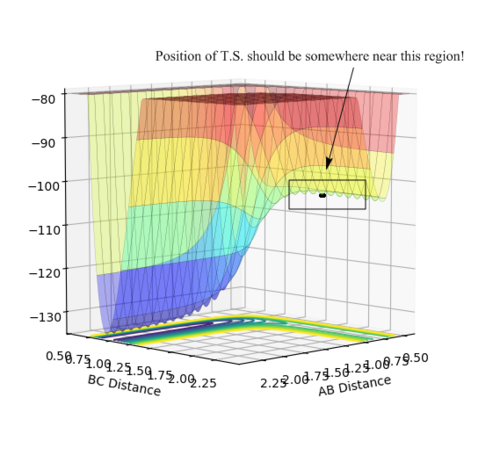
Then by trying different values in the selected range, a set of coordinates has been determined that the distances between both H-H and H-F are stable with time (i.e. three straight lines are observed in the plot of Internuclear Distances VS. Time). This indicates that a T.S. position has been found, as shown in Figure 19.
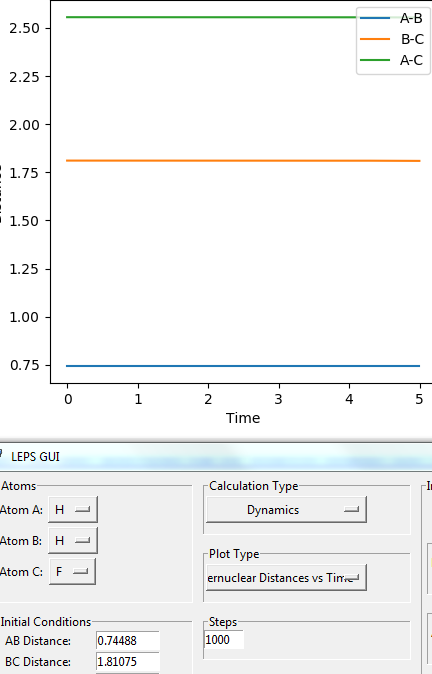
Therefore, The position of T.S. is given as:
- dHH=0.74488 Å, dHF=1.81075 Å
Jas213 (talk) 19:50, 28 May 2018 (BST) Loved the first half of your reply looking at one direction of the trajectory. Such a beautiful reply with clear illustration of working and assumptions used etc. However, then you found another TS even though going either way you should have found the same TS, since the PES does not change, no matter which way round you look at it.
Question 8
Q: Report the activation energy for both reactions.
A:
The activation energies can be calculated using the more accurate method of MEP. According to the Hammond's postulate, the activation energy can be approximated by placing the triatomic system a little deviated from the transition state postion (towards the REACTANT side) and setting the momenta as zero. This way the reactants should automatically drop back from near transition state to reactants side ground state and therefore the difference in energies should give the activation energy.
F approaching H2 scenario
The distance between H and F atoms has been altered to be 0.01 Å away from transition state position and graphs of PES and Energy vs. Time have been ploted in order to find the activation energy. The initial parameters are given in Figure 20.
 |
 |
By subtracting the initial and final energies on the Energy vs. Time plot, an approximated activation energy can be obtained, as shown in Figure 22.
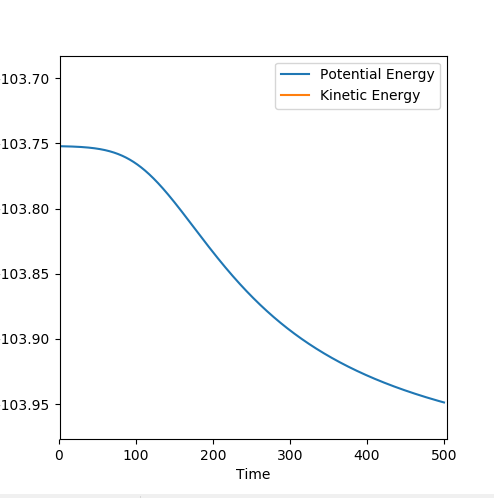
H approaching HF scenario
The distance between H and F atoms has been altered to be 0.01 Å away from transition state position and graphs of PES and Energy vs. Time have been plotted in order to find the activation energy. The initial parameters are given in Figure 23.
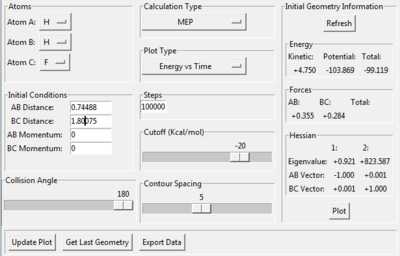 |
 |
By subtracting the initial and final energies on the Energy vs. Time plot, an approximated activation energy can be obtained, as shown in Figure 25.

Energy calculation
| Scenario | Potential Energy at T.S./kJ•mol-1 | Potential Energy at Ground State/kJ•mol-1 | Activation Energy (column 2 - column 3)/kJ•mol-1 |
|---|---|---|---|
| F and H-H | -103.742 | -103.948 | +0.206 |
| H and H-F | -103.630 | -133.901 | +30.271 |
Jas213 (talk) 19:52, 28 May 2018 (BST) The energies in the programme are in kcal/mol
Question 9
Q: In light of the fact that energy is conserved, discuss the mechanism of release of the reaction energy. How could this be confirmed experimentally?
A:
| FH distance | 1.5 |
| HH distance | 0.74 |
| FH momentum | -0.5 |
| HH momentum | 0 |
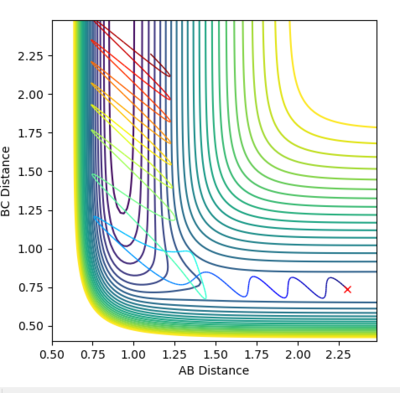
According to Figure 26, it is shown that the reaction trajectory falls to the products side and indicates that it is reactive.
 |
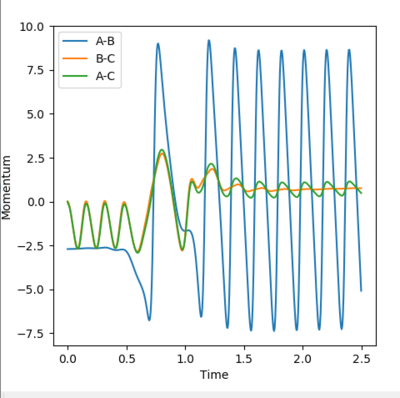 |
The translational energy of H-H is converted to vibrational energy and this can be proven by the fact that the vibration of the product is much stronger than that of the reactant (according to Figure 27, the dramatic increase in momentum proves a stronger oscillation). Since this is an exothermic process, the energy released is largely converted into the vibrational energy of the H-F molecule. This can be governed by the Momenta vs. Time plot where the oscillation has remained strong after collision. Then, some of the vibrational energy is converted to translational energy of the HF molecule.
Infra-red spectroscopy could be used to confirm the postulate since IR can measure the vibrations of bonds. A flow method can be employed where different stages of reaction are measured: at the start where all are purely reactants; in the middle of reaction pathway where some of the starting materials are converted into strongly oscillating H-F molecules; at the end of reaction where all are H-F molecules. The measurements should show great difference in wavenumbers as the greater the oscillation of bonds, the greater the value of wavenumbers.
Question 10
Q: Discuss how the distribution of energy between different modes (translation and vibration) affect the efficiency of the reaction, and how this is influenced by the position of the transition state.
A:
In a typical chemical reaction where an energy barrier is involved for a reaction to occur, there will always be a saddle point on reaction trajectory to be surmounted. According to Polanyi, the vibrational energy is more efficient in promoting a late-barrier reaction (i.e. a transition state resembling the products and is endothermic) than translational energy, and vice versa for an early barrier reaction which is exothermic[3].
The situation where F approaches H-H is an exothermic reaction that resembles reactant (as shown in Figure 28) and therefore has an early transition state. The rule thus predicts that the translational energy is the key to promote the reactive trajectory. Vibrational energy would provide enough energy for reaction pathway to get across the saddle point, but it is likely that the trajectory will reenter the reactants region and no reaction would occur.
The situation where H approaches H-F is an endothermic reaction that resembles product (as shown in Figure ) and therefore has a late transition state. The rule thus predicts that the vibrational energy is the key to promote the reactive trajectory. Translational energy, however is likely to cause more recrossing and no overall reaction would occur.
 |
 |
Jas213 (talk) 19:55, 28 May 2018 (BST) Weaker second exercise, only one trajectory shown/investigated. You stated Polanyi's rules but didn't discuss them in more detailed giving different sample trajectories. Overall very good scientific writing style!

