MRD:ll4915
Molecular Reaction Dynamics : Applications to Triatomic
Introduction
In this report the molar reaction dynamics is studied by discussing the reaction of a triatomic system. A atom A collide atom B (bonded with C) and from the new AB compound. The surface energy plot was plotted by using MATLAB. The trajectory of the path of the reaction, change in internuclear distance and change in potential energy vs time plot was used in analysis in order to discover the condition for the reaction to proceed.
H+H2 System
Dynamics from the transition state region
- The total gradient of the potential energy surface is zero at a minimum and at a transition structure. According to the definition: transition state is the maximum on the minimum energy path, the transition state in unstable equilibrium, thus the second derivative of potential energy against bond distance is smaller than zero. Whereas the minium of potential energy surface is in stable equilibrium, the second derivative of potential energy against bond distance is larger than zero.
Best transition state position (rts)
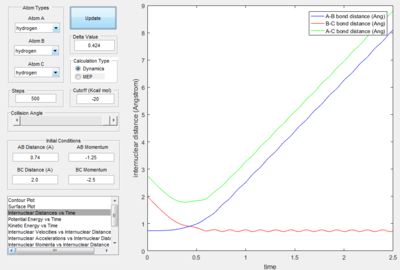
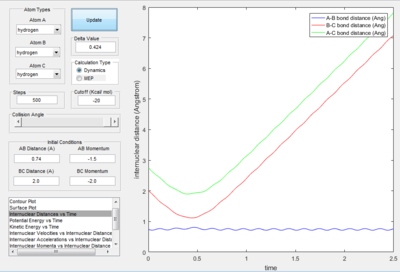
- As explained previously at transition state, the total gradient of the potential energy surface is zero. By plotting a surface plot with r1(0)=r2(1)=0.74 A (bond length of H-H bond), the maximum of minimum energy path gives the transition state distance: 0.9076 A. Internuclear Distance vs. time plot showed AC distance approximate to 1.8 A twice the BC bond distance Thus the bond distance between AB and BC dose not change. The system is in a transition state.
reaction path and calculation
r1=rts+0.01
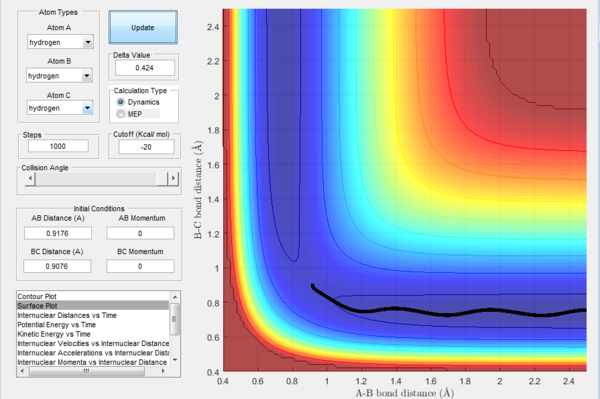

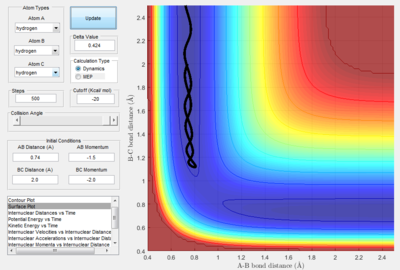
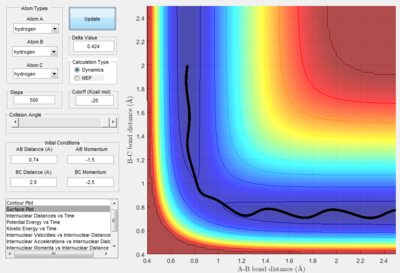
- The dynamics plots gives curved line it includes trasitional and vibrational motion as well as trajectory. This is because the dynamic mode calculation includes interaction between of one atom to another, which take the realistic situation into account. While the MEP mode showed the minimum path as a straight line,just trajectory no atom interaction motion was included in the line. This is because the MEP mode calculation,the velocity was always reset to zero in each time step.
r2=rts+0.01
- For the plot in dynamic mode, the r1 = rts+δ plot is symmetrical about y=x with r2=rts+0.01. This shows the same amount of change in energy with one is the transition from reactant to product and the other with transition from product to reactants.
Reactive and Unreactive Trajectories
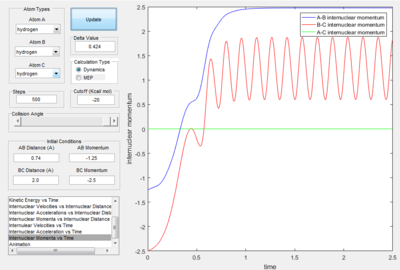
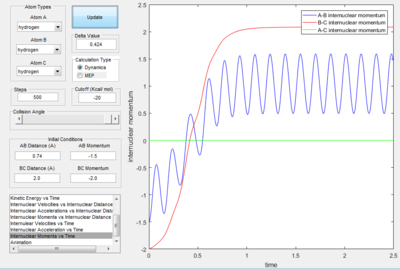
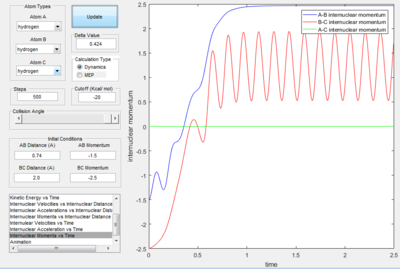
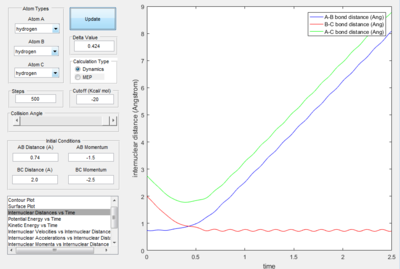
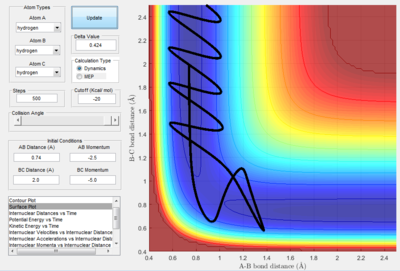
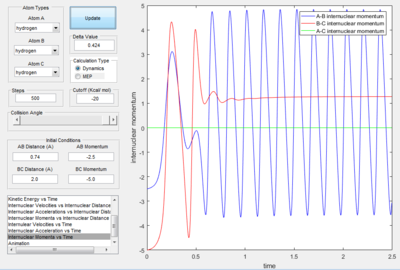
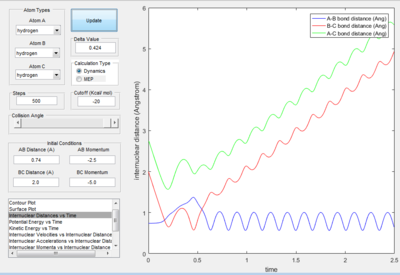
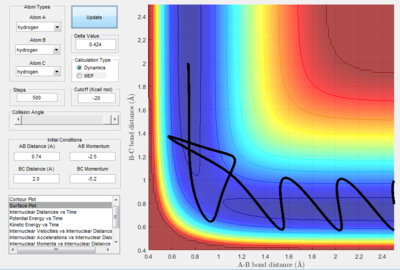
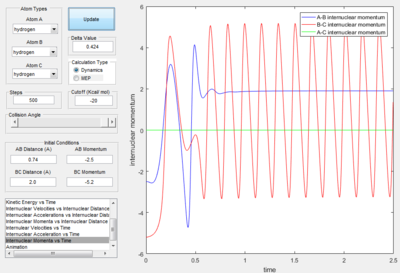
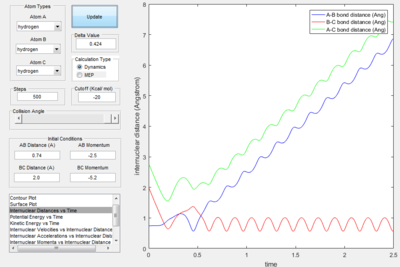
- Transition State Theory states that there is an equilibrium between the reactants and activated transition state complex, as once the system reaches the critical spatical configuration. it will proceed to generate the product.[1] However, in reaction 4, the momentum was big enough to form the products. So the critiacl spatical configuration was generated. Still the reaction was not proceed. This dose not support the transition state theory.
F - H - H system
In this section, instead of three identical atoms. F and H atoms will be involved in the collision.
Endothermic vs. Exothermic Reaction
 |
 |
 |
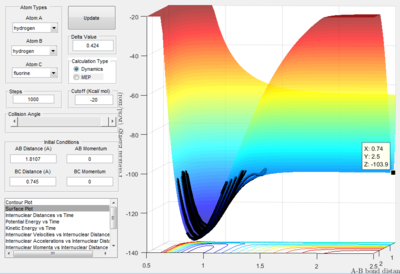 |
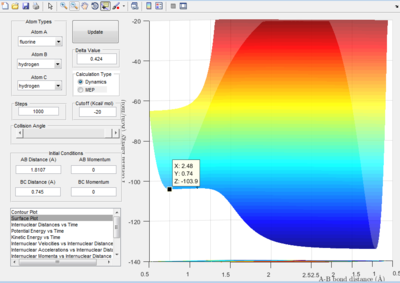
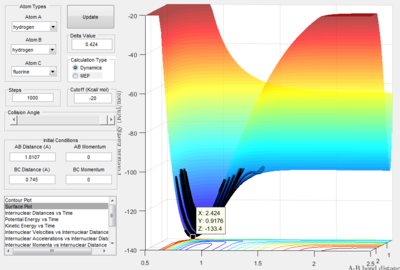
- By using the surface plot, the difference of potential energy between the reactant and product can be calculated, as the figure above illustrated. So the F+ H 2 reaction is exothermic , the potential energy of reactant is smaller than product. The H+HF reaction endothermic as the initial potential energy is larger than the final potential energy.
Transition State and Activation Energy
Position of Transition State
 |
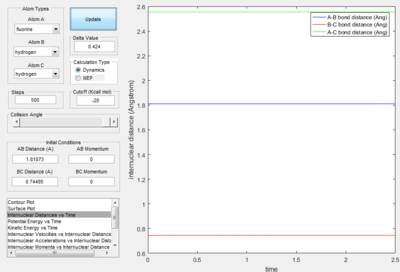 |
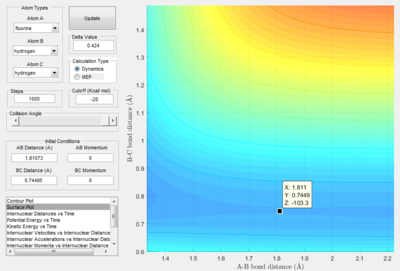
- The transition state is discovered at the position where the distance between H atoms as 0.74495 A and the distance between H and F as 1.81073 A. The HH distance is slightly longer than the HH bond distance (0.74) A.
Activation Energy
 |
 |
 |
 |
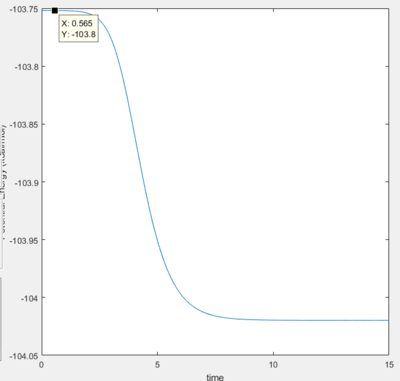
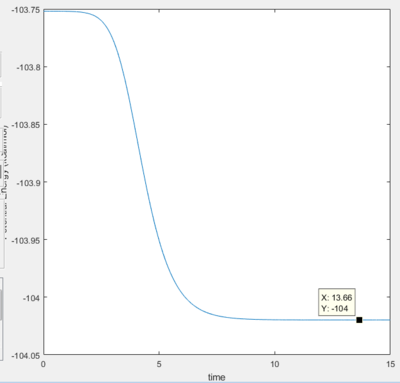
- Activation Energy of H + HF reaction is 0.2 kJ/mol
- Activation Energy of F + HH reaction is 30.1 kJ/ mol
Reaction Dynaimcs
Mechanism of of F+ H2
 |
 |
 |
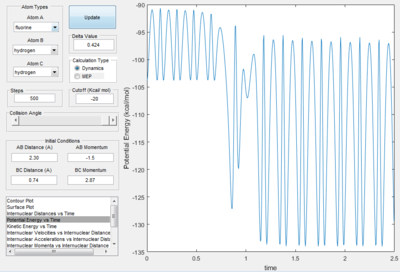 |
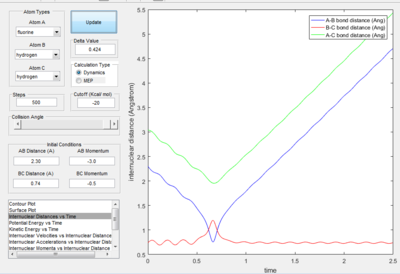
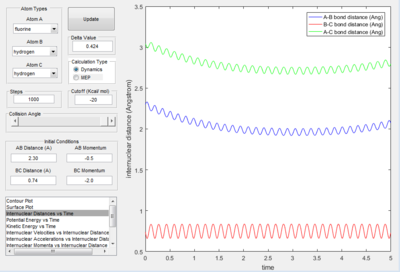
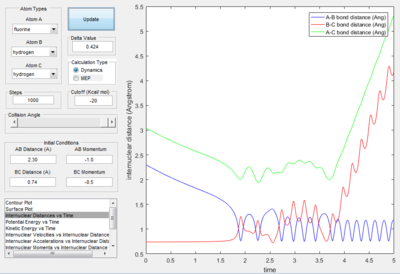
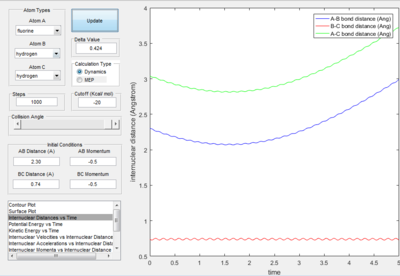
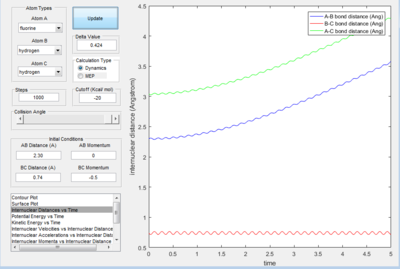
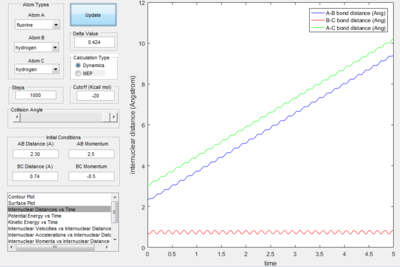
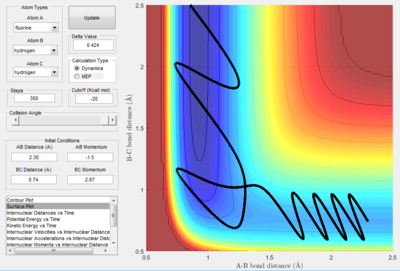
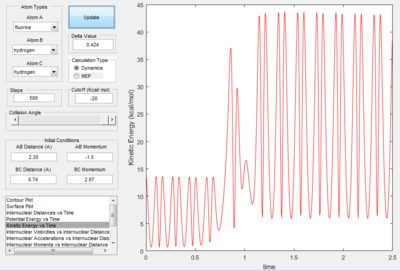
The condition of the reaction is summarised in the following chart
| r HH=0.74 A |
| r FH=2.30 A |
| p HH= -1.5 kgm/s |
| p FH= 2.87 kgm/s |
- The mechanism of the reaction is initially the F atom attack the H atom in the middle with generation of the break of H-H bond and forming of H-F bond.
- The energy is conserved in the reaction. So the energy of the system is converted from potential energy into kinetic energy. Before the reaction, the reactants vibrated small as both the kinetic energy vs. time plot and potential energy vs. time plot both fluctuated with small value. At the time the reaction was finished, the vibration in the potential energy vs. time graph increased with an increase in small value. The kinetic energy vs. time graph, the vibration of k.e. increase as the reaction proceeded, the value decreased. This is because the reaction is exothermic, so at the end of the reaction kinetic energy is converted into potential energy.
- IR or NMR is suggested as a method to check the end of the reaction. The vibration of HF bond is higher than HH bond.
Momentum and Trajectory
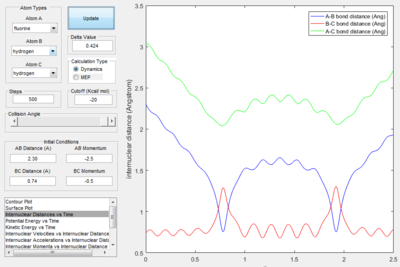
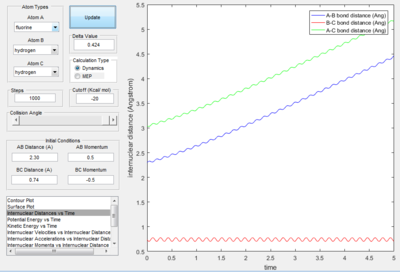
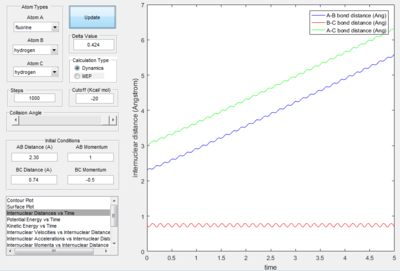
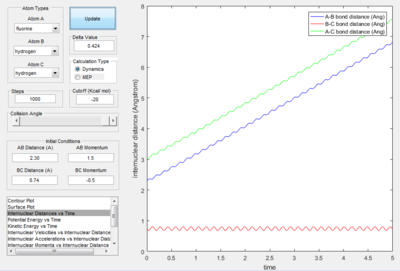
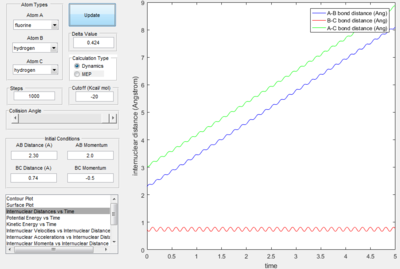
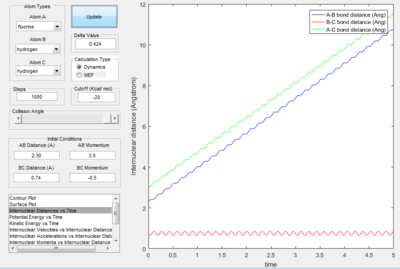
Only the one with pHF= -2.0 kgm/s is reactive, is showed that initial kinetic energy of the atoms is required to proceed the reaction.
H+HF reaction
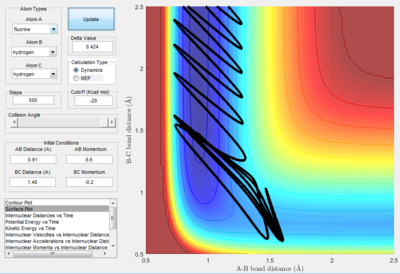
- Polyanyi's empirical rule generally state that the late barrier is more promoted by vibrational energy rather than translational energy.[2] In this experiment. only the H+HF reaction is endothermic thus, it as a late barrier. The reaction only proceed when the vibration was large enough. In the surface plot of reactive trajectory, the momentum of HF bond is much larger than the momentum of HH bond. Large momentum means large vibrational energy and thus supports the Polyanyi's Rules.
F+H2. reaction with early barrier, translational barrier is more promoted. The calculation supported this point the vibration increased at the end of the reaction. Thus the reaction trajectories obeys Polanyi's rule.
Reference
1. R. D. Levine Molecular Reaction Dynamics, Cambridge University Press, 2005 2. Guo, H., & Liu, K. (2016). Control of chemical reactivity by transition-state and beyond. Chem. Sci., 7(7), 3992–4003.


