MRD:lh1316
EXERCISE 1: H + H2 system
Dynamics from the transition state region
1.What value do the different components of the gradient of the potential energy surface have at a minimum and at a transition structure? Briefly explain how minimal and transition structures can be distinguished using the curvature of the potential energy surface.
The gradient of the potential energy surface(PES) at a minimum and at the transition structure(saddle point) are both zero. However, Second Partial Derivative test can be used to distinguish if a critical point of a function is a local minimum, maximum or saddle point. The Hessian matrix H of f is the 2 × 2 matrix of partial derivatives of f, if:
1. det(H(x,y))>0 and fxx(x,y)>0 then (x,y) is a local minimum of f
2. det(H(x,y))>0 and fxx(x,y)<0 then (x,y) is a local maximum of f
3. det(H(x,y))<0 then (x,y) is a saddle point of f
4. det(H(x,y))=0 then this test is inconclusive [1]
Trajectories from r1 = r2: locating the transition state
2.Report your best estimate of the transition state position (rts) and explain your reasoning illustrating it with a “Inter nuclear Distances vs Time” plot for a relevant trajectory.
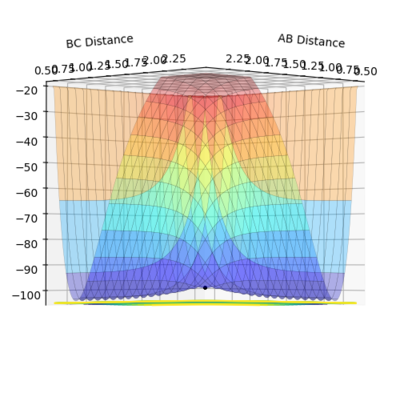
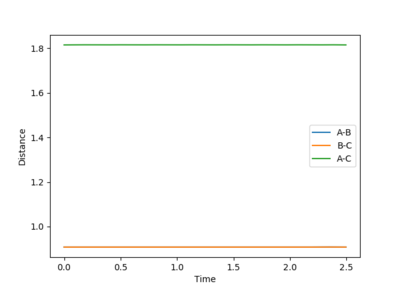
The best estimate of the transition state position(rts) was found when the value of the distances between AB and BC are both equal to 0.9076 Å. The initial setting of both distance are both 0.9076 Å and both momentum are both zero. From Fig.2.1 and Fig.2.2, it is obvious that the trajectory is just a black point locating on the ridge and never move. If that is not the correct position of the transition sate, then the trajectory will simply fall off and transfer all the potential energy to the kinetic energy.
Trajectories from r1 = rts+δ, r2 = rts
3.Comment on how the mep and the trajectory you just calculated differ.
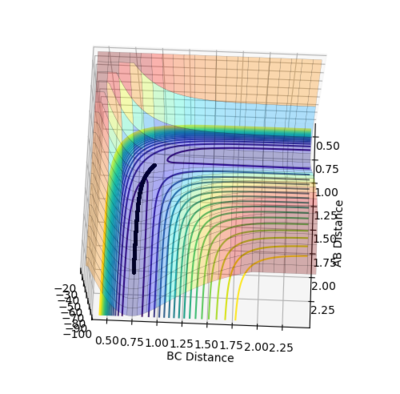
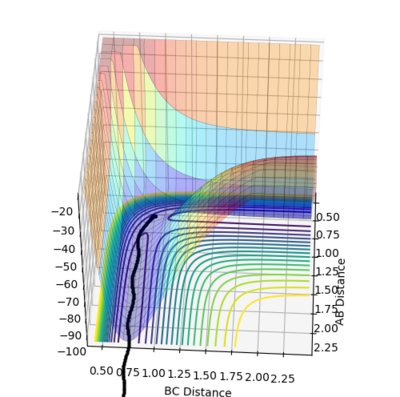
For MEP calculation, a very special trajectory is produced as the figure3.1 shows. Since the momentum is always reset to zero in each step, this trajectory moves in a extremely slow rate towards the direction with lower potential energy. Therefore, in this case, the trajectory moves along the minimum points of the PES tunnel and looks like a straight line. On the contrary, for dynamic calculation, the trajectory has oscillation and thus looks like wave.
4.What would change if we used the initial conditions r1 = rts and r2 = rts+0.01 instead?


| r1 = rts+0.01 | r2 = rts+0.01 | |
|---|---|---|
| r1/Å | 9.005 | 0.740 |
| r2/Å | 0.740 | 9.005 |
| p1/kg⋅ms-1 | 2.481 | 0.913 |
| p2/kg⋅ms-1 | 0.913 | 2.481 |
The first and third pictures are “Inter nuclear Distances vs Time” and “Inter nuclear Momenta vs Time” with conditions of r1 = rts+0.01, r2 = rts. On the contrast The second and fourth pictures are those with initial conditions of r1 = rts and r2 = rts+0.01 instead. The final values of distance and momentum are summarized in the table. It's obvious that after conditions switch, the final values of distance and momentum switch as well.
5.Setup a calculation where the initial positions correspond to the final positions of the trajectory you calculated above, the same final momenta values but with their signs reversed.What do you observe?
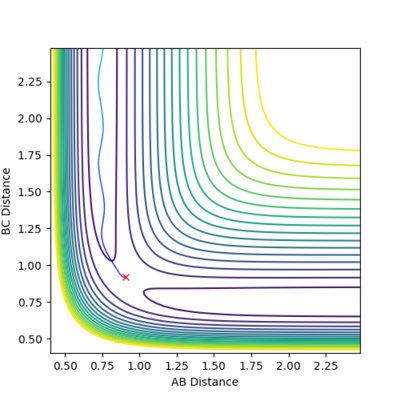

When the initial condition is r1 = rts and r2 = rts+0.01 with both momentum of 0, the trajectory starts from the transition state to the end of BC potential energy curve. In this case, the potential energy converts to the kinetic energy which enables atom A and B approach each other and atom C moves away from atom A and B. When the calculation resets as the question describes, the new trajectory is simply the reverse of the original one. It starts at the ends of last calculation and ends at the starts of the last calculation due to energy conservation.
Reactive and nonreactive trajectories
6.Complete the table by adding a column with the total energy, and another column reporting if the trajectory is reactive or unreactive. For each set of initial conditions, provide a plot of the trajectory and a small description for what happens along the trajectory.
| p1/kg⋅ms-1 | p2/kg⋅ms-1 | kinetic energy/kJmol-1 | total energy/kJmol-1 | active trajectory? |
|---|---|---|---|---|
| -1.25 | -2.5 | +4.687 | -99.119 | yes |
| -1.5 | -2.0 | +3.250 | -100.456 | no |
| -1.5 | -2.5 | +4.750 | -98.956 | yes |
| -2.5 | -5.0 | +18.750 | -84.956 | no |
| -2.5 | -5.2 | +20.290 | -83.416 | yes |
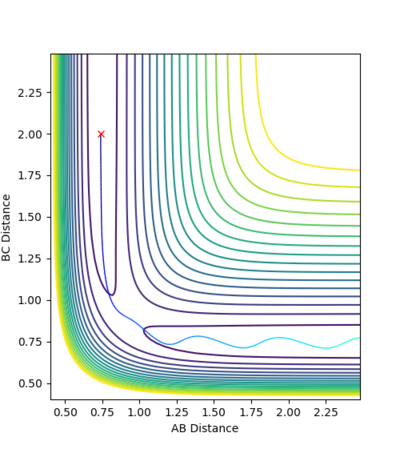
These 5 combinations have the same initial positions r1 = 0.74 Å and r2 = 2.0 Å leading to the same potential energy since they start at the same position of potential energy surface. For the first combination, the reactants have enough kinetic energy to overcome the activation barrier. Hence after atom C approaches molecule A-B, atom C form bond with atom B. Then atom A and molecule B-C move away from each other. The products have higher vibration energy than that of the reactants as the graph above shows.

For the second combination atom C and molecule A-B moves towards each other initially. When the distance between atom C and atom B nearly approaches 0.9076 Å, atom C and molecule A-B moves away from each other along the original path because in this case atom C and molecule A-B do not have enough kinetic energy to overcome the activation barrier.
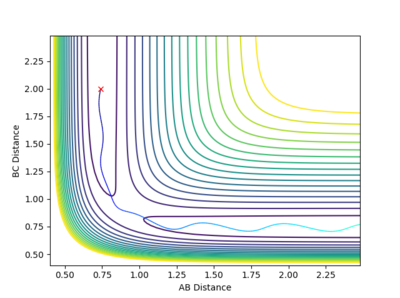
The third combination is similar to the first one, but the reactants pass the activation barrier with kinetic energy that is higher than the energy required. Moreover, the atoms move quicker.
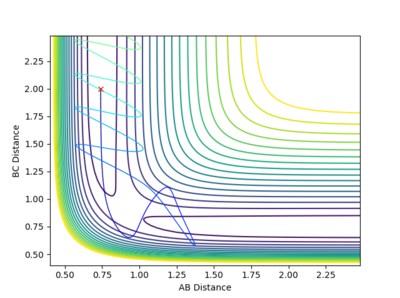

In this case, the reactants have higher oscillating energy and pass transition region twice. The trajectory reverts back immediately after crossing the transition state. In the Animation, despite that atom B and C form bond initially, it dissociates later when the distance between atom A and B become close.
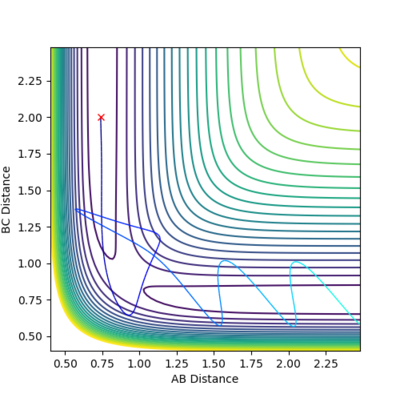

In this case, the reactants also have high oscillating energy but pass transition energy three times. The trajectory reverts back twice and finally goes towards the product side. In the Animation, Atom B and C form bond initially, it dissociates later when the distance between atom A and B become close. The bond between atom A and B also dissociates immediately when the distance between atom A and B become close. Finally molecule B-C is reformed and atom A, molecule B-C move away from each other.
7.State what are the main assumptions of Transition State Theory. Given the results you have obtained, how will Transition State Theory predictions for reaction rate values compare with experimental values?
There are 3 main assumptions of Transition State Theory: 1.Quantum-tunneling effects are assumed negligible and the Born-Oppenheimer approximation is applied. 2. the atoms in the reactant state have energies that obeys Boltzmann distribution. 3. Once the system attains the transition state, with a velocity towards the product configuration, it will not reenter the initial state region again.[2]
In reality, the third assumption breaks down which can be approved by the fourth and fifth examples in Question 6. Therefore, the experimental trajectory should be longer than what it's expected leading to a slower reaction rate.
Mm10114 (talk) 19:56, 31 May 2018 (BST) I don't quite follow what you mean by that last sentence.
EXERCISE 2: F - H - H system
PES inspection
8.Classify the F + H2 and H + HF reactions according to their energetics (endothermic or exothermic). How does this relate to the bond strength of the chemical species involved? Locate the approximate position of the transition state.
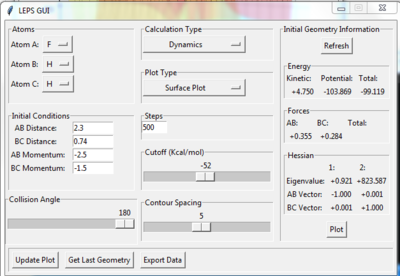
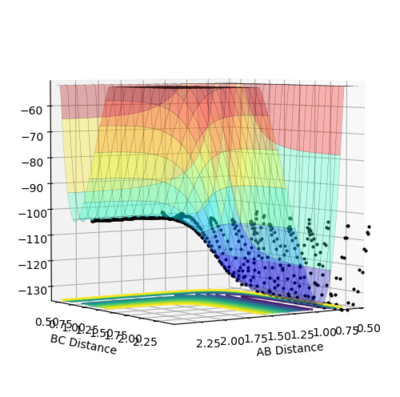
In this case, atom A is F and atom B and C are H. The initial conditions are setup as figure 8.1 shows,therefore the reaction is from F + H2 model to H + HF model. In the Figure 8.2, the left PES belongs to F + H2 model while the right PES refers to H + HF model. The reaction starts form the left hand side and oscillates strongly towards the product side. Since the reactants have higher potential energy, this reaction is exothermic. As the literature shows, the bond energies of H2 and HF are 435 kJmol-1 and 569 kJmol-1, which obeys the calculated trajectory. [3]
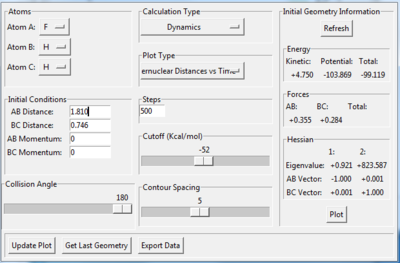
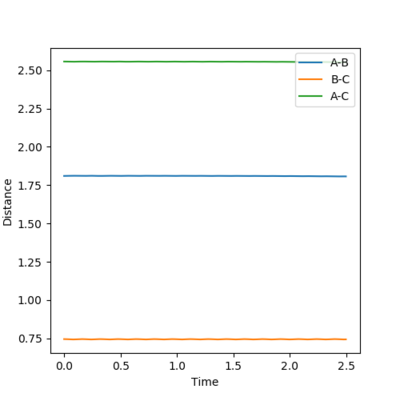
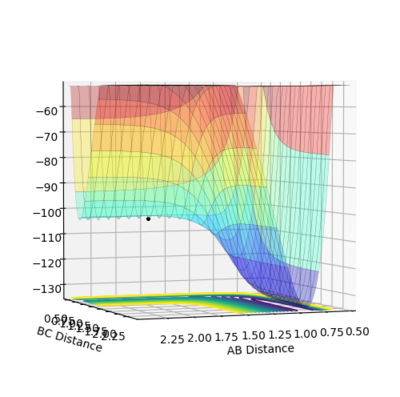
The transition state is found when the initial setting is as the figure 8.3 shows. Figure 8.4 and figure 8.5 proves the success of finding the transition state of this reaction. Therefore, the transition state is where AB distance equals 1.810 Å and BC distance equals 0.746 Å.
For the H + HF reaction, it is simply the reverse of the F + H2 reaction.
9.Report the activation energy for both reactions.
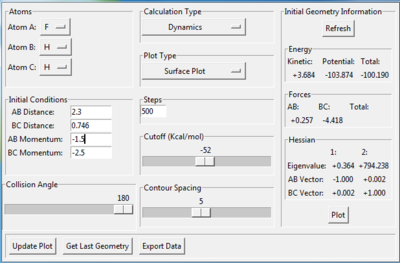
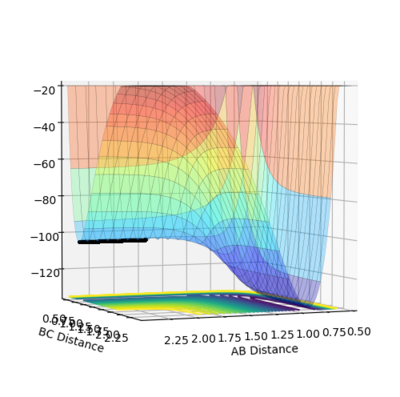

There are two ways to get the activation energy. MEP calculation is performed in this case. The structure with this initial condition (as figure9.1 shows) resembles to the structure of the transition state. The position of the starting point is located at the left hand side of transition state, which is towards the reactant tunnel,like figure 9.2 shows. Since there is no momentum at the start, the trajectory can't cross the transition state and just simply fall down from the initial position(near the transition state) towards the reactant position(F+H2 model). Therefore the activation energy of F+H2 reaction is the difference between the initial energy and final energy in the fig.9.3, which is summarized in table9.1.
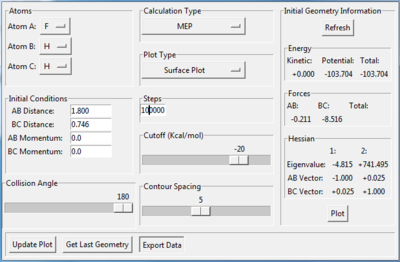

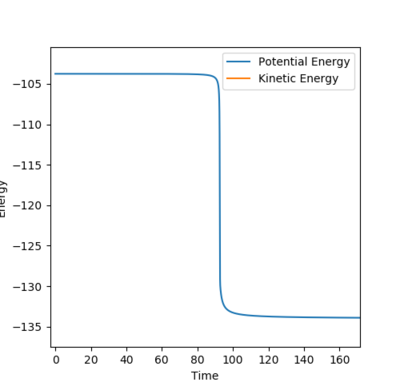
By making HF bond shorter, the position of the starting point is now switched to the right hand side of transition state, which is towards the product tunnel,like figure 9.5 shows. Fig.9.6 illustrates how energy drops when the trajectory moves to the product side(HF+H model). Since the HF+H reaction is simply the reverse of H2+F, its activation energy equals the final energy minus the initial energy of Fig.9.6.
| F + H2 reaction(MEP) | H + HF reaction(MEP) | F + H2 reaction(dynamics) | H + HF reaction(dynamics) | |
|---|---|---|---|---|
| potential energy/kJmol-1 | -103.995 | -133.992 | -104.005 | -133.995 |
| Transition energy/kJmol-1 | -103.751 | -103.752 | -103.751 | -103.751 |
| Activation energy/kJmol-1 | 0.244 | 30.240 | 0.254 | 30.244 |
Another method is via the Dynamics calculation. Since We already found the position of the transition state, We can obtain the exact value of the energy at the transition state which is -103.751 kJmol-1. Then we set the initial condition which is far away from the transition state and calculate its potential energy. The activation energy is simply the difference between these two energies. The value is summarized in the fourth and fifth columns of the table9.1. Theoretically the activation energies calculated via MEP method should be a bit smaller than that calculated via Dynamics method, because the transition energy used is the energy of structure neighboring the transition state.
Mm10114 (talk) 19:59, 31 May 2018 (BST) Good job. However, are you sure the energy unit, in the lespgui software, is kJ mol-1? It should be kcal mol-1.
Reaction dynamics
10.In light of the fact that energy is conserved, discuss the mechanism of release of the reaction energy. How could this be confirmed experimentally?
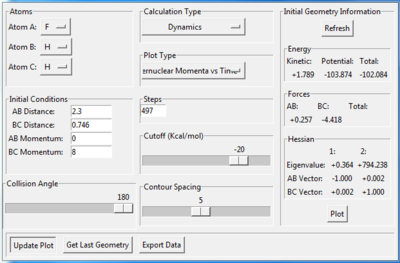
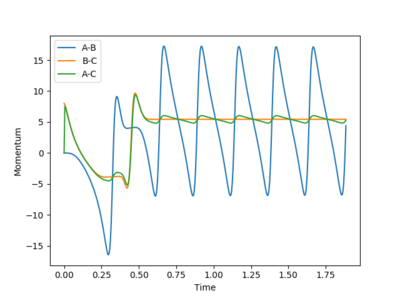
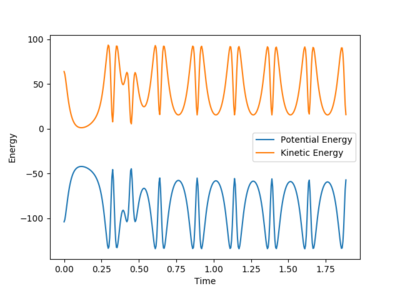
A set of initial conditions leading to a reactive trajectory for the F + H2 can be found as Fig10.1 shows and the value of p2 can be changed from 7 without upper limit. In this case, molecule BC(H2) is approaching atom A(F) until atom B(H) collide with atom A(F). During the process, the potential energy is converted to kinetic energy and molecule AB(HF) is excited to its excited vibrational state as Fig.10.2 shows. As Fig10.3 shows, After the absorption of the reaction energy, the energy of the system is interchanging between the potential energy and the kinetic energy.
Mm10114 (talk) 20:02, 31 May 2018 (BST) You didn't provide an answer to the second question.
11.Discuss how the distribution of energy between different modes (translation and vibration) affect the efficiency of the reaction, and how this is influenced by the position of the transition state.
In a typical chemical reaction with an energetic barrier, there is a saddle point that the reactants must cross in order to reach the product side. Which form of energy (translational or vibrational) initially deposited in reactants is more efficacious in surmounting the barrier is one of the central topics in the field of reaction dynamics. Polanyi's empirical rules state that vibrational energy is more efficient in promoting a late-barrier reaction( a transition state resembling the products) whereas transnational energy is proficient in promoting an early barrier reaction( a transition state resembling the reactants). [4]
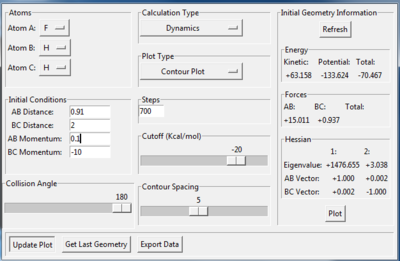
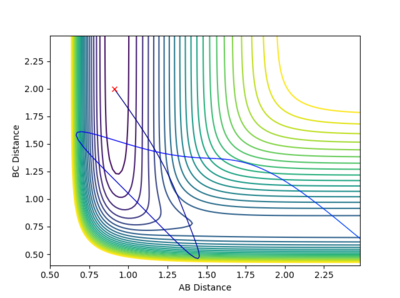
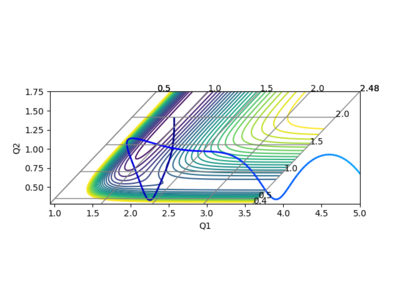

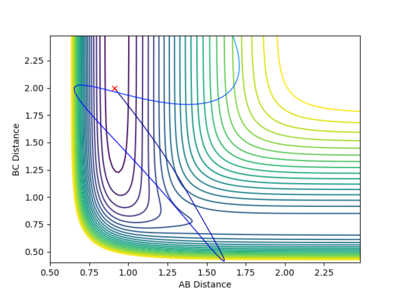
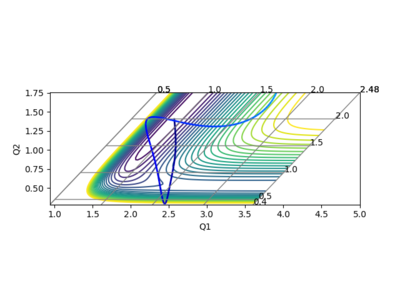
In the calculation, since the HF molecule(AB) is bounded, all the AB momentum is contributed to vibrational energy. The value of BC momentum refers to the translational energy that H atom(C) can collide with molecule HF(AB). The value of vibration energy can be proved by the extent of oscillation on the contour graph(the number of contour lines that the trajectory has passed)
Reference
- ↑ https://en.wikipedia.org/wiki/Second_partial_derivative_test
- ↑ T. Bligaard, J.K. Nørskov, in Chemical Bonding at Surfaces and Interfaces, 2008
- ↑ http://www4.ncsu.edu/~shultz/Common_Bond_enthalpies.pdf.
- ↑ 1.Z. Zhang, Y. Zhou, D. Zhang, G. Czakó and J. Bowman, The Journal of Physical Chemistry Letters, 2012, 3, 3416-3419.
