MRD:ks4817
Molecular Reaction Dynamics
Exercise 1
On a potential energy surface diagram, how is the transition state mathematically defined? How can the transition state be identified, and how can it be distinguished from a local minimum of the potential energy surface?
On a PES diagram the transition state is defined as the saddle point, it is the configuration that every possible configuration has to go through in order to react1. It can also be defined as the maximum on the minimum energy path from the reactants to the products.
The saddle point is mathematically classified as a critical point, therefore the first order partial derivatives of a two variable function that describes the reaction pathway can be set to 0 and any coordinate set that solves this is classified as a critical point. However there is a difference between the saddle point, local maxima and minima - they can be further classified by the determinant of the Hessian Matrix which is:
Det(H(x,y)) = fxxfyy-fxy2
A saddle point: Det(H(x,y))<0
A local minimum: Det(H(x,y))>0 and fxx>0
A local maximum: Det(H(x,y))>0 and fxx<0
Where fxx, fyy and fxy are second order partial derivatives of the function that describes the reaction pathway. You plug the critical points in to the determinant and the ones that are saddle points are when the determinant is less than zero.
Good but this is a little confusing, what is Det(H)? You need to be more clear in your description, ie if you simply stated that the second partial derivative is positive or negative for the local minimum or maximum, respectively, this would be clear and correct. Also, it would of been better if you used the relevant codes for your referencing, sub scripts and mathematical functions. Sf3014 (talk) 12:57, 4 June 2019 (BST)
Report your best estimate of the transition state position (rts) and explain your reasoning illustrating it with a “Internuclear Distances vs Time” plot for a relevant trajectory.
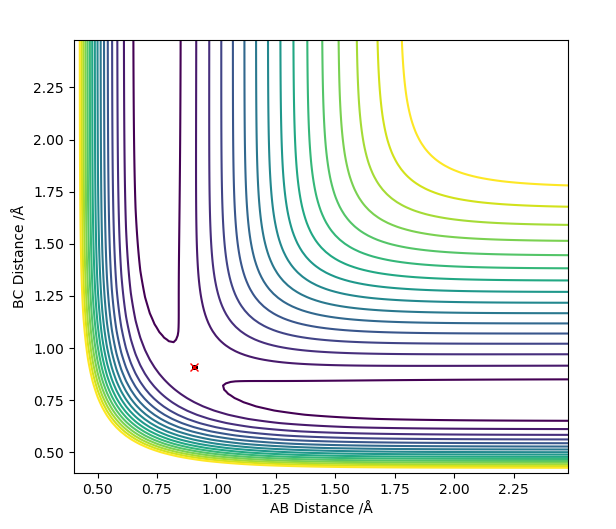
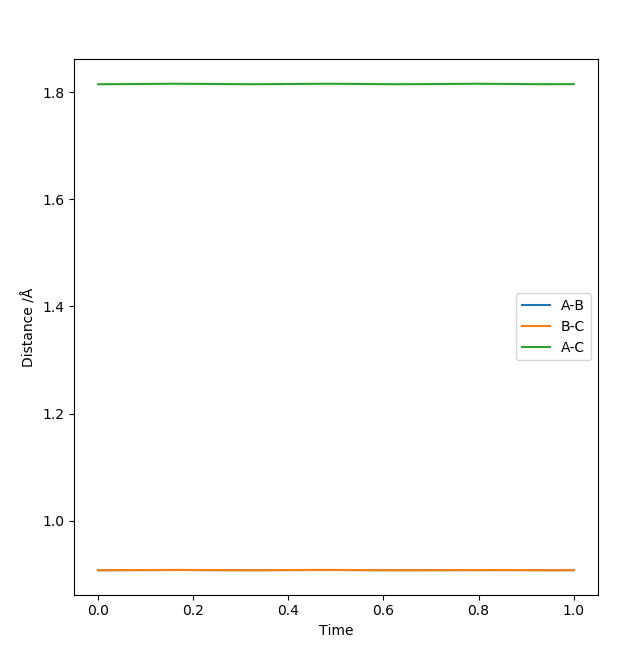
The best estimate for the transition state position is the r1=r2=0.9074 Å bond length. At the transition state the reaction path should start and end at the same point and the internuclear distances should be constant because the molecule is at the saddle point. This is illustrated by the contour plot and the Internuclear Distances vs Time plots respectively at 0.9074 Å:
 Good, but how did you find the position of your transition state?. Sf3014 (talk) 13:05, 4 June 2019 (BST)
Comment on how the mep and the trajectory you just calculated differ.
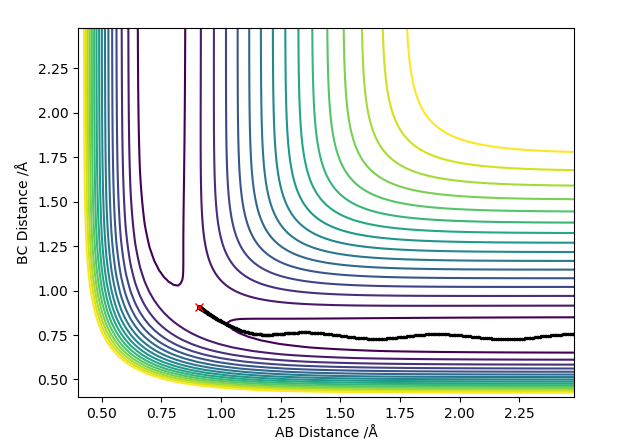
The MEP directly follows the lowest energy route to the products from the transition state. It does not take into account the instantaneous momentum as with each time step it is reset to 0.
For r1= 0.9084, r2=0.9074 and p1=p2=0.
The contour plots for the dynamic and mep respectively look like:
Here we can see the mep tracing a smooth route to the products whereas the reaction dynamics which takes into account molecular vibrations of the molecules which affect its route, the vibrational energy oscillates and causes the molecule to overshoot the energy pathway.
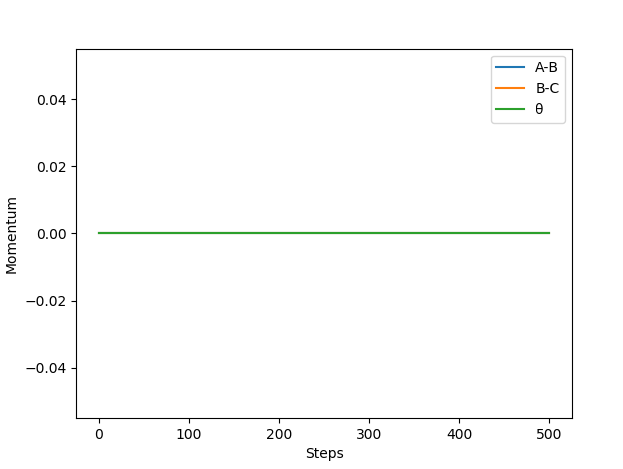
The Momentum vs. time plots for the dynamic and mep respectively look like:
The momentum for the mep route is 0 for the entire pathway because at each time step it is reset to zero whereas for the dynamic graph the momentum of HA corresponds to an increase in velocity because the atom is moving with translational energy and the new HBHC molecule is moving away and vibrating.
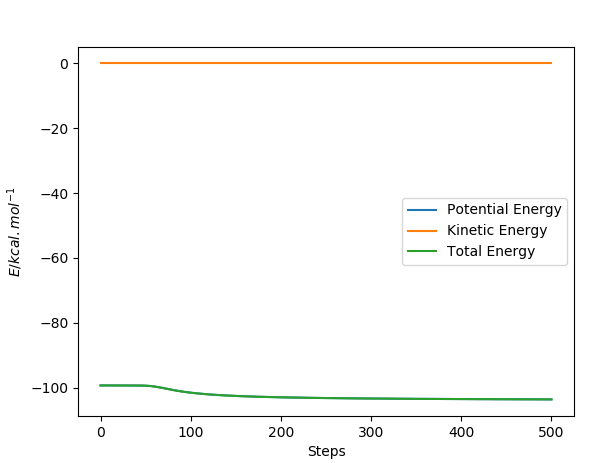
The Energy vs. time plots for the dynamic and mep respectively look like:
In the mep route the kinetic energy stays at 0 because yet again the momentum is reset at each time step to 0 whereas the total energy decreases because the transition state is higher in energy than the products. When looking at the dynamics graph the total energy remains the same and PE is lost to KE gain because the tranistion state is at a higher energy than the products and the energy is conserved.
The Internuclear distance vs time plots for the dynamic and mep respectively look like:
The mep graph shows no molecular vibrations for the HBHC and the molecule and atom appear to be moving with just translation motion. In the dynamic graph HA moves off with translational motion and HBHC moves off with slight vibrational motion. Very Good comparison and good use of examples. Sf3014 (talk) 13:11, 4 June 2019 (BST)
Complete the table bellow by adding the total energy, whether the trajectory is reactive or unreactive, and provide a plot of the trajectory and a small description for what happens along the trajectory. What can you conclude from the table?
The table shows that the H-H and H molecules must have enough momentum to pass through the transition state to react, however they must also not have an excess amount because the reaction can pass back through the transition state and go back to the products. Good observation but did you mean back to the reactants?. Sf3014 (talk) 13:23, 4 June 2019 (BST)
State what are the main assumptions of Transition State Theory. Given the results you have obtained, how will Transition State Theory predictions for reaction rate values compare with experimental values?
Transition state theory is based on classical mechanics2.
The main assumptions of Transition State Theory2 to derive the rate of reaction:
- The Born Oppenheimer approximation of separating electronic and nuclear motions
- Reactant molecules are distributed according to the Maxwell-Boltzmann distribution
- Once past the transition state in the direction of the products the system cannot turn around and reform the reactants
- Motion along a reaction coordinate can be separated from other motions of the molecule and understood through classical physics as translation
- In the absence of an equilibrium between the products and reactants, the transition states that start becoming products become distributed with the Maxwell-Boltzmann distribution
As the simulations we are running are closer to experiment the transition state theory would predict reaction rates to be faster than they are in experiment because as we saw in the simulations, given enough energy the molecules could pass through the transition state multiple times and make the reaction rates slower. Good but be more clear in your comparison between transition state theory and your calculations, ie refer to your table. Sf3014 (talk) 13:23, 4 June 2019 (BST)
Exercise 2
By inspecting the potential energy surfaces, classify the F + H2 and H + HF reactions according to their energetics (endothermic or exothermic). How does this relate to the bond strength of the chemical species involved?
| Equation | Exothermic/Endothermic |
|---|---|
| F + H2 -> HF + H | Exothermic |
| F + HF -> HF + F | Endothermic |
The bond dissociation energies of H2 and HF are as follows:
| H2 | HF |
|---|---|
| 436 kJ mol-1 | 569 kJ mol-1 |
As the HF bond is stronger than the H2 bond (required more energy to break) the reaction:
- H2 + F -> HF + H
is exothermic because more energy is released from the formation of HF than taken in to break the H2 bond.
- HF + H -> H2 + F
is endothermic because more energy is taken in to break the HF bond than released by the formation of the H2 bond. Good but you needed to include the potential energy surface in your description. Also, where did you get these values for the HF and H2 bond energies? reference, please. Sf3014 (talk) 13:29, 4 June 2019 (BST)
Locate the approximate position of the transition state
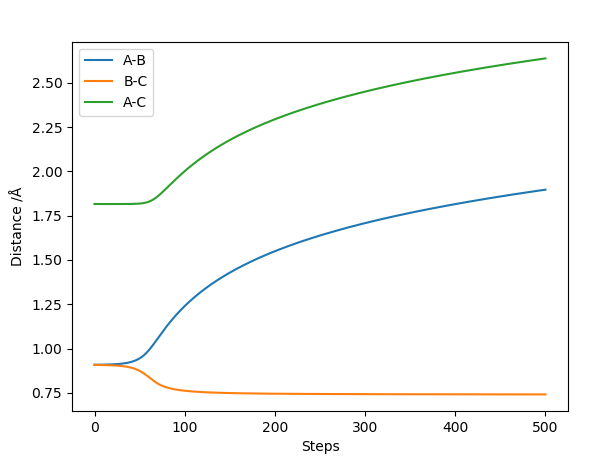
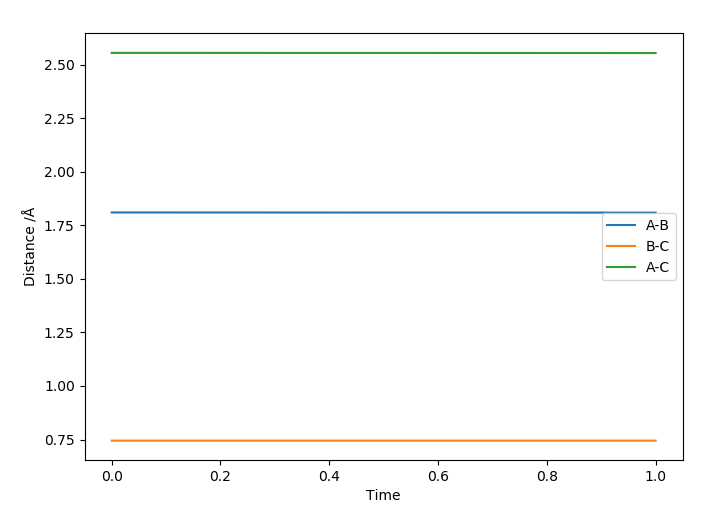
According to Hammond's postulate as the reaction is exothermic the TS will be similar to the reactants F and H2 because they are similar in energy. The approximate position of the transition state is rFH=1.8112 Å and rHH=0.7440 Å. This can be seen in the Internuclear Distances vs. Time plot as the distances are constant:
 Good. Next time reference Hammond's postulate. Sf3014 (talk) 13:34, 4 June 2019 (BST)
Report the activation energy for both reactions.
The activation energy of the reactions can be calculated by running the mep from a position close to the transition state:
For H + HF -> H2 + F:
rFH=1.802 Å and rHH=0.7440 Å and using the Energy vs. time graph to calculate the activation energy as the difference between the transition state and the products.
The calculation is: (-103.752) - (-133.955) = 30.203 kcal mol-1
For F + H2 -> FH + H:
The difference in energy levels is very small as the reactants energy level is very close to the transition state because the reaction between F + H2 is highly reactive.
rFH=1.812 Å and rHH=0.7440 Å and using the Energy vs. time graph to calculate the activation energy as the difference between the transition state and the products.
The calculation is:
(-103.752) - (-103.956) = 0.204 kcal mol-1 Good but where is the energy vs time graph for the latter reaction? Also, the activation energy is the difference between the energies of the transition state and the reactants. Sf3014 (talk) 13:41, 4 June 2019 (BST)
In light of the fact that energy is conserved, discuss the mechanism of release of the reaction energy. Explain how this could be confirmed experimentally.
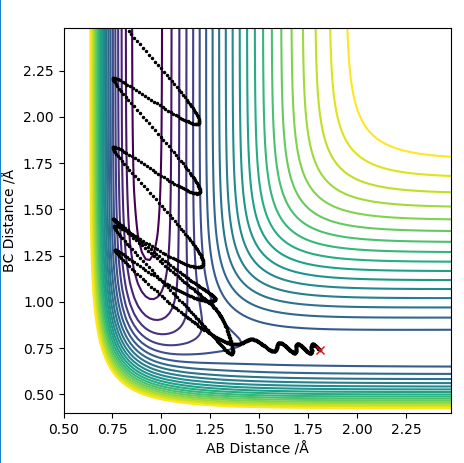
When observing a reaction that goes to completion the example analysed has these initial conditions:
rFH: 1.81 Å
rHH: 0.74 Å
pFH: -0.5 kg m s-1
rHH: -2 kg m s-1
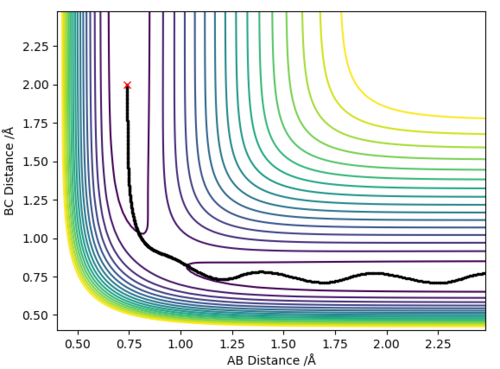
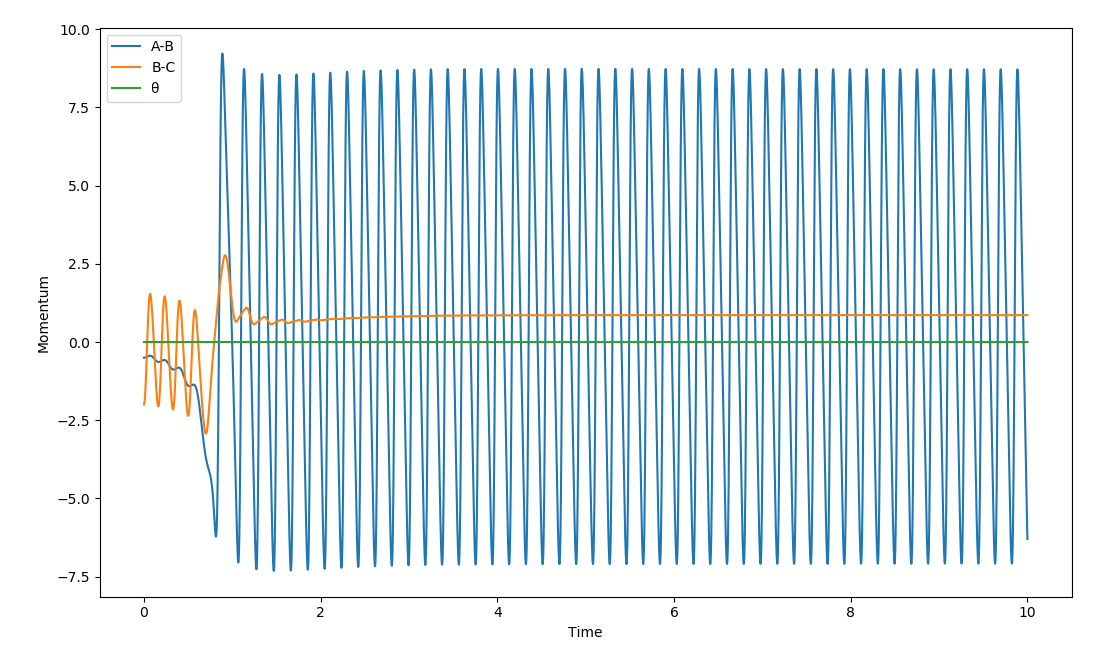
The H2 molecule approaches the F and when the reaction occurs the HF molecule has much more vibrational energy than the H2 moleucle has and the H atom moves off at a slower velocity than initially as can be confirmed by the Momentum vs. Time graph for this reaction:
This implies that the mechanism for the release of reaction energy involves transferring potential and translational energy to vibrational energy (heat energy). Good but what analytical experiment can show this?. Also, your description of the momenta vs time graph is a little confusing, if you started with a larger AB distance you'll have more information in your momenta vs time graph before the reaction for a clearer observation on the conservation of energy. Sf3014 (talk) 13:41, 4 June 2019 (BST)
Discuss how the distribution of energy between different modes (translation and vibration) affect the efficiency of the reaction, and how this is influenced by the position of the transition state.
Polanyi's rules state that for an early barrier crossing (early TS such as in exothermic reactions) the translational energy is more important than vibrational energy so the reactants can move across the reaction coordinates and not vibrating in one position2. For a late barrier crossing (late TS such as in endothermic reactions) vibrational energy is more important in crossing rather than translational energy as the energy barrier must be overcome2.
This can be observed when observing -3<pHH<3
Initial conditions:
rFH: 1.81 Å
rHH: 0.74 Å
pFH: -0.5 kg m s-1
| pHH | Reactive? | Multiple Barrier Crossings? | Image |
|---|---|---|---|
| -3 | Y | Y | 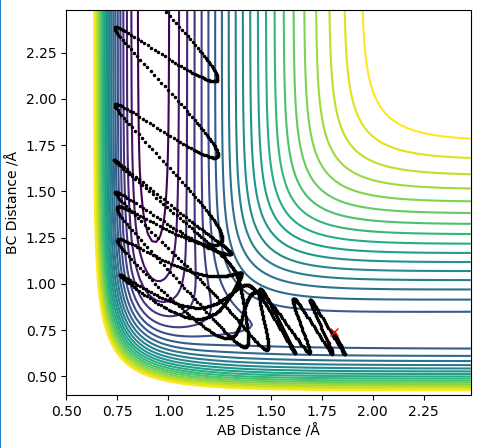
|
| -2.5 | N | Y | 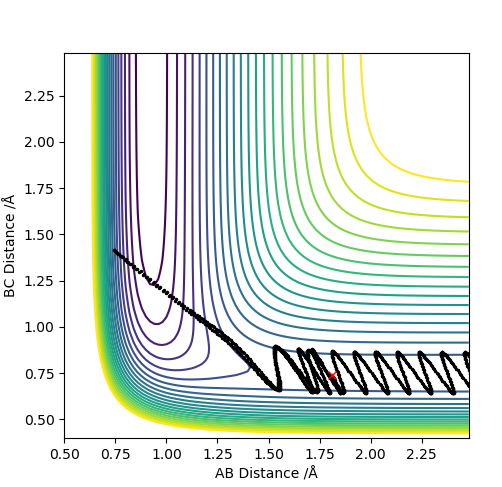
|
| -2.0 | Y | N | 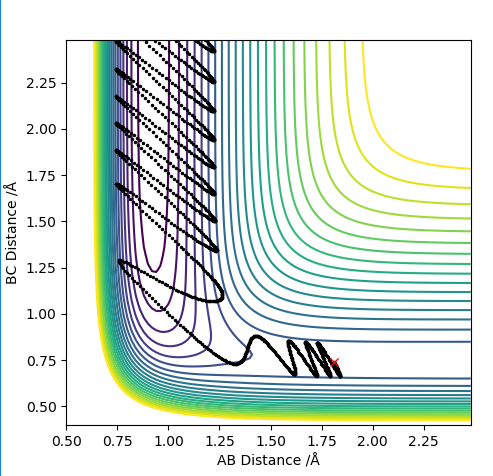
|
| -1.5 | N | Y | 
|
| -1.0 | N | Y | 
|
| -0.5 | N | Y | 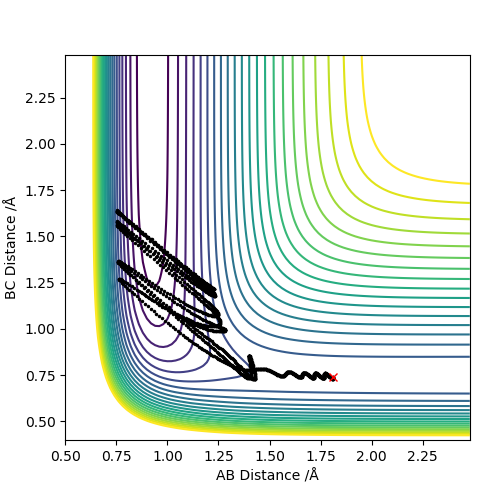
|
| 0 | Y | Y | 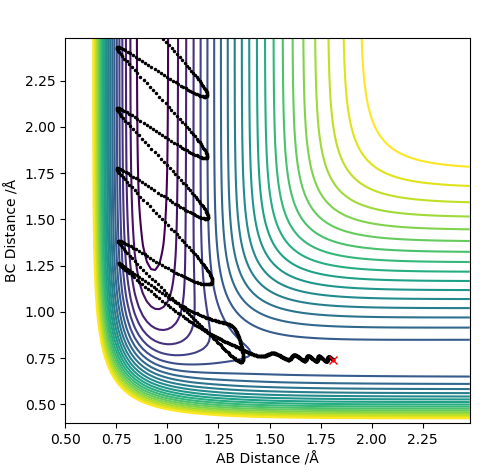
|
| 0.5 | Y | Y | 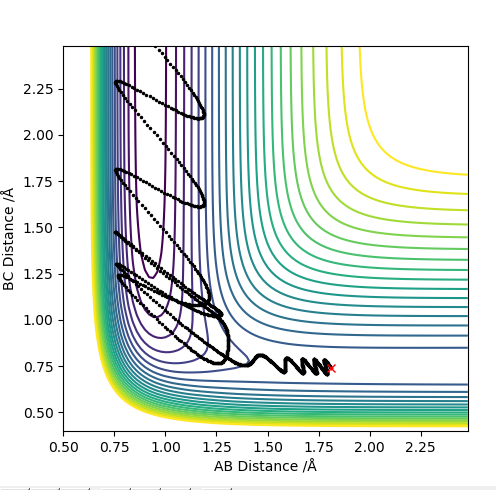
|
| 1.0 | N | Y | 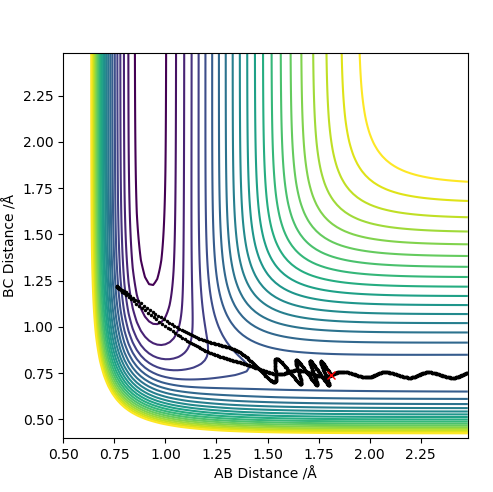
|
| 1.5 | Y | Y | 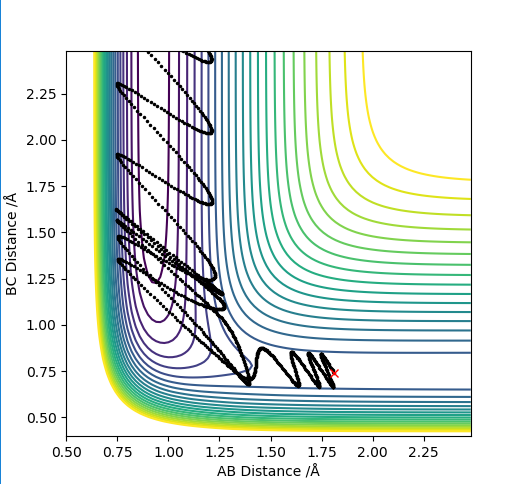
|
| 2.0 | N | Y | 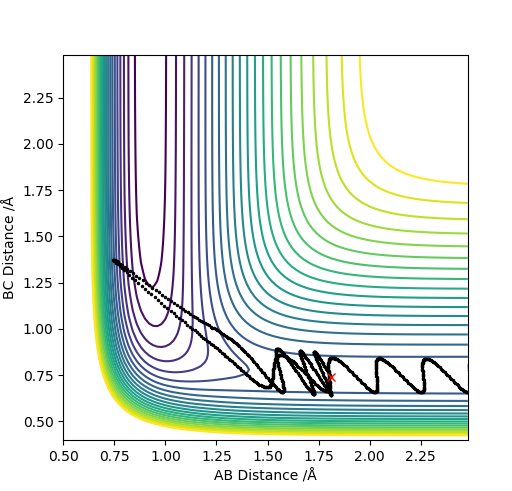
|
| 2.5 | Y | Y | 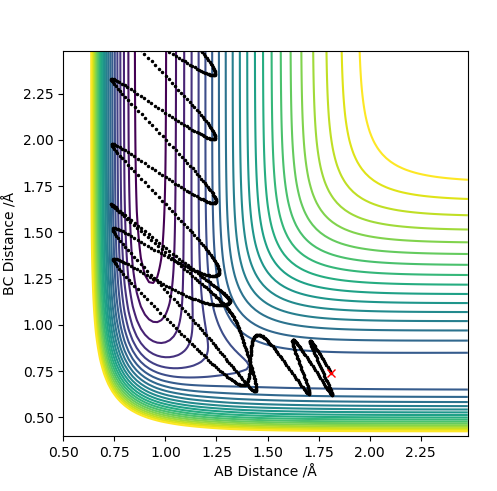
|
| 3.0 | N | Y | 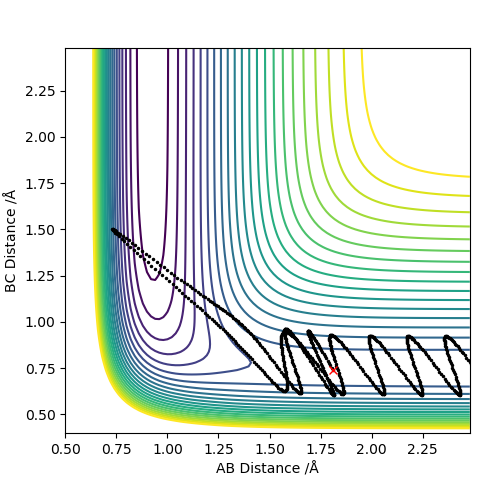
|
For values of |pHH|<1 the reaction is more likely to occur. For values higher than that the reaction can occur for certain conditions such as pHH= -2 kg m s-1 however there seems to be no general trend. The reaction molecules can pass multiple times through the transition state given enough momentum however this does not necessarily mean the reaction can occur such as at pHH= 3 kg m s-1. Overall a high vibrational and low translational energy combination results in very inefficient reactions for this process.
When the same bond lengths are used and the momenta are set as:
pFH: -0.8 kg m s-1
pHH: 0.1 kg m s-1
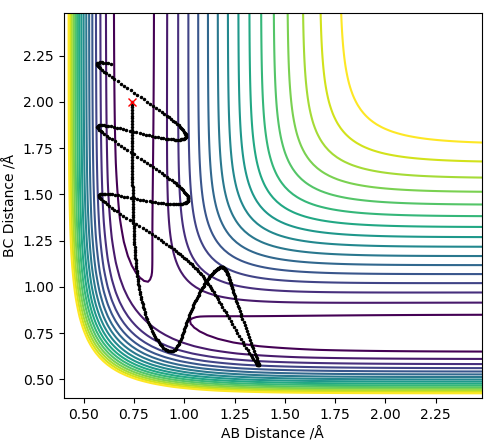
The reaction occurs quicker than when we were just changing the vibrational energy of the H2 molecule. This agrees with Polayni's rules as this reaction is exothermic and has an early TS meaning translational energy is more important in surpassing the barrier and when we increase the momentum pFH we increase the translational energy therefore increasing the reaction efficiency, despite the fact that it goes through the transition state multiple times with this bond distance. Low vibrational energy of the H2 and higher translational energy of the F increase the efficiency of reaction.
The reaction path can be seen bellowː
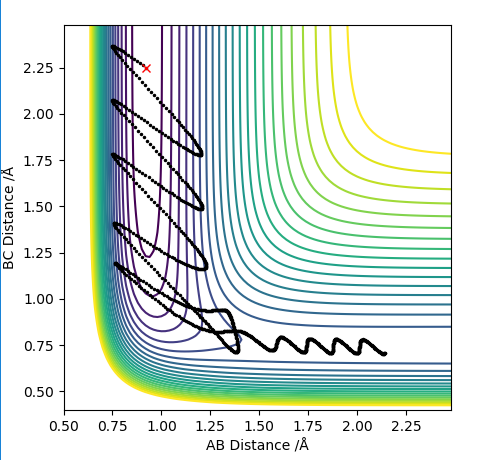
When we look at the reverse reaction with initial conditions:
rFH: 0.922 Å
rHH: 2.25 Å
pFH: -9 kg m s-1
pHH: -1.5 kg m s-1
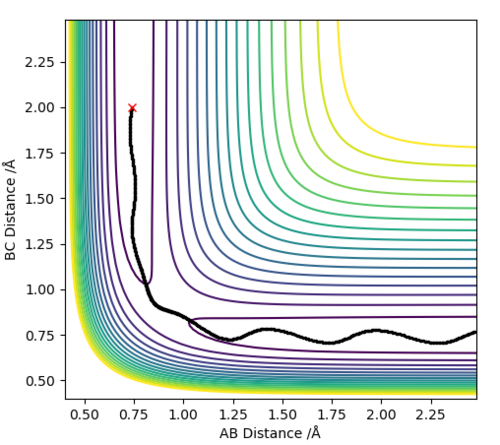
These initial conditions yield a reaction, this goes through the transition state twice as can be seen on the contour diagram nevertheless it is also an effective reaction because the vibrational energy is so high for the HF molecule. For low vibration of HF and high translation of H the reaction does not occur whatsoever which again highlights the importance of vibrational energy in endothermic reactions where there is a late transition state.
The reaction path can be seen bellow:
 Very good description and use of examples. Sf3014 (talk) 13:58, 4 June 2019 (BST)
References
- Atkins, P. W. (Peter William), 2018. Atkins' Physical Chemistry, Oxford University Press.
- Steinfeld, J.I., Francisco, Joseph S & Hase, William L, 1989. Chemical kinetics and dynamics, Englewood Cliffs, N.J.: Prentice Hall.

