
MRD:kkz16
Molecular Reaction Dynamics
EXERCISE 1: H + H2 system
Dynamics of the Transition State Region
Q. What value do the different components of the gradient of the potential energy surface have at a minimum and at a transition structure? Briefly explain how minima and transition structures can be distinguished using the curvature of the potential energy surface.
Along the minimum energy pathway there are 2 minima points of in energy (at the reactants and at the products). These correspond to the points at which 𝛿V/𝛿r1=0 and 𝛿V/𝛿r2=0, as these are minima, the second derivatives (𝛿2V/𝛿r12 and 𝛿2V/𝛿2r2) would be greater than 0. Along the minimum energy pathway there is a maximum produced at the transition state, this would be a saddle point overall. At this point both 𝛿V/𝛿r1 and 𝛿V/𝛿r2 are equal to 0, and the second derivative test must be used in order to confirm the saddle point. This is done using the equation H=fr1r1(r1,r2)fr2r2(r1,r2)−fr1r2(r1,r2)2, where fr1r1(r1,r2) represents the second partial derivative with respect to r1r1 etc. When H<0 then the stationary point is a saddle point, and therefore, in this case, the transition state.
(This is almost perfect. You need to be careful about the coordinate system that you're using for the partial derivatives. At the TS, the partial derivatives should be with respect to the reaction coordinate and its orthogonal counterpart. Fjs113 (talk) 21:31, 17 May 2018 (BST))
The transition state could therefore be found by providing 0 momentum and finding the point at which no change in energy/movement occurs, if the transition state is not immediately found, the trajectories of the atoms/molecules would 'roll' either towards the reactants or the products (down the energy gradients; towards the minima) depending on which side of the transition state they were on.
Trajectories from r1 = r2: Locating the Transition State
Q. Report your best estimate of the transition state position (rts) and explain your reasoning illustrating it with a “Internuclear Distances vs Time” plot for a relevant trajectory.
r1=r2=1.0 was used as a starting point for the trajectory, and was found to be too high, as the internuclear distance against time graph produced a strong curve when using the calculation method of MEP. The position of the plateau of the A-B and B-C bonds were noted and trialed. The process was repeated with increasing accuracy until the forces were observed to be 0.000 to the nearest 3dp. This point was found to be r1=r2=0.9077425, and continued to provide forces of 0.000 to 3dp when the number of steps was increased to 1000 (from 500) showing good accuracy. This produced a plot of what appeared to be 2 parallel lines, however the A-B and B-C lines are overlapped (blue under orange), so it is in fact 3 lines. The distances did not change over time, showing no change in trajectory, and therefore that this is a fairly good estimate of the transition state position. When the graph at this position was changed back to the dynamic calculation type, no change was observed (remained as 2 parallel likes) showing that there are no oscillations at the transition state.
 |
 |
(Impressive. Loved that you showed your working and how you determined that it was indeed the TS! Fjs113 (talk) 21:31, 17 May 2018 (BST))
Trajectories from r1 = rts+δ, r2 = rts
Q. Comment on how the mep and the trajectory you just calculated differ. The MEP sets the velocity to 0 for each time interval, resulting in the equivalent of multiple snapshots/pictures being pieced together. This means that oscillations are not observed on the MEP plot, however they are on the dynamic plot. The dynamic plot does not reset the velocity to zero in each time interval, and so oscillations are observed due to the acceleration and deceleration due to the spring like forces in the bond. While the dynamic plot looks almost linear overall (ignoring/averaging the oscillations), the MEP plot produces curves. This seems to suggest that there is a deceleration over time, indicating a loss of energy. The distances on the MEP plot are also much smaller than those observed on the axis of the dynamic plot.
 |
 |
Reactive and unreactive trajectories
Q.Complete the table by adding a column with the total energy, and another column reporting if the trajectory is reactive or unreactive. For each set of initial conditions, provide a plot of the trajectory and a small description for what happens along the trajectory.
r1=0.74, and r2=2.0 were used to compile the following table:
| p1 | p2 | Total Energy | Reactivity | Trajectory | Description |
|---|---|---|---|---|---|
| -1.25 | -2.5 | -99.018 | Reactive | 
|
Trajectory goes towards the products, through the transition state
. Vibrations/oscillations increase after transition. |
| -1.5 | -2.0 | -100.456 | Unreactive | 
|
Trajectory returns towards the reactants before reaching the transition state. |
| -1.5 | -2.5 | -98.956 | Reactive | 
|
Trajectory goes towards the products, through the transition state. |
| -2.5 | -5.0 | -84.956 | Unreactive | 
|
Trajectory returns towards the reactants, after the transition state has been formed. |
| -2.5 | -5.2 | -83.416 | Reactive | 
|
Trajectory goes towards the products, through the transition state.
After passing through transition state, trajectory returns back towards reactants, before turning again towards the products |
Q.State what are the main assumptions of Transition State Theory. Given the results you have obtained, how will Transition State Theory predictions for reaction rate values compare with experimental values?
As the transition state theory (TST) is a model based on classical mechanics, 2 main assumptions are made[1]:
1) The separation of electronic and nuclear motions
2) The reactant molecules are distributed among their states in accordance with the Maxwell-Boltzmann distribution
Additionally 3 other assumptions are made which as specific to this theory:
1) Molecular systems that have crossed the transition state in the direction of products cannot turn around and reform reactants
2) In the transition state, motion along the reaction coordinate may be separated from the other motions and treated classically as a translation
3) Even in the absence of an equilibrium between reactant and product molecules, the transition states that are becoming products are distributed among their states according to the Maxwell-Boltzmann laws
These assumptions would mean that the rate would be overestimated, and the reality of the 4th reaction shows that the additional assumption 1) is not true in reality as it shows the system reforming the reactants after the formation of the transition state. Graphs like reaction 4 are observed in reality due to tunneling which enables the the activation barrier to be re-crossed, even after the formation of a transition state. Tunneling is a quantum effect and so is not accounted for in the classical model of the TST.
(Perfect! Fjs113 (talk) 21:31, 17 May 2018 (BST))
EXERCISE 2: F - H - H system
PES inspection
Q.Classify the F + H2 and H + HF reactions according to their energetic (endothermic or exothermic). How does this relate to the bond strength of the chemical species involved?
The F + H2 reaction to H + HF is shown to be exothermic due to the products being at a lower energy than the reactants (energy is released in the form of heat). This would mean that the reverse reaction (H + HF --> F + H2) would be endothermic (requires energy). This means that the H-F bond stronger than the H-H bond.
(That is correct. How does this relate to the picture you've shown? Would've just been nice to relate your answer to the depth of the wells etc. Fjs113 (talk) 21:31, 17 May 2018 (BST))

Q.Locate the approximate position of the transition state.
Using Hammond's Postulate, since the reaction is known to be exothermic, it can be assumed that the transition state will be towards the reactants. A point (r1=0.75 and r2=1.75. p1=p2=0) was chosen as a starting point for this reason, and improved through trial and error until the state of 0 kinetic energy and minimum forced was found. The transition state of the reaction was found to be when the H-H bond length was 0.746 and the distance between the H-H and the F as 1.810.
The transition state of the exothermic reaction was found to have a potential energy of -103.751, while the reactants were found to be -104.020, (H-F distance=6, H-H bond length=0.74, p1=p2=0)so the activation energy was calculated to be 0.269. The transition state of the endothermic reaction is the same, while the reactants were found to be -134.025 (H-F bond length= 0.92, H-H distance = 6), therefore the activation energy was 30.274.
(Very good! Maybe a figure or two could've illustrated this? The MEP energy vs time graph shows the drop in potential energy very nicely. Fjs113 (talk) 21:31, 17 May 2018 (BST))
Reaction Dynamics
Q. In light of the fact that energy is conserved, discuss the mechanism of release of the reaction energy. How could this be confirmed experimentally?
The reaction coordinates used to model this successful reaction of F and H2 were:
r1=0.69, r2=2.5, p1=-1.25, p2=-2.5
The reaction is an exothermic reaction so there is a release in energy, from the graphs it can be observed that the energy is released in another form. This is true due to the first law of thermodynamics which states that energy must be conserved as it cannot be created or destroyed, and the conservation of momentum, which would suggest that the same momentum must exist before and after the collision. The graphs below show that the kinetic energy increases, not just from the kinetic energy graph (average energy increases) but also the increase observed in the momentum of the H-F bond, while the H-H bond vibrations and momentum decreased. The increase in amplitude of the graphs shows this increase in momentum. The kinetic energy is also seen to increase in the energy-time graph, where the potential energy is observed to decrease by the same amount, showing that energy is converted from potential energy to kinetic energy.
 |
 |
 |
These can be experimentally confirmed using calorimetry experiments, as the increase in kinetic energy of the molecules should result in an increase in temperature of the reaction mixture. IR could also be used to measure the increase in the vibrations as overtones would be produced.
Q. Discuss how the distribution of energy between different modes (translation and vibration) affect the efficiency of the reaction, and how this is influenced by the position of the transition state.
The Polanyi empirical rules state that translational energy is more efficient than vibrational energy for early-barrier reactions, where as vibrational energy is more efficient at activating late-barrier reactions. [2]
Reaction of H2+F
In this model, r1 = H-H distance, r2 = H-F distance, and similarly the magnitude of p1 is related to the magnitude of H-F energy (translational at start) and the magnitude of p2 is related to the H-H energy (vibrational at start). Using Hammond's Postulate on this reaction (which we know to be exothermic), it can be determined that the transition state should lie towards the reactants and therefore be an early barrier reaction and so a larger translational energy should make the reaction more efficient.
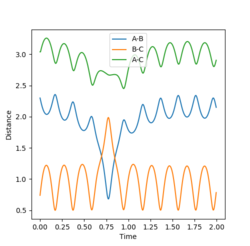
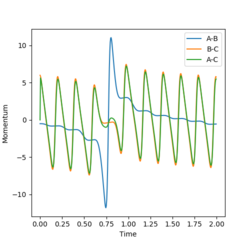
Using the reaction values r1=0.74 r2=2.3 p1=0.5 p2=-6: Which represent a much greater translation energy than vibrational energy the reaction was found to occur due to the balance of energy being good enough to overcome the transition state, and proceed to the products. As show in the graphs below, the A-B (H-F interaction) starts with predominantly translational energy (few oscillations and a slope observed) where as after the reaction, only vibrational energy (no sloping, however many oscillations) was observed. The B-C (H-H interaction) is shown to be predominantly vibrational to begin with, however gained a lot of translational energy after the interaction, which leas to the sloping as the distance between the atoms increased. In the momentum graph an increase in total momentum is observed in the molecule, this is due to the increase of energy due to gaining kinetic energy through the drop in potential energy from the transition state.
- Larger Translational Energy than Vibrational Energy
-
 Contour Plot
 -
 Distance-Time Graph
 -
 Momentum-Time Graph


Using the reaction values r1=0.74 r2=2.3 p1=6 p2=-0.5: Which represents a greater vibrational energy than translational (H-H bond greater momentum/energy than the H-F interaction), despite the transitiona state formation, as observed in the graphs below, the reactants are reformed due to the low translation energy component, which is more effective. The balance of energies is not enough to overcome the transition state to form the products. In this example, due to the lower translational energy, the H-H bond is consistently dominated by vibrational energy with little to no translational energy observed. There is also little to no overall change in momentum as the products as not formed and so there is no overall decrease in energy. There is no overall reaction and agrees with the Polanyi empirical rules.
- Larger Vibrational Energy than Translational Energy
-
 Contour Plot
 -
 Distance-Time Graph
 -
 Momentum-Time Graph


Reaction of HF+H
In this model, r1 = H-F distance, r2 = H-H distance, and similarly the magnitude of p1 is related to the magnitude of H-H energy (translational at start) and the magnitude of p2 is related to the H-F energy (vibrational at start). As expected of the reverse reaction to the reaction above, it would be expected that the energy barrier would be late in the reaction and therefore according to Polanyi's rules vibrational energy should encourage the reaction.
Using the reaction values r1=0.92 r2=2.3 p1=1.5 p2=-7: Which represents a greater translational energy, no reaction was observed, as the B-C (H-F bond) remained did not change in distance (not gained translational energy) and continued to vibrate in the same place (as seen from the distance-time graph).
- Larger Translational Energy than Vibrational Energy
-
 Contour Plot
 -
 Distance-Time Graph
 -
 Momentum-Time Graph


Using the reaction values r1=0.92 r2=2.3 p1=7 p2=-1.5:
Which represents a greater vibrational energy than translational energy. The contour plot shows that the reaction goes to completion, through the transition state. The A-B (H-H interaction) loses translational energy, which the B-C (H-F interaction) gains which is shown in the distance time plot.
- Larger Vibrational Energy than Translational Energy
-
 Contour Plot
 -
 Distance-Time Graph
 -
 Momentum-Time Graph


The results of all these graphs agree with the Polanyi Empirical Rules.
(Nothing to comment. Very well done indeed. Fjs113 (talk) 21:32, 17 May 2018 (BST))
References
- ↑ J. I. Steinfeld, J. S. Francisco, W. L. Hase, (1989), Chemical Kinetic and Dynamics, Chapter 10, p.311
- ↑ Polanyi, J.C. Some Concepts in Reaction Dynamics, Nobel Lectures Including Presentation Speeches and Laureates. Biographies. Chemistry 1981-1990; Malmström, B.G., Ed.; World Scientific Publishing Co.: Singapore-River Edge, NJ-London-Hong Kong, 1992; p.359-407