MRD:kkl115
Molecular Reaction Dynamics
H + H2 system
Dynamics from the transition state region
Both the minimum and the transition structure represent stationary points on the potential energy surface; the transition state is defined at the maximum potential energy point between the energy path of the reactants and products. [1] Therefore, the gradient is given by:
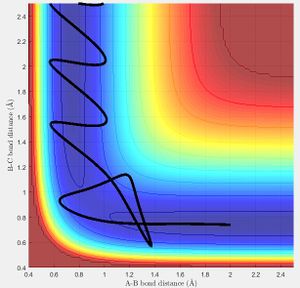
When visualized on a potential energy surface, minima can be seen at the lowest point of the entire potential surface (Fig.1: dark blue trough of the plot). The transition state is the saddle of the plot, seen as the maximum point of the reaction pathway (peak of the dark blue trough).
Locating the Transition State
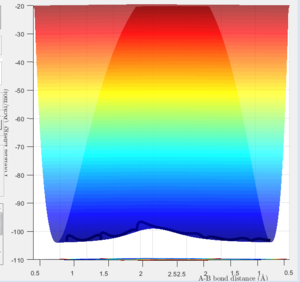
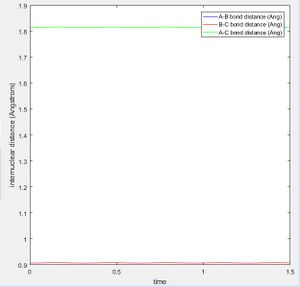
The best estimate of the transition state position (rts) was found at r = 0.9072 Å when r1 = r2 and p1 = p2 = 0 at a point where the oscillation of internuclear distances was minimized. r1 is the distance between the hydrogen molecule, r2 the distance between the newly formed hydrogen molecule after reacting and the momentum correspond to those. The bond lengths are set equal due to the symmetry of H-H-H and the momentum is set to zero as without a force applied to the trajectory, it will remain at the desired position of the transition state. It can be seen that the internuclear distances of r1 and r2 are both constant at this position (Fig. 2).
The Reaction Path
Trajectories from r1 = rts+δ, r2 = rts
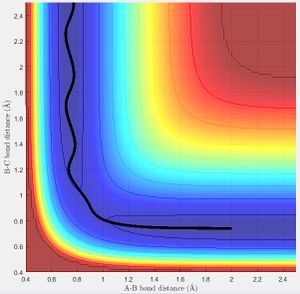
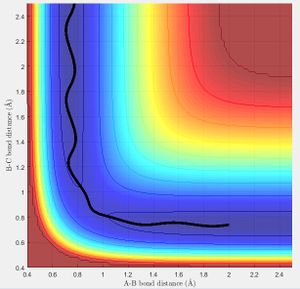
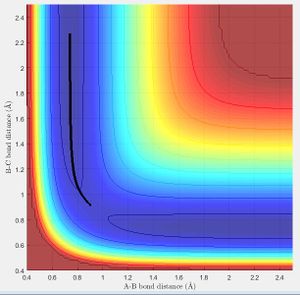
The minimum energy path (mep) (Fig.3) is the trajectory modelled under the assumption of infinitely slow motion, when momentum is set to zero. Note that the trajectory of the hydrogen molecule does not display any oscillatory behaviour and the bond length remains constant as the molecule does not vibrate in this model which contrasts with the Dynamic calculation (Fig.4).
Here motion is inertial:
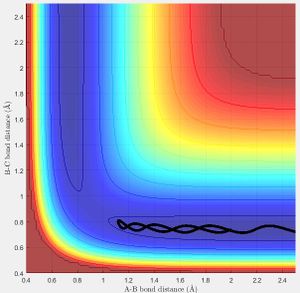
and therefore the vibration of the molecule can be seen by the oscillation of the trajectory for the forward reaction:
in Fig.4
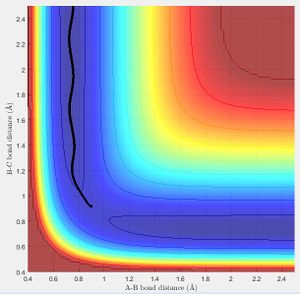
At large t (t = 50 s) with initial conditions r1 = 0.9072+0.01, r2 = 0.9072 :
r1(t)= 185.8 Å, r2(t)= 0.756 Å
p1(t)= 2.581 Ns, p2(t)= 1.241 Ns
Reversing the initial conditions r1 = rts, r2 = rts+δ, the trajectory is now offset to observe the reverse reaction as r2 is now increasing.
Reactive and Unreactive Trajectories
Transition State Theory (TST) assumes that classical behaviour is observed in the molecules. If the atoms do not have enough energy to overcome the activation barrier upon collision then the transition state is not reached. [2] This is as TST also assumes that the reactants are in 'quasi-equilibrium' with the activated transition state:
TST therefore predicts reaction rate values that are lower than experimental values as it does not account for quantum mechanical tunnelling effects; electrons are able to tunnel through the potential energy barrier to react instead. Nf710 (talk) 10:14, 26 May 2017 (BST) The main failure of TST is that you assume no recrossing
F - H - H system
PES Inspection
The reaction[3] is exothermic whereas the reverse reaction is endothermic. This correlates with the bond strength as H-H = 436 kJ/mol which is less that H-F = 568 kJ/mol, hence H-F is a stronger bond. More energy is therefore required to break the H-F bond than to form the H-H bond. [4]
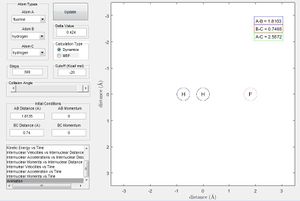
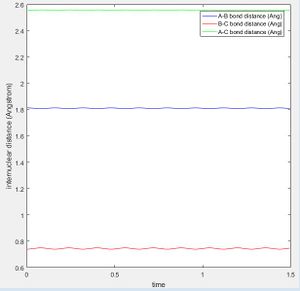
The transition state is located at the point where rHH = 0.74 Å, the H-H bond length and rHF = 0.8135 Å. rHF was found by setting it to 1.66 Å (H-F + H-H bond length = 0.92 + 0.74 Å) and then altered to find the point of minimum oscillation (at the energy maximum of the minimum energy path). pHH = pHF = 0 Ns for the same reason as earlier. Hammond's postulate states that the transition state resembles the species closest to it in energy. In this case, the transition state is closer in energy to and resembles the reactants (Fig. 10) and is at the point of minimum oscillation for the internuclear distances (Fig. 11).
The Activation Energy (Ea) was found by examining the potential energy surface plot of the transition state to find the reactant energy minimum (Fig. 12).
(Ea) for the forward reaction was found as the energy difference between the two (as in an energy profile diagram):

For the reverse reaction , found the same way, Ea:
Reaction Dynamics
Initial conditions that allow the F + H2 to react are that rHH= 0.74 Å; rHF=2.75 Å; pHH= -0.5 Ns; pHF= -2.0 Ns. The F atom must approach from a distance to the hydrogen molecule with sufficient momentum (and therefore energy) to react as long as the hydrogen molecule is not vibrating with too much energy (Fig. 13).
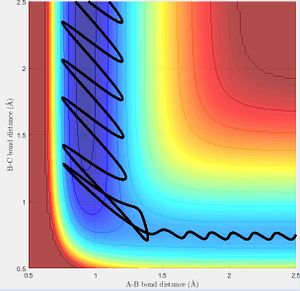
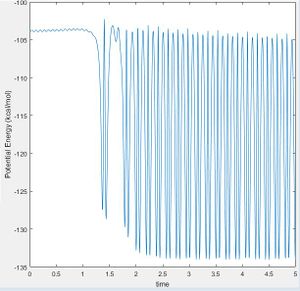
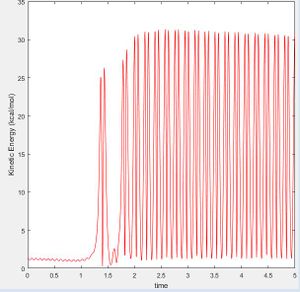
As the H-F bond is stronger than the H-H bond, the reaction is exothermic and some potential energy is converted to kinetic energy. As such, the potential energy of the products is lower than the reactants and due to the conservation of energy: where total energy E is equal to the sum of the kinetic energy (T) and the potential energy (U), the kinetic energy of the system is seen to increase by the same proportion as the potential energy decrease (Fig. 14 and 15). This can be observed by the change in vibrational bond energy, or as a release of thermal energy into the surroundings.
As the H-F bond exhibits a permanent dipole moment, this could be confirmed experimentally using IR spectroscopy as only molecules that demonstrate a change in dipole moment will be detected. The H-H bond would not be present in an IR spectrum due to its symmetry. The frequency of vibration could also be used to find the vibrational energy as . Additionally, a calorimeter could be used to detect the change in heat, or thermal energy of the system.
Polanyi's Rules
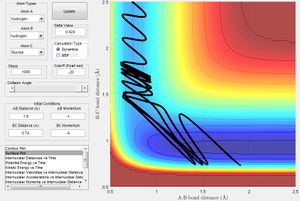
Forms of kinetic energy include vibrational, rotational and translational energy. Polanyi's Rules indicate that late transition state reactions are more likely to go to completion when vibrational energy is put into the system rather than translational. The opposite is true for reactions with an early transition state. These rules are empirical and therefore made by observation as in Fig. 14 and 15 below. [5]
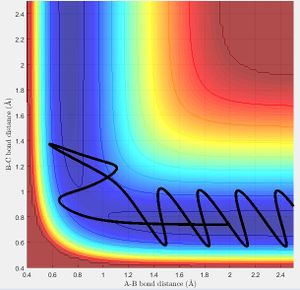
Therefore, vibrational energy enables the late transition state reactions to be more efficient (Fig. 14) whereas translational energy promotes early transition state reactions. Late transition state reactions with a higher ratio of translational energy in the system will either fail to react (Fig. 15) or will spend time oscillating about the transition state before the reaction completes, rendering the process inefficient.

Nf710 (talk) 10:26, 26 May 2017 (BST) A fairly good report, you could have shown 4 examples of 2 failures 2 reactive trajectories one from each side. You have shown an adequate understanding of TS theory, but there were places you could have gone into more detail.
References
- ↑ Atkins. P, Paula. J, Physical Chemistry, Oxford University Press, 2014, 839
- ↑ Atkins. P, Paula. J, Physical Chemistry, Oxford University Press, 2014, 894-5
- ↑ Aoiz. F. J, Bañares. L, Herrero, V. J, Sáez Rábanos. V, Classical dynamics calculations for the F + H2 -+ HF + H reaction on two recent potential energy surfaces, Chemical Physics Letters (218), 1994, 422-432
- ↑ Ben-Shaul. A, Haas. Y, Kompa. K. L, Levine. R. D, Lasers and Chemical Change, Springer-Verlag Berlin Heidelberg, 1981, 85
- ↑ Zhang. Z, Zhou. Y, Zhang. D. H, Czako. G, Bowman, J. M, J. Phys. Chem. Lett., 2012, 3 (23), 3416–3419

